BITCOIN Stairway to 134k.Bitcoin (BTCUSD) is unfolding a very interesting pattern since its April 07 bottom. That was at $74500 and since that level, it has been consistently targeting all 10k intervals above it: From 74k to 84k, 94k and is now on 104k.
Once it hit all those levels, the price consolidated, forming a very structured Channel Up. Now, the Channel Up may not hold forever but this consistency gives us the idea that it can continue targeting all those levels above it: 114k, 124k, 134k. If this pattern continues to hold for as much time as it has since the bottom, then we may see $134k by late June/ early July.
Do you think it is possible to stay this consistent for that long? Feel free to let us know in the comments section below!
-------------------------------------------------------------------------------
** Please LIKE 👍, FOLLOW ✅, SHARE 🙌 and COMMENT ✍ if you enjoy this idea! Also share your ideas and charts in the comments section below! This is best way to keep it relevant, support us, keep the content here free and allow the idea to reach as many people as possible. **
-------------------------------------------------------------------------------
💸💸💸💸💸💸
👇 👇 👇 👇 👇 👇
Btc!

Bitcoin Ascending Triangle (4H)BINANCE:BTCUSDT might be forming an ascending triangle on the 4H chart, with a horizontal resistance at $105k and support being the resistance of the broadening wedge we identified last week: Bitcoin Ascending Broadening Wedge (4H)
A sustained break above $105k would set the target at $109k, very close to ATH.

Bitcoin: $150,000, $180,000, $200,000 Or $220,000This is a question that nobody has been able to answer in the past 6 months: Will Bitcoin peak at $220,000 or $150,000?
Will the next All-Time High happen at $150-$160,000 or $180,000?
It is hard to say right now isn't it? But, consider this, if a new All-Time High will be hit within a few short weeks, or days, then there is plenty of room for Bitcoin to reach levels toward 200K. So maybe 150-160,000 is an easy target, it can go higher...
Now, it is true that we can guess and speculate about $250,000 or $220,000 or more, but there is no doubt that the next move is a rise, a strong rise, a continuation of the bullish move that started just a month ago. Five consecutive weeks closing green. As bullish as it gets.
Are you a SHORT trader?
You are about to be liquidated. There is till time, close your position now because Bitcoin is going up!
This is a friendly reminder.
Load up on the Altcoins.
Thanks a lot for your continued support.
Namaste.

1 Billion USD+ SHORTs Liquidation —Bitcoin BullishGood morning my fellow Cryptocurrency trader, I hope you are having a wonderful day.
We all know that life is not a game of checkers, it is more like fifth dimensional chess. It can be easy once we master how to play but it is actually hard to learn the game. The same goes for trading Cryptocurrencies, it is not an easy game.
Billions of dollars are about to be liquidated from SHORT traders. The All-Time High liquidation. This is a friendly reminder.
» If you are bullish, congratulations. You are good and you will do great.
» If you are bearish, there is still time, you don't have to lose knowing beforehand what will happen next.
The whales and market manipulators are setting up a trap right now, but they can never fool you because you know best.
What do you know?
» You know Bitcoin to be bullish because it is easily trading above 100K.
» You know Bitcoin is rising because it has been moving up since the 7-April low.
» You know a continuation will soon follow because we have signals coming from the Altcoins, the Stock market and Gold. Everything is pointing up.
I know you are smart and thank you for coming back and reading again. In only a matter of days, billions of dollars worth of SHORTs will be liquidated. Make sure not to be caught on the wrong side of the fence.
» Bitcoin is going up.
Namaste.


BTC | New ATH Incoming | + 135% ??A very interesting fractal from 2021 lead to a 135% increase - and a new all time high.
Bitcoin has been following similar patterns to the bullish twin-peaks in 2021. After a multi-month correction, the price proceeded to increase another 135% over the next few months. Some weeks fast, and some weeks sideways.
Is it possible that BTC follows a similar pattern - and increase another 135%, all the way to 170k?
Hec, I'd even be happy with just a 100% ! That would lead us up to around 149k, which can also be considered a phycological resistance zone.
While you're here! Check out this post on PEPE:
_________________
BINANCE:BTCUSDT

BTCUSD: This is a one way trip to $150k.Bitcoin is rising towards the overbought barrier on its 1D technical outlook (RSI = 68.126, MACD = 4169.000, ADX = 23.891) and that has rearely been a problem in the past as the market tends to thrive on overbought conditions. The minimum rally it delivered after a 1W MA50 rebound (like the one it is on now) has been +100%. TP = 150,000 by the end of summer.
## If you like our free content follow our profile to get more daily ideas. ##
## Comments and likes are greatly appreciated. ##

ETHBTC: Ethereum to gain massively against Bitcoin.Ethereum is overbought on its 1D technical outlook (RSI = 72.854, MACD = 228.230, ADX = 38.542) due to the rebound it initiated last week. Even though it is still on its very early stages, this rebound and statement of its strength is better viewed on the ETHBTC pair against Bitcoin. As you can see, ETHBTC bottomed on a level that it hasn't seen since January 6th 2020. The massive downtrend since 2023 is comparable to the one that started in 2018. Similar bottoms, similar 1W RSI sequences. We expect this rebound to be the main driver all the way to the 7 year Resistance level (R1). Traders of this pair can target 0.0800 on the long term.
## If you like our free content follow our profile to get more daily ideas. ##
## Comments and likes are greatly appreciated. ##

USDT Megaphones- Over the past few years, I've posted numerous charts on USDT and most of them have been spot on. In trading, what goes up must eventually come down. That's just how the market works. i will link my older analysis following this post.
- To predict a BTC pump using USDT dominance (USDT.D) is actually quite simple. When USDT printing slows down or stops, USDT dominance tends to rise, indicating less liquidity flowing into the market and BTC usually drops. But when more USDT is printed, it signals growing demand and inflow of capital. As a result, USDT dominance drops and BTC typically moves up.
- back to the trend :
You can clearly identify two megaphone patterns:
– The first began in 2018 and ended in 2022, following Bitcoin’s bull run to $70K. ( Green ).
– The second started in 2022 and is still unfolding today." ( Yellow ).
- the key point to look closely is 6.40% Dominance.
- From 2022 to 2024 this point acted multiple times as support.
- but from January 2024 ( Orange Vertical dotted Line) it started to act as resistance.
- As I always say, support has a nasty habit of turning into resistance, and once again, that’s exactly what happened here."
- USDT has now entered a bearish megaphone pattern, and I expect it to continue moving lower, if USDT.D broke down 3.80%, 2.70% is coming next.
Based on this, BTC is likely to move higher, the bull run isn’t over, time to stack more sats !
Happy Tr4Ding !

BITCOIN Analysis (1H)We have a CHoCH (Change of Character) in the internal structure, and a bullish order block has been cleared. Price is currently within a supply zone, and there is a resistance line above the current price level.
It appears that price is aiming to pull back to lower support zones. These lower zones are fresh and unmitigated, so we expect that upon reaching them, price may bounce back upward toward the previous high.
A 4-hour candle closing above the invalidation level would invalidate this bias.
Do not enter the position without capital management and stop setting
Comment if you have any questions
thank you

XRP – Long Swing Trade Setup Near Key SupportXRP is pulling back toward a major support zone around $2.25, a level that previously acted as a breakout region. With the market showing signs of rotating into strength across large caps, this could offer a solid risk-reward entry for a medium- to long-term swing trade.
🔹 Entry Zone:
$2.25 support zone
🎯 Take Profit Targets:
🥇 $2.60 – $2.75 (prior supply zone & range mid-point)
🥈 $3.15 – $3.40 (macro resistance / high timeframe target)
🛑 Stop Loss:
Just below $2.15 (invalidates the reclaim thesis & opens risk to deeper correction)

ONDO (Ondo Finance) – Long Swing Trade Setup Near Key SupportONDO is retracing alongside broader market weakness and is approaching a key support zone around $0.95, which previously acted as a breakout base. This area now presents a potential high-reward swing trade if buyers step in to defend the level.
🔹 Entry Zone:
$0.95 (critical horizontal support & potential demand zone)
🎯 Take Profit Targets:
🥇 $1.15 – $1.25 (prior local highs and resistance)
🥈 $1.40 – $1.55 (macro range extension)
🛑 Stop Loss:
Just below $0.83 (breakdown below previous structural low)

BTC/USDT Short Side TradeEntry 102650
SL 102800
Target 101700
There is a strong selling pressure and also its a fibo zone

Correction Imminent? Will Bitcoin Drop Or Continue Rising?As we can see here, Bitcoin is challenging resistance very close to the All-Time High. This is a price range. The highest Bitcoin was able to hit was $105,850, right below $106,000. Will Bitcoin drop now, even if short-term, or continue moving higher?
» Bitcoin will continue higher and produce a minimum of retrace.
Bitcoin is very likely staying above $100,000 and after some consolidation continue higher to hit a new All-Time High.
While Bitcoin moved above $100,000 on the 8th of May, there isn't any bearish pressure nor bearish momentum. The bears have no strength.
If there is selling happening, the bulls are more than ready and happy to buy everything up. Anyone and everyone selling now will simply lose their coins and miss a huge opportunity because Bitcoin is already growing and will continue to grow. It is normal to see some consolidation after a strong resistance level is hit. This resistance stands around $105K. Once this level breaks, we will see additional growth.
Bitcoin is bullish.
The market is bullish.
Any retraces are just an opportunity to buy-up, rebuy and reload. Do not sell your coins, hold strong. Hold easy or even buy more because Bitcoin is going up!
It can start growing right away, within hours or it can take a maximum of few days but the next major move is up. When Bitcoin starts going, it never looks back. The market will continue growing. Rest easy and buy more Altcoins.
Namaste.

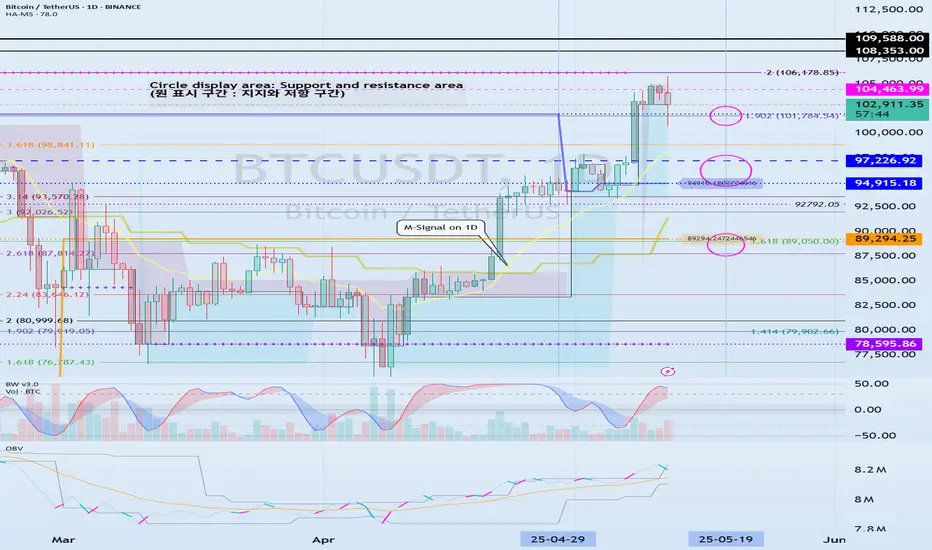
Important section: 101947.24-106133.74
Hello, traders.
If you "Follow", you can always get new information quickly.
Have a nice day today.
-------------------------------------
(BTCUSDT 1D chart)
It has touched the Fibonacci ratio 1.902 (101784.54) and is rising.
The key is whether it can receive support near the StochRSI 50 indicator (102971.99) and rise.
If not, it can fall to the 94915.18-97226.92 area.
Since the HA-Low indicator is formed at the 89294.25 point, it is important whether the price can be maintained above that point.
If the StochRSI indicator falls below the overbought range and then rises while moving sideways around the Fibonacci ratio range of 1.902 (101784.54) ~ 2 (106178.85), it is expected to renew the ATH.
Even if it falls more than expected, if it rises along the M-Signal indicator on the 1D chart, it is highly likely to renew the ATH.
----------------------------------------------------------
I will explain the newly added indicators, StochRSI 50, StochRSI 80, and StochRSI 20.
The disadvantage of interpreting the StochRSI indicator added as an auxiliary indicator is that it cannot determine the price movement.
Because of this, when interpreting the StochRSI indicator so far,
- Whether it is in the overbought or oversold zone,
- Whether StochRSI is above or below the 50 point,
we interpreted it as above.
Therefore, we added the price movement to the StochRSI indicator to check the movement more accurately.
-
The StochRSI 50 indicator is literally created when the StochRSI indicator passes the 50 point.
Therefore, we need to think about a response plan based on the price StochRSI 50 indicator.
-
The fact that StochRSI 80 is created means that the StochRSI indicator has risen above 80.
Therefore, in order to continue the upward trend, StochRSI must rise above 80.
If StochRSI 80 is not created and only StochRSI 20 is created, the upward trend will occur when the price is maintained above the StochRSI 50 indicator.
-
The fact that StochRSI 20 was created means that the StochRSI indicator has fallen below 20.
Therefore, in order to continue the downtrend, it must fall below StochRSI 20.
If StochRSI 20 is not created and only StochRSI 80 is created, the downtrend will occur when the price is maintained below the StochRSI 50 indicator.
-
Thank you for reading to the end.
I hope you have a successful trade.
--------------------------------------------------
- This is an explanation of the big picture.
I used TradingView's INDEX chart to check the entire range of BTC.
I rewrote the previous chart to update it by touching the Fibonacci ratio range of 1.902 (101875.70) ~ 2 (106275.10).
(Previous BTCUSD 12M chart)
Looking at the big picture, it seems to have been following a pattern since 2015.
In other words, it is a pattern that maintains a 3-year bull market and faces a 1-year bear market.
Accordingly, the bull market is expected to continue until 2025.
-
(Current BTCUSD 12M chart)
Based on the currently written Fibonacci ratio, it is displayed up to 3.618 (178910.15).
It is expected that it will not fall again below the Fibonacci ratio of 0.618 (44234.54).
(BTCUSDT 12M chart)
I think it is around 42283.58 when looking at the BTCUSDT chart.
-
I will explain it again with the BTCUSD chart.
The Fibonacci ratio ranges marked in the light green boxes, 1.902 (101875.70) ~ 2 (106275.10) and 3 (151166.97) ~ 3.14 (157451.83), are expected to be important support and resistance ranges.
In other words, it seems likely to act as a volume profile range.
Therefore, in order to break through this section upward, I think the point to watch is whether it can rise with support near the Fibonacci ratios of 1.618 (89126.41) and 2.618 (134018.28).
Therefore, the maximum rising section in 2025 is expected to be the 3 (151166.97) ~ 3.14 (157451.83) section.
To do that, we need to look at whether it can rise with support near 2.618 (134018.28).
If it falls after the bull market in 2025, we don't know how far it will fall, but considering the previous decline, we expect it to fall by about -60% to -70%.
So, if the decline starts near the Fibonacci ratio 3.14 (157451.83), it seems likely that it will fall to around Fibonacci 0.618 (44234.54).
I will explain more details when the downtrend starts.
------------------------------------------------------
Bitcoin at PRZ! Is This the Calm Before a Drop?As I expected in yesterday's idea , Bitcoin ( BINANCE:BTCUSDT ) started to rise from near the Support line and hit the Target .
Bitcoin is trading near the Potential Reversal Zone(PRZ) , the upper line of the ascending channel(minor) , and the Resistance line .
In terms of Elliott Wave theory , it seems that Bitcoin has successfully completed the microwave B of the main wave 4 in the ascending channel(minor). A break of the lower line of the ascending channel(minor) could be a sign of the completion of this wave. The corrective structure of the main wave 4 so far could be a Zigzag(ABC/5-3-5) .
I expect Bitcoin to drop to at least $100,923 AFTER breaking the lower line of the ascending channel(minor) and breaking the Support line, the next target could be the lower line of the ascending channel(major) .
Cumulative Short Liquidation Leverage: $106,943-$105,913
Cumulative Short Liquidation Leverage: $105,525-$104,500
Cumulative Long Liquidation Leverage: $100,763-$99,774
Note: If Bitcoin goes above $105,300, we can expect more pumps.
Note: If Bitcoin touches $99,400, we should expect further declines.
Please respect each other's ideas and express them politely if you agree or disagree.
Bitcoin Analyze (BTCUSDT), 1-hour time frame.
Be sure to follow the updated ideas.
Do not forget to put a Stop loss for your positions (For every position you want to open).
Please follow your strategy and updates; this is just my Idea, and I will gladly see your ideas in this post.
Please do not forget the ✅' like'✅ button 🙏😊 & Share it with your friends; thanks, and Trade safe.
