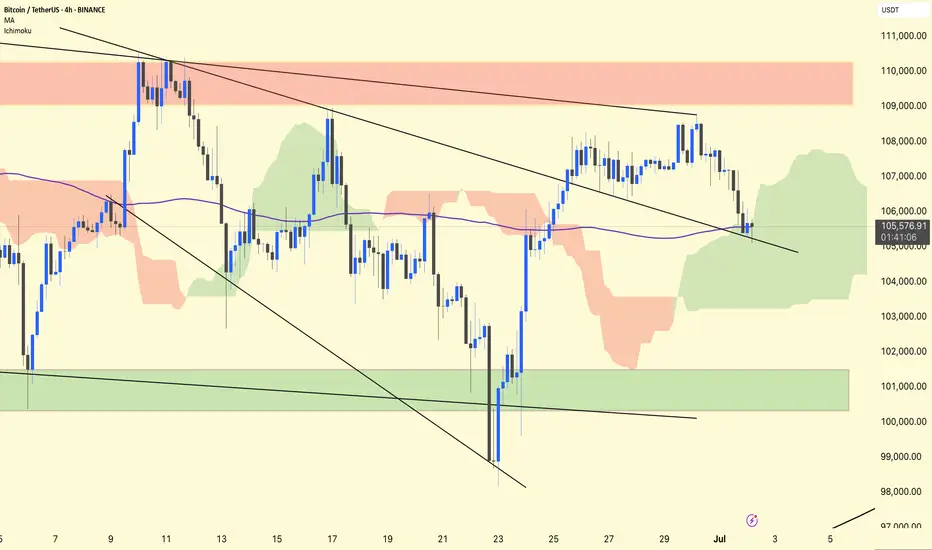
BTC/USDT 4H Analysis.
BTC remains in a retest phase after breaking out of the first descending broadening wedge.
The price has returned to test the upper wedge trendline, which is now acting as support around ~$105,500.
The purple 1 00-period MA (~105,570) overlaps this retest zone, adding additional confluence to the support.
Ichimoku
BTC is inside a green cloud, indicating indecision but not a confirmed trend reversal.
The cloud provides dynamic support in the ~$104,500–105,500 area.
Stay alert!
Btc!
Bitcoin - An Epic Move Awaits!Bitcoin gained 13% in H1 2025, outperforming Ethereum and Solana, which dropped ~25% and ~17% respectively—highlighting BTC's strength in turbulent market conditions.
Institutional wedge: spot-BTC ETFs saw huge inflows—BlackRock’s took in $336M, and total crypto product inflows approached $45B+ this year.
AI models foresee BTC holding $105K+ by end-June, with ChatGPT pointing to $118K and Grok forecasting $108K, based on momentum and ETF flows.
We see BTC holding the 20 MA and spiking to new all time highs.

The Critical Blue Line – Will Bitcoin Soar or Sink
🔹 Bitcoin Technical Analysis – Key Blue Line, Bear Trap Possibility & Long-Term Scenario
On the Bitcoin chart, the blue horizontal level has acted multiple times as both support and resistance. The price has broken it several times but failed to sustain above, indicating high-volume decision-making zones by institutions and large players.
📉 Why this pattern keeps repeating:
Strong supply and demand concentration at this level.
Inability to break and hold shows market indecision.
Repeated fakeouts are likely used to shake out weak hands.
🔍 Important hidden scenario: Bear Trap Potential
If the price dips below the blue line but quickly reclaims it, it may form a bear trap, tricking short sellers into entering prematurely. This move could ignite strong bullish momentum from trapped sellers and renewed buyers.
🔮 If price holds above the blue line:
Signals market strength and potential bullish structure shift.
Targets:
109,800
117,200
120,000+ (Long-term)
📛 If support fails again:
Retracement toward the lower channel near 101,000 or lower is possible.
📊 Conclusion:
This zone is one of the most critical decision points in the current market. Traders should combine volume, candlestick behavior, and confirmation signals to avoid getting trapped by fake breaks

Bitcoin - Price struggles below resistance, correction to $104k?This 4-hour chart for BTC/USD illustrates a detailed technical analysis scenario highlighting key resistance and support zones, as well as a critical fair value gap (FVG). The chart shows that Bitcoin is currently facing strong resistance in the $108,000 to $109,000 range. This area has been tested multiple times without a successful breakout, indicating significant selling pressure. The price is currently trading just below this resistance zone, struggling to gain momentum above it.
Support zone in the consolidation
A clear support level has been marked in the recent consolidation area around $106,000. This zone has served as a short-term base during the recent upward movement, and a retest here could provide a temporary bounce or pause in bearish momentum. However, if this support fails to hold, the next major area of interest lies within the 4-hour bullish FVG between approximately $103,000 and $104,000.
4H FVG
There is a clear 4-hour bullish FVG between approximately $103.000 and $104.000. This level can act as a strong support for buyers after filling up the inbalance zone. it is highly important to hold this level as support and not to break below it.
Upside potential
On the upside, if BTC can defend the support in the consolidation zone and reclaim momentum, a push back to the $108,000 to $109,000 resistance area is probable. A successful breakout above this zone would invalidate the bearish scenario and may trigger a bullish continuation, with the potential to reach higher targets such as $111,000 or beyond.
Downside risk
The downside risk becomes more pronounced if BTC breaks below the 4H FVG. A sustained move beneath this level would likely signal weakness in buyer interest and potentially open the path to deeper downside targets. In such a scenario, the price could accelerate lower toward the psychological support level at $100,000. This round number also carries technical and emotional significance for traders, which could create both a strong support area and potential buying interest.
Conclusion
In conclusion, Bitcoin remains at a critical juncture. The key levels to watch are the support within the current consolidation and the 4H FVG imbalance zone. A breakdown below the FVG could lead to a decline toward $100,000, while holding above these levels keeps the door open for another test of resistance at $108,000 to $109,000. A breakout from there would indicate bullish strength and a shift in market sentiment. Traders should remain cautious and reactive to how price behaves around these critical areas.
Disclosure: I am part of Trade Nation's Influencer program and receive a monthly fee for using their TradingView charts in my analysis.
Thanks for your support.
- Make sure to follow me so you don't miss out on the next analysis!
- Drop a like and leave a comment!

Bitcoin Fractal, increase to $116k Hi Everyone☕👋
BINANCE:BTCUSDT
Been such a long time since I posted. Today I'm looking at BTCUSDT, and I'm looking at the previous all time high cycle and what we were seeing (the pattern aka fractal).
Here's why we're likely going a little higher.
First correction of -32%
Followed by first peak, ATH
Correction, then the second peak and the REAL ath. Which is where we likely are:
Interesting to note that the previous time, the second ath was NOT THAT MUCH HIGHER. This should be considered to manage expectations in terms of how high we can go. Anything above +6% is a bonus.

XMR Long Swing Setup – 50% Retrace with Structure ShiftXMR rallied from $200 to $400 and has now pulled back 50% of that move. With price reclaiming the 20-day SMA and a recent structure shift, there’s a solid setup forming with ~60% probability of continuation.
📌 Trade Setup:
• Entry Zone: $305 – $315
• Take Profit Targets:
o 🥇 $360
o 🥈 $400
• Stop Loss: Daily close below $300

Bitcoin can turn around from seller zone and start to declineHello traders, I want share with you my opinion about Bitcoin. The price previously broke above the support line and made a strong bullish move from the buyer zone (99300–100500 points). After the breakout, the price started rising steadily and is now approaching the Seller Zone (108500–109500), which also coincides with the resistance line of the downward channel. This area has shown strong bearish pressure in the past. Every time the price entered this zone, it quickly reversed. It’s a key area where many traders seek short-term opportunities. Currently, price is just entering this zone again and showing early signs of weakening momentum. Given the channel's structure, past price behavior near this resistance level, and the presence of the seller zone, I expect BTCUSD to turn around soon. Once the price rejects this level, I anticipate a reversal and a move back into the channel, continuing the downward trajectory. My first target is set at 103000 points, near the center of the range and above the support level (100500). This area has been tested multiple times before and may act as a strong buffer again. Please share this idea with your friends and click Boost 🚀
Disclaimer: As part of ThinkMarkets’ Influencer Program, I am sponsored to share and publish their charts in my analysis.

HelenP. I Bitcoin may continue grow and break resistance levelHi folks today I'm prepared for you Bitcoin analytics. After looking at this chart, we can see how the price broke the resistance level, which coincided with the resistance zone, and continued to move down next. When the price almost reached the support level, it turned around and tried to grow, but failed and dropped to the support zone. After this movement, BTC turned around and made an impulse up to the resistance zone, breaking the resistance level one more time. Then it reached the trend line and started to decline in a broadening wedge, where it broke the resistance level again. Later, the price even declined below the support level, breaking this level too and falling to the support line of the wedge pattern. Next, price turned around and made a strong impulse up to the resistance level, thereby breaking the support level with the trend line, exiting from the broadening wedge too. Bitcoin made a retest of the trend line and then continued to grow. In my opinion, BTCUSD will correct to almost to trend line and then rise to the resistance level. Then it can break this level and continue to move up; therefore, I set my goal at 111000 points. If you like my analytics you may support me with your like/comment ❤️
Disclaimer: As part of ThinkMarkets’ Influencer Program, I am sponsored to share and publish their charts in my analysis.

HolderStat┆BTCUSD forming the triangleBINANCE:BTCUSDT has reclaimed the $106,000 support and broken out of a triangle structure. The path now leads toward 111K, a major resistance zone. Similar setups have triggered strong rallies before, and bulls are defending levels aggressively.

SHORT ON BITCOINBITCOIN has continue to create lower highs at a major resistance zone.
I will be selling bitcoin looking to make over 8000 to 20,000 points.

Bitcoin is bullish now & many Traders don't see it !!!I currently expect the price to correct slightly, as indicated on the chart, and then pump by about 6% from the PRZ . This signal is reinforced by strong positive divergence and a wedge pattern. In summary, the PRZ is a solid entry point, derived from the confluence of touchlines and pivots. However, if the price ignores this zone and falls below it, my analysis will be invalidated.
Best regards CobraVanguard.💚

BITCOIN Can this Inverse Head and Shoulders deliver $168000?We saw yesterday how Bitcoin (BTCUSD) has been trading within a short-term Channel Down pattern, which as mentioned was just a Bull Flag on the long-term scale.
Today we examine this on the longer term time-frame and what stands out on 1D is an Inverse Head and Shoulders (IH&S). Such patterns are incredibly bullish but are more often seen on market bottoms initiating strong long-term bullish reversals.
This time it has been formed on a 1W Bull Cycle uptrend (Channel Up), so it technically serves as a (very) long-term Accumulation Phase between the Cycle's previous All Time High (ATH) and the next one, which most likely will be the final (peak) of the Bull Cycle.
As mentioned numerous times in the past, IH&S patterns target their 2.0 Fibonacci extension level once broken. That is now at $168000 and falls well within the broader 150 - 200k range that most studies have as a potential Cycle Top.
So do you think that is realistic to expect? Feel free to let us know in the comments section below!
-------------------------------------------------------------------------------
** Please LIKE 👍, FOLLOW ✅, SHARE 🙌 and COMMENT ✍ if you enjoy this idea! Also share your ideas and charts in the comments section below! This is best way to keep it relevant, support us, keep the content here free and allow the idea to reach as many people as possible. **
-------------------------------------------------------------------------------
💸💸💸💸💸💸
👇 👇 👇 👇 👇 👇

BTC/USD Short Setup – Breakdown from Bear Flag Edge🚀||| 👆Your Boost is appreciated in Advance👆 |||🚀
Thesis: Bitcoin is trading within a well-defined descending channel, potentially forming a bear flag on the higher time frame. Price is currently hovering just below the key resistance zone near $108,600 (“The Edge”), failing to reclaim the upper boundary of the flag.
==================================================================
Entry: 🔻 Short at $106,850 – Price is rejecting the upper channel resistance and failing to break above “The Edge”
Stop-Loss: 🔺 $109,000 – Above the recent swing high and invalidation of the flag structure
Take-Profit 1: ✅ $104,700 🎯
Take-Profit 2: ✅ $102,400 🎯
Optional extended:
TP4: $98,000 – Full measured move of the flag breakdown
Risk-Reward Ratio: ~1:1 to 1:4 depending on target
====================================================================
#MJTrading
#BTCUSD #Bitcoin #CryptoTrading #ShortSetup #BearFlag #TechnicalAnalysis #PriceAction #MarketStructure #SwingTrade #TradingView

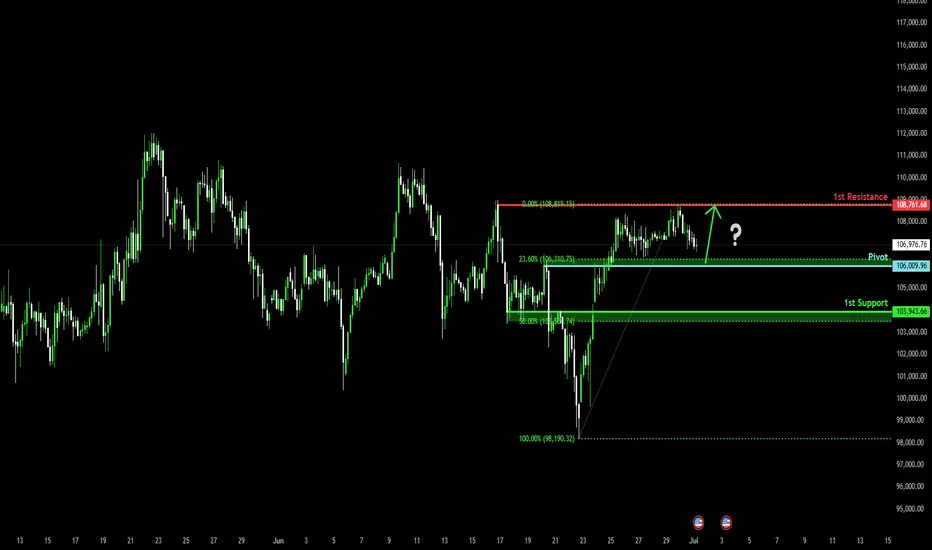
Bullish bounce?The Bitcoin (BTC/USD) is falling towards the pivot which acts as a pullback support and could bounce to the 1st resistance.
Pivot: 106,009.96
1st Support: 103.943.66
1st Resistance: 108,761.68
Risk Warning:
Trading Forex and CFDs carries a high level of risk to your capital and you should only trade with money you can afford to lose. Trading Forex and CFDs may not be suitable for all investors, so please ensure that you fully understand the risks involved and seek independent advice if necessary.
Disclaimer:
The above opinions given constitute general market commentary, and do not constitute the opinion or advice of IC Markets or any form of personal or investment advice.
Any opinions, news, research, analyses, prices, other information, or links to third-party sites contained on this website are provided on an "as-is" basis, are intended only to be informative, is not an advice nor a recommendation, nor research, or a record of our trading prices, or an offer of, or solicitation for a transaction in any financial instrument and thus should not be treated as such. The information provided does not involve any specific investment objectives, financial situation and needs of any specific person who may receive it. Please be aware, that past performance is not a reliable indicator of future performance and/or results. Past Performance or Forward-looking scenarios based upon the reasonable beliefs of the third-party provider are not a guarantee of future performance. Actual results may differ materially from those anticipated in forward-looking or past performance statements. IC Markets makes no representation or warranty and assumes no liability as to the accuracy or completeness of the information provided, nor any loss arising from any investment based on a recommendation, forecast or any information supplied by any third-party.
do not SHORT Bitcoin with 20XA consolidation range happens when the market trades sideways, in a neutral capacity. This sideways trading is neither bearish nor bullish, thus neutral. The bearish or bullish tendencies can only be defined based on the broader market structure.
If the consolidation range develops coming from a major drop, you can say that the market is bearish and the consolidation a bearish consolidation even if the breakout happens to the upside. Once it happens to the upside we can say that a reversal developed but the tendencies were bearish nonetheless.
If the consolidation range develops coming from a major rise, you can easy say while being correct that the market is bullish and the consolidation phase a bullish one, because of the bigger structure, previous price action and the chart.
Bitcoin is consolidating with bullish tendencies but there is a boundary which we call resistance and another boundary which we call support, this is the trading range. When the market is ranging, this is when margin traders lose the most because the trend remains hidden and money tends to be made when the market is in a clear trend.
Whenever the upper boundary gets challenged we get a retrace and a test of support. Whenever the lower boundary gets tested prices recover and move back up. This process gets repeated for as long as it is needed to remove all the weak hands, most of the signals are pure noise.
This is the situation in which we find Bitcoin today. Ultra-bullish but sideways and anything can happen short-term. Do not SHORT Bitcoin with 20X. You might end up with some fast and easy profits.
Thank you for reading.
Namaste.

BTC - Consolidation, Manipulation & DistributionMarket Context
The current price action unfolds within the broader structure of a bullish leg that began after a sharp reversal near 97,000. This impulsive rally created a clear Fair Value Gap on the 4-hour chart—left behind as price surged upward with minimal resistance. Following this move, the market entered a consolidation phase, forming a range that has now broken to the upside. This kind of breakout often attracts breakout traders, but in this case, the context signals something more calculated.
Buy Side Liquidity Sweep Following Consolidation
The breakout above the consolidation range led directly into a Buy Side Liquidity Sweep, as price ran the highs just above the marked range. These highs acted as a magnet for liquidity—stop losses from short sellers and buy stops from breakout traders were likely pooled in that area. The quick rejection following this sweep suggests the move was not backed by genuine demand, but rather served the purpose of liquidity collection by larger players.
Manipulation and Distribution
This is a textbook example of manipulation into liquidity. Price was engineered to move upward into a zone of interest, taking out the Buy Side Liquidity before sharply reversing. The strong rejection signals distribution—institutions likely offloaded positions into the influx of late buyers. This kind of pattern often precedes a larger markdown, particularly when followed by lower timeframe bearish structure breaks.
Unfilled Fair Value Gap as a Draw
Beneath the price lies an unfilled Fair Value Gap, a zone of imbalance left behind by the earlier impulsive move. These areas often act as magnets for price, especially once liquidity objectives to the upside have been completed. Now that the sweep has occurred and distribution is underway, there is a strong probability that price will begin to seek rebalancing within this Gap. The area between 104,000 and 103,500 stands out as a high-probability target for the next leg down.
Execution Insight
If you're looking to enter short, it may be wise to wait for confirmation on a lower timeframe—such as a bearish break of structure or an internal Gap forming during the retracement. A 5-minute timeframe can often give early signs of rejection or supply stepping in. Being patient and allowing the market to reveal intent is crucial, especially after liquidity-driven moves like this.
Final Thoughts
Price doesn’t move randomly—it seeks liquidity and fills inefficiencies. This chart beautifully illustrates that logic, from engineered consolidation to a manipulative sweep, and now potentially toward rebalancing.
If you found this breakdown helpful, I’d really appreciate a like—it helps support the work and keeps this kind of content going. Let me know in the comments what you think, or if you’re seeing it differently. I'm always up for a good discussion.

BTC on Close Compression -110k?Not now, but looks like will test 107,800 again from the point, what say?

TRX Approaching Cup Breakout – Market Decision Imminent
TRX/USDT – Daily Chart Analysis
TRX is shaping a textbook Cup Pattern on the daily timeframe — a strong bullish continuation signal if confirmed. Price has gradually curved upward, and we are now testing the key resistance area at 0.29–0.30.
📌 Key Scenarios:
🔹 Bullish Breakout Scenario:
A confirmed breakout and daily close above 0.30 would validate the cup formation and set the stage for a rally toward the next target zones at 0.35 and 0.45 — measured based on the cup’s depth.
🔹 Bearish Rejection Scenario:
If the resistance holds, expect a pullback toward the midline (~0.24) for potential accumulation and base-building before the next move.
💡 Volume confirmation and breakout momentum are critical to watch here. The market is approaching a decision point.
🟢 Our directional bias remains bullish — we anticipate the breakout to occur, leading to an upward continuation. However, we’ll wait for confirmation of the breakout and completion of the pattern before entering a long position.

BTC - Bullish SOON!Hello TradingView Family / Fellow Traders. This is Richard, also known as theSignalyst.
BTC has been in a correction phase, and it feels like it's taking forever! ⏳
As long as the blue trendline holds, the overall bias remains bullish. 📈
As BTC approaches the blue trendline—perfectly aligning with a demand zone and support—we'll be watching for trend-following longs to catch the next big impulse move upward. 🚀
For now, we wait! ⏳
📚 Always follow your trading plan regarding entry, risk management, and trade management.
Good luck!
All Strategies Are Good; If Managed Properly!
~Rich

BTCUSD: $150,000 on a repetitive pattern.Bitcoin is neutral on its 1D technical outlook (RSI = 54.823, MACD = 486.400, ADX = 23.402) possibly going through the last consolidation before the next breakout to a new ATH. The whole 2023-2025 Bull Cycle has been on a repetitive pattern, bottoming on the HL Zone and peaking on the HH trendline, while forming clear wave structures. According to this, the next HH should be around 150,000 (TP).
## If you like our free content follow our profile to get more daily ideas. ##
## Comments and likes are greatly appreciated. ##

SOLANA → BINANCE:SOLUSDT.P is consolidating after breaking through trend resistance. The market trigger is 148.0, and Bitcoin is provoking the market to recover...
The market is buying back all the losses. SOL breaks the local downward resistance and forms consolidation with a trigger of 148.0. The market has come to life following the rallying Bitcoin. If the general trend continues, SOL may break out of the accumulation zone and form a distribution towards 154.0
The latest retest of resistance is provoking a correction. Before rising, the price may test the zone of interest at 144 or the lower boundary of consolidation at 142.2. The ideal scenario would be a false breakdown of support at 142.2 before rising.
Resistance levels: 148.0, 154.2
Support levels: 142.2, 137.5
Fundamentally, the situation for the crypto market is improving. Technically, the market is also showing positive dynamics. SOL is consolidating after growth, which is generally a positive sign. Now we need to wait for the price to break out of consolidation and continue its growth. One of the signs of this is a rebound from the 0.5 range and a quick retest of resistance with a gradual squeeze towards the trigger.
Best regards, R. Linda!

BTC needs to hold up here. BTC is at a very important level. A role over is expected, but without market structure confirmation, it's important to consider the possibility of a move up. The bearish thesis on lower timeframes is the easy one. Ensure your bullish thesis is also considered. A confirmed lower low or a lower high would confirm a CHOCH reversal.
Full TA: Link in the BIO

BTC Consolidates Above $100K — Bullish Structure Remains IntactKey Support Holding Firm:
Bitcoin is consolidating above the critical $100,000–$105,000 support zone, a former resistance area from early 2025. Holding this level preserves the broader bullish structure.
Short-Term Noise, Long-Term Strength:
While recent price action shows some lower highs and lows, the long-term uptrend that began in April remains fully intact. This is typical consolidation behavior within a strong bull market.
Wedge Formation Points to Breakout:
A six-month wedge pattern continues to develop, often a precursor to a powerful breakout. If resolved to the upside, the next leg could target the $130,000–$135,000 range.
Outlook Remains Bullish:
As long as Bitcoin holds above $100,000, there’s no technical basis for a bearish scenario. This remains a constructive pause within a dominant uptrend.
#Bitcoin #BTC #CryptoMarket #TechnicalAnalysis #Bullish #SupportAndResistance #WedgeBreakout #LongTermTrend #MarketOutlook #PriceAction
