Update! $BTC range Bound... Consolidation? Breakout? Breakdown? CRYPTOCAP:BTC appears to have formed a range: between approximately between 76800 and 104,300
Current price: 104300
Here are the key observations:
Key resistance zone is around 104300 - Price has tested this level multiple times but failed to close above it decisively.
Clear to say that A break above which will lead to All time highs possibly up to 135k
If #BTC Bitcoin continues to reject this level then expect these layers of support to be tested:
97700 and then 91100
CRYPTOCAP:BTC remains bullish if prices remains above 91100. Further break down will lead to bottom of range 84100 and 76800 (coinciding with 200 EMA )
Trading Implications:
For Longs: Avoid new positions unless there's a breakout with volume above $105,000.
For Shorts: This is a possible scalp opportunity near the top of the range, with a stop slightly above $105,000.
Not financial Advice!
Btc-bitcoin

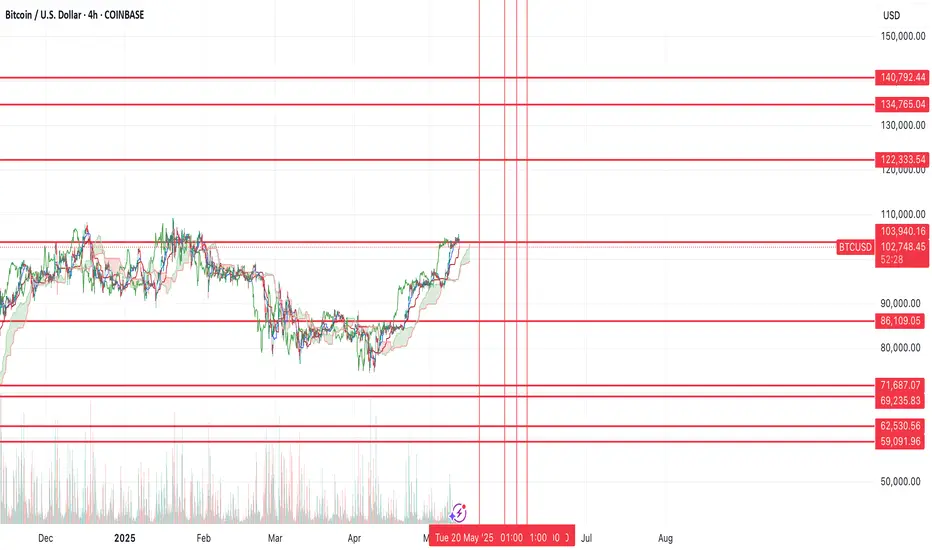
$BTC probability still favors new lowBTC has had a strong rally back into the prior resistance and unless we can break above the prior highs, I still think probability still favors more downside (and I think we see a new low).
I've marked off support levels and resistance levels as I think this will largely be the range over the next year.
My base case as of now, is that we see one more low down in the $69k-$62k region before we start a new run to the highs above ($122k+). Another possibility is that we sweep the lows and bounce at $72k, then move up towards the highs.
That said, the reason I think lower is due to the massive imbalance on the chart that needs to get resolved.
Overall I still think we're in a bullish trend, but that we continue to pullback before the final move higher.
MSTR (Strategy) coming up to $395, the smaller resistance levelNASDAQ:MSTR has rebounded from the bottom fairly fast compared to other stocks and indexes. It's even performed better than Bitcoin itself. However it should be hitting heavy resistance now near 395-400 and above is only heavier resistance. It's time for a pullback and a breather for MSTR. Target is the Point of Control near $350, before going higher. However we could turn bullish again before reaching $350
I personally know someone who played with fire by buying MSTR options calls while it was dropping before, meaning he was trying to catch a falling knife and got burnt finally. He lost nearly $500,000 because of it. So I don't mess with options personally, however I will margin trade with stocks and trade futures, forex and leverage trade cryptocurrencies.

12/05/25 Weekly OutlookLast weeks high: $104,972.46
Last weeks low: $93,385.49
Midpoint: $99,178.97
Bitcoin climbs over 12% from weekly low to weekly high, an incredible achievement despite a mixed performance in Tradfi. A pattern we've seen since the $74,500 double bottom following Liberation day goes; A strong rally for a week, consolidation in a tight trading range for a week, then repeat. Should this pattern continue we should see consolidation between weekly high and $102,075 (0.75 line).
CPI & PPI take place this week on Tuesday and Thursday respectively, inflation is still a big talking point but baring a crazy print I would be surprised if these events move BTC. In the last few hours at time of writing The US has reduced tariffs on China to 30% for 90 days, China has reduced tariffs on the US down to 10%. To me this signifies the worst of the trade war narrative is behind us.
This week I will be tracking altcoins with strong fundamentals as BTC.D rolls over from its highest point since January '21, ETH has already had a strong breakout from the downtrend and with BTC at ATH levels with strong resistance this should be the time to see altcoin strength and play catch-up.
Good luck this week!

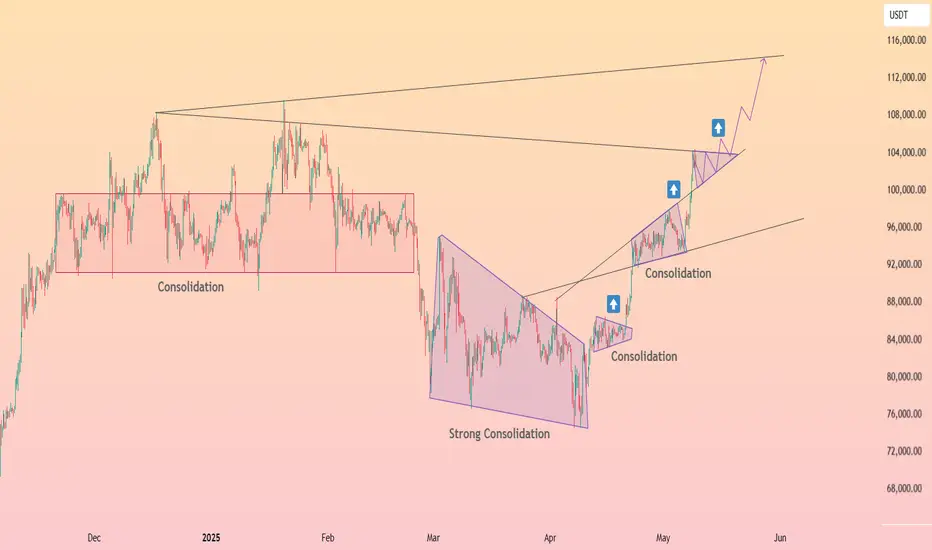
CYCLE 4 | Pull back complete!Hi team,
The purpose of this post is to close out our thoughts posted back in December 2024 with the suggestion of a possible 30-40% correction scenario we envisioned BTC might look to complete over the upcoming months, and what we wanted to see the bulls achieve in order for Cycle 4 to move into its final phase. Using this set up we can look towards where BTC may look towards from here.
These steps were outlined in the below two posts:
CYCLE 4 | CME GAP: Bull Cycle Period First Major Pull Back (Dec 20 - 2024)
CYCLE 4 | UPDATE - BTC Possible Next Move into Sell Zone (Feb 14 - 2025)
REVIEWING WHAT HAPPENED
In these posts we suggested
1) BTC will likely pull back and look for opportunities for support
2) We outlined the following levels
* Demand Zone and bottom of our defined Price Channel (92-90K)
* Daily Order Block (OB) (88.5-87.9k)
* CME GAP - down as far as ~77K and suggested a wick on the weekly down to our March 2024 high would not be out of the question
These levels all were taken out with our worst-case forecast achieved. Bulls then successfully preceded to complete the requirements we set out in these posts:
1) Uptrend Channel: No Open / Close weekly candle outside of, push back within and HOLD as support / HOLD and remain inside of our cycle uptrend channel (keep BTCs relationship with this trend line intact).
2) Daily OB: Flip and hold as support (BTC first attempt was rejected, held as resistance and allow a more bullish double bottom to be formed).
3) 20W SMA / 21W EMA: Flip and hold these moving averages
4) Price Channel: Push back inside and hold with a least two weekly candle closes.
WHERE TO FROM HERE
We are now at this point where BTC is now poised to look at a new ATH. BULLs are looking for BTC to finish off this cycle, and the set up aligns perfectly with our 'Sell Zone' box time frame we have put in place to help us navigate this cycle. Our 'MA OSCILLATOR RISK METRIC' (see charts in below posts for updates) has swung back into our RL level of 7 and moving back towards out cycle peak risk levels.
To achieve a 'proper' finishing ATH bulls are looking for in this zone we would want to see BTC start to making aggressive moves from here in Q3 & Q4 of 2025.
The biggest concerns for BULLs and the upcoming case for bears is the weekly bearish divergences BTC has put in place with our prior ATHs this cycle. This is most notable in the RSI shown in this posts original chart. From here there are 3 likely scenarios BTC could take based on rejects of our RSI dark black tend line and in place weekly bearish divergences. These Scenarios are marked 1, 2 and 3.
Scenario 1
BTC moves aggressively out of this price channel to new ATHs. There is a chance Bears could push price into a lower high here or put in a 'SFP' (Swing Failure Pattern) and sweep our prior high.
Scenario 1a
This would play out scenario 1a which bulls would want to see a retest and hold of the 20W SMA / 21W EMA before heading back up to attack high levels. We would expect our RSI moving Advertage to provide support in this level (see point 1a in the RSI chart). Failure to hold would strongly support the suggestion of cycle 5s bear market beginning IMO.
Scenario 2
A HOLD and bounce off the 20W SMA / 21W EMA again would give bears another chance to put bearish divergence with the weekly RSI. Watch for a higher high in price (likely a SFP or sweep of our current ATH) and a lower high closed in our Weekly RSI. This would be a scary scenario for the bulls.
BULLISH SCENARIO | BREAKING THE RSI BEARISH DIVERGENCE DOWN TREND LINE
The most bullish move BTC Bulls could achieve in all the above scenarios is to breaking above the RSI Bearish Divergence Down Trend Line (shown as green up trend arrows in the RSI). This will invalidate current bearish divergences and sent bulls focus on the more speculative upper targets for this cycle.
Hope you have found this post series an interesting watch as I have.

AUDJPY BULLISH OR BEARISH DETAILED ANALYSISAUDJPY has successfully broken out of a long-term descending channel and is currently trading around 94.50. The breakout is clean and supported by solid bullish volume, which confirms that momentum is shifting in favor of the bulls. This setup indicates a clear trend reversal on the daily timeframe, and with the pair establishing higher lows and breaking resistance, the path toward 100.00 looks technically achievable in the coming weeks.
From a fundamental standpoint, the Australian dollar is gaining strength after the Reserve Bank of Australia (RBA) maintained a firm stance on inflation management. The latest CPI figures remain above the RBA’s comfort zone, and recent wage growth data has further reduced the probability of near-term rate cuts. Meanwhile, the Japanese yen continues to lag due to the Bank of Japan's ultra-loose monetary stance and consistent verbal intervention that lacks follow-through, keeping JPY broadly weaker across the board.
Technically, we’ve seen strong follow-through after the breakout, with price now holding firmly above prior resistance turned support. If this momentum sustains, we could see buyers step in aggressively, targeting 96.50 short-term and extending toward the key psychological level of 100.00 in the medium term. The risk-reward remains attractive with a clearly defined invalidation point below 91.00.
Overall, AUDJPY stands out as one of the most bullish JPY crosses on my radar. With a clean breakout, supportive fundamentals from the Australian side, and persistent weakness in the yen, this trade aligns with broader macro sentiment and could offer strong upside potential heading into the next quarter.

$BTC Post Death Cross PA Has NOT Confirmed 200DMA - Must Read!Throughout Bitcoin's history it has had 11 Death Crosses (50DMA crossing under 200DMA), and 10 of those times price has retested the 200DMA within ~3 months (with 1 outlier).
Do you know what time it did NOT retest the 200DMA? You might have guessed it… this most recent death cross ☠️
The only outlier that price did not retest the 200DMA within ~3 months was in 2015, where it took nearly a year to retest.
In that time, CRYPTOCAP:BTC ripped 200% just 75 days later, which marked the start of the PARABOLA.
This is why I have been so adamant with sticking to my base case for Bitcoin’s next move.
Is this time different? 🥸
Will it take nearly a year to retest the 200DMA?
An interesting observation I found was that if we take 90D from the most recent death cross, it brings us out to July 6th, which is right around when the 90-day pause of tariffs is lifted 🧐
Having said all that, if PA confidently breaks above and confirms previous ATH (~$110k), I will lean towards the 2015 outlier for the 200DMA retest, which would put us into late Q1 2026.
That would line up nicely with a suspected top of the cycle 🥲

Bitcoin Breaks Wedge! Correction Coming Before Next Leg? After Trump said in the press conference, " Better go out and buy stocks now ." The SPX500 index started pumping , and as I said in the ideas of the last few days, Bitcoin ( BINANCE:BTCUSDT )'s correlation with this index has increased. Bitcoin also started pumping.
Yesterday's Bitcoin pump succeeded in failing the Ascending Broadening Wedge Pattern , generally, if the reversal pattern fails, it will play a continuation role .
Bitcoin is moving between the Support zone($100,270-$97,700) and the Resistance zone($109,588-$105,865) . The question is whether Bitcoin will touch the Support zone($100,270-$97,700) again and move towards the Resistance zone($109,588-$105,865) or will it continue its upward trend.
In terms of Elliott Wave theory , it seems that Bitcoin has completed microwave 3 of the main wave 5 . We can expect an even Time Correction on Saturday and Sunday when trading volume is low . There is also a possibility that microwave 4 of the main wave 5 in Cumulative Long Liquidation Leverage($101,838-$101,432) will be completed.
One of the reasons I think we should wait for a correction is the USDT.D% ( CRYPTOCAP:USDT.D ) chart, which we used as a guide in previous ideas .
USDT.D% has reached Monthly Support(1) and a Heavy Support zone(4.73%-4.50%) , which I believe is unlikely to be broken within in first attack , and I expect an increase to the Fibonacci lines on the chart.
I expect Bitcoin to start rising again after a correction .
Cumulative Short Liquidation Leverage: $105,114-$104,100
Note: If Bitcoin touches $97,500, we should expect further declines.
Please respect each other's ideas and express them politely if you agree or disagree.
Bitcoin Analyze (BTCUSDT), 2-hour time frame.
Be sure to follow the updated ideas.
Do not forget to put a Stop loss for your positions (For every position you want to open).
Please follow your strategy and updates; this is just my Idea, and I will gladly see your ideas in this post.
Please do not forget the ✅' like'✅ button 🙏😊 & Share it with your friends; thanks, and Trade safe.

BTC in 17 April 2025Potential Major Move on Thursday, April 17, 2025 📍
📊 Based on an analysis of historical Bitcoin chart averages and similar patterns, there is a likelihood of a significant price movement on this date.
This analysis is conducted using technical analysis and a detailed examination of Bitcoin’s movement averages. It suggests that approximately every 150 days after the start of a neutral trend, we can expect a sharp upward or downward move that sets the stage for the main trend in the future.
📅 As of the current date, March 29, 2025, there are about 18 days left until this significant event.
You can follow the results of this analysis and the conducted review on TradingView on the specified date.

☄️ Bitcoin : If You're Believer 🅱️ I'd Be A Buyer ☀️Bitcoin 🌏
I'm Going To
Put It To
You Plain And
Simple
If You're Long Term Investor/Believer
I'd Be Buying At These Levels
🎱
BTC/USD
BTC/JPY🏯
BTC/AUD
BTC Total Market Cap
BINANCE:BTCUSD
CRYPTOCAP:BTC
INDEX:BTCUSD
👩🏼🚀👩🏼🚀🚀

SELL BTC - $99,400 BTC has arrived as forecasted into its next resistance zone. That should be abundantly clear from 150 colored lines I have on my super straight forward chart. ( sike ) I could go into great detail as to why I lean toward this is another local high, but why? I never do that. Just check out the results. We'll see how it goes. Comments and DM's always welcome Happy Trading. GO Murry, GO Gann, GO Elliot GO Kumar.


OTHERS - BTCOTHERS / BTC 🌊
2017 ALTSEASON 1
2021 ALTSEASON 2
2025 ALTSEASON 3
altcoins run will be there sooner or later


HolderStat┆BTCUSD stairway to 115K?CRYPTOCAP:BTC after breaking the resistance trend line is preparing to rise to $115,000, before which another consolidation in the triangle may be waiting for it.
#FLOKI gonna see 600 % profit.... at leastIf I'm gonna bet on one coin that can make 600 % profit it will be #FLOKI
best buying areas are
0.000078_0.000076
0.000033_0.000041
Targets are
0.00035
0.00055

This Low Cap Alt will 20-50x (CULT DAO)This crypto cycle has been brutal for alts. There have been massive shakeouts over and over, a relentless onslaught of rug pulls and scams, and the "Pump.fun" casino on Solana that’s drained billions of retail liquidity and transferred it to the few.
The few always seem to win, and the many always seem to lose. Today, if you’re reading this, it might all change.
CULT DAO could easily 20-50x from now until October 2025. Let’s take a look at the MACD divergence.
### Technical Divergence
For 750 days, this bullish divergence has been forming on the histogram MACD. Every new low on price has formed a higher low on the MACD.
Let’s take a look at a case study of what happens when we get this form of divergence.
I traded this exact same pattern in 2022 that resulted in a nearly 425% move. The play function doesn’t work because they rebranded, and that ticker is no longer valid, but you can scroll to the bottom in my comments on that TA and see the move. I’ll post it under this as well.
As you can see, we got that 425% move. Currently, CULT DAO is showing exactly the same histogram divergence.
Here are some examples of zigzag impulses on low-cap alts. You tend not to get 5 waves; instead, you get this zigzag pattern. This is what I predict CULT DAO will do since it’s only a 5 million market cap.
We can also see in the chart that the 0.618 time Fibonacci level hits at the end of October 2025, which is exactly where I think the altcoin market will top. Check out previous TA on that.
This is only scratching the surface of what is to come for CULT DAO. I have presented to you the technical reason why a big move is stirring and why, at the apex of these divergences, the stars align, and you have the catalyst present itself, and boom—the explosive move comes all at once, and it will be extremely volatile because of its low market cap.
### Let’s Start with the Tokenomics
Every time someone sells or buys CULT DAO on Uniswap, there is a 0.40% tax that goes to a treasury. The top 50 stakers get to pass proposals that fund projects/investments. The idea is to remove the centralized component of funding a project.
121 projects have been funded over the last three years with 3 million dollars.
- Total CULT Funded: 479,751,081,214 CULT
- Total ETH Funded: 1,573 ETH
- Proposals Funded: 121
- Total USD Funded: $3,289,596
- Total ETH Burned: 303 ETH
Allocating these funds has been a learning process over the last three years, but every failure has been necessary in preparing the DAO for what’s to come next.
### The Big Catalyst
The creator of CULT DAO has been working on a blockchain that will function on a custom gas token—that’s right, and that custom token will be CULT DAO. You heard correctly.
Every transaction, every deployment on the blockchain will require the CULT DAO token as gas to execute. The implications are massive. There are multiple dApps that are currently being constructed on the Modulus blockchain.
A privacy-first zkEVM blockchain like Modulus means a scalable, Ethereum-compatible blockchain that prioritizes user privacy through zero-knowledge proofs, allowing optional private transactions while maintaining decentralization.
Modulus is a privacy-first zkEVM blockchain and is scheduled to release this year between April and August 2025. I hope now you’re starting to see the picture.
### CULT DAO and ETH Liquidity Pools
So, why does the price of CULT go down if there is currently very little volume? Well, CULT DAO and ETH liquidity pools are tied together, so if the ETH price goes down, so does CULT. In turn, if ETH goes up, so does CULT.
You can see that CULT is nearly at a 1:1 ratio with ETH for now, coming in at a 0.91 ratio.
In other words, if my thesis is correct about ETH and it goes to 15,000 dollars, the price of CULT would be as follows:
- ETH at $10,000:
CULT Price: $0.000005008 (4x increase).
Market Cap: $21.38M (4x increase).
- ETH at $15,000:
CULT Price: $0.000007512 (6x increase).
Market Cap: $32.08M (6x increase).
That’s right—if nobody even bought CULT, not one dollar, the base liquidity increase of ETH would bring the market cap to possibly 32 million, in other words, if you were thinking of buying ETH, why don’t you just buy CULT DAO?
You can buy ETH now; from this price, 15,000 is 7x, or you can buy CULT DAO, get 6x plus whatever extra volume is coming in. It seems like a logical play, really.
Everything you’ve seen so far is why I believe this MACD histogram divergence has been forming for 750 days. As I said, the stars will align at the apex, and the explosion will come.
### Unruggable and No Whales Controlling Supply
As you can see from the bubble map, the largest wallet that is not an exchange has a cluster total of 0.7%. The rest of the clusters you see in the image are basically exchange wallets, which are the red and dark green circles mostly.
Liquidity is also locked for over 200 years.
- Burned Supply = 1.29664T
- Circulating Supply (including staked) = 4.27T
- Staked Supply = 1.07599T
- Remaining Tradable Supply (excluding burned and staked) = 4.27T - 1.29664T - 1.07599T ≈ 1.89737T
So, no whales, and it’s not possible to rug because liquidity is locked.
### Modulus Blockchain Liquidity Injection
The average liquidity injection for DAOs in ZK would be anything from 200,000 to 10 million. Let’s assume it’s a $1M injection that is split 50/50 between CULT and ETH, a common practice for Uniswap-style pools.
- CULT Amount in Pool: At the current price of $0.000001252, $500,000 buys ~399.36B CULT ($500,000 ÷ $0.000001252).
It would increase the price to a 10 million market cap overnight.
### Conclusion
- Liquidity is locked for 200 years
- No whales
- Not possible to rug
- Mainnet launching this year
- ETH pools tied to CULT
- MACD histogram divergence
The target I have for CULT is just based on Fibonacci levels. Honestly, it’s unpredictable what will happen, how high it will go, or the impact the Modulus chain will have. 120 million is my low-end estimate; the macro Fibonacci is much higher.
The last extension puts it at a 1.4 billion market cap and 266x from where we are now.
This is where you want to be for the upcoming alt season—right here, down 98% with this massive divergence and all these factors that come into play. Just the mainnet launch and ETH going to 10,000 basically sends this to a 30-50 million market cap.
Cult DAO and Satoshi Nakamoto share a common ethos of decentralization and anti-centralization. We need to embrace this notion and bring back the power to the many. If CULT DAO hits 1.4 billion dollars, the treasury funds would be in the millions; we fund our own future.
moduluszk.io
cultdao.io
cultdao.io
coinmarketcap.com

BITCOIN - Important Breakout (BoS)Hello Traders !
On Monday 5 May, The BTC reached the support level (92800 - 93500).
The price broke the higher high (Break of Structure).
So, I expect a new bullish move🚀
_______________
TARGET: 104000🎯

Later, Bitcoin!Bitcoin remains in a long-term bullish trend, but it currently appears significantly overvalued relative to gold. The recent breakout, followed by a re-test of the upsloping wedge formation, suggests that bullish momentum may be waning. This could indicate that capital is beginning to rotate out of Bitcoin. As a result, it may be more prudent to revisit the market in one to two years ahead. This shift may also mark the beginning of a potential altcoin season.

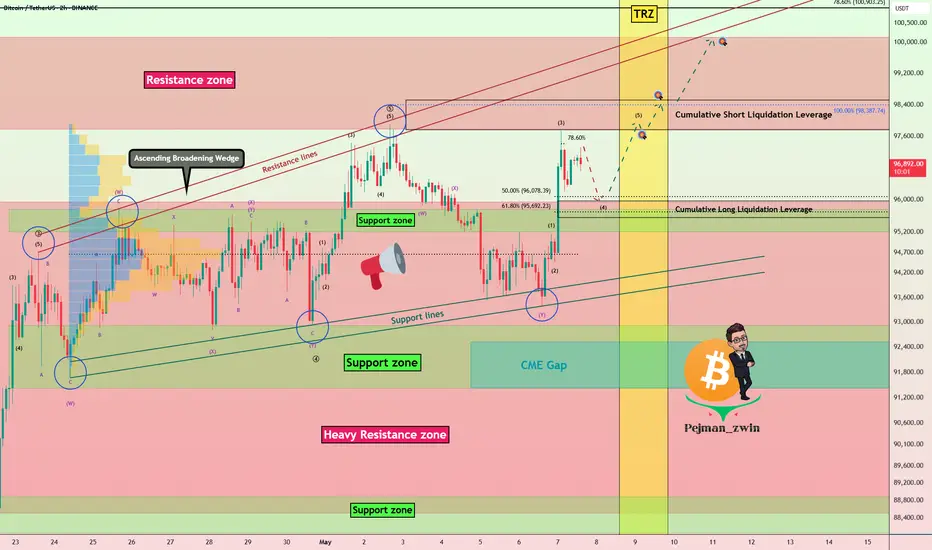
Bitcoin Hits PRZ — Reversal or Breakout?As I expected in my previous idea , Bitcoin ( BINANCE:BTCUSDT ) started to rise from the Support zone($95,760-$95,200) . One of the news that pumped Bitcoin was " Arizona Becomes Second U.S. State to Adopt Bitcoin for State Treasury "
Bitcoin is trading in the Resistance zone($100,200-$97,700) and near the upper lines of the Ascending Broadening Wedge Pattern , Time Reversal Zone(TRZ) and Potential Reversal Zone(PRZ) .
Also, we can see a Regular Divergence(RD-) between Consecutive Peaks.
From an Elliott wave theory , it seems we should wait for corrective waves because the Cumulative Short Liquidation Leverage($100,888-$99,826) is very important and I DO NOT expect it to be broken by a single attack .
Another point we can pay attention to is the existence of two small CME Gaps , the first CME Gap($98,430-$98,380) is likely to be filled.
I expect Bitcoin to drop to at least $98,100 in the coming hours, and if the Support zone($97,900-$97,240 ) is broken, we should expect further declines, so I will label this idea as ''Short' '.
Cumulative Long Liquidation Leverage: $98,500-$97,514
Note: If Bitcoin can break the Potential Reversal Zone(PRZ) with the good volume, we can expect a new All-Time High(ATH).
Do you think Bitcoin is on track for a new All-Time High(ATH)?
Please respect each other's ideas and express them politely if you agree or disagree.
Bitcoin Analyze (BTCUSDT), 2-hour time frame.
Be sure to follow the updated ideas.
Do not forget to put a Stop loss for your positions (For every position you want to open).
Please follow your strategy and updates; this is just my Idea, and I will gladly see your ideas in this post.
Please do not forget the ✅' like '✅ button 🙏😊 & Share it with your friends; thanks, and Trade safe.

BTC NEXT MOVE?🚀 Bitcoin (BTC) Market Update
We are expecting a small dip in Bitcoin's price, potentially down to the 89,000–90,000 USD zone. From that level, we anticipate a strong rally toward 101,000 USD, as highlighted in the chart.
📈 This move could also lead Bitcoin toward making a new all-time high!
Stay patient and follow the setup carefully.

btc . tue . recapApproaching the cmLow during 2/4pm (utc+2) on tuesday, brought the tiny SFP liquidity and and a NO LOOK BACK push upwards. The SHORT wasn't taken as the the bounce showed no weakness
The intraday LONG turned out to be a runner.
entry . 93454
tp1 . 94854 . +1.5%
- this seems a 'too early tp', correct but: thought as an intraday . securing the daily minimum: PROFIT TAKEN
tp2 . 100477 . +7.5%
tp3 . 103626 . +10.8%
The long entry is now at average 94863 . ish prv tp1
- I was waiting for lower, to add LONG position size
But upon not seeing follow through and strong bounces on lower TFs, I went with a 30% of original trade size addition during wednesday 8/10pm.
Now it's 10:30am, we've just pushed another 1h leg higher. I'll ride this to my next TPs, bigger reactions at this point I see only at higher prices.
This thing is BULLISH
(always hungry for good SHORT trades, but paytient for reactions)

Bitcoin Breaks Heavy Resistance Zone— But Can It Hold?Bitcoin ( BINANCE:BTCUSDT ) started to rise yesterday as the S&P 500 Index ( FOREXCOM:SPX500 ) opened and it seems like it can break the Heavy Resistance zone($95,950-$88,500 ) this time, but there are still concerns from a technical analysis , so please stay tuned for this analysis .
Bitcoin is moving near the Resistance zone($100,200-$97,700) and has broken through the Heavy Resistance zone($95,950-$88,500) with good momentum .
In terms of Elliott wave theory , it seems that Bitcoin has completed microwave 3 near the Resistance zone($100,200-$97,700) and we should wait for the completion of microwave 4 . The microwave 4 can be considered a pullback to the Heavy Resistance zone($95,950-$88,500 ).
I expect Bitcoin to drop to at least $96,000 and is likely to touch the Support zone($95,760-$95,200) and start rising again, since microwave 3 was with high momentum , it is possible that microwave 5 will even be truncated . The targets I have indicated on the chart can be the target of a long position .
If you are looking for a Bitcoin reversal, you can focus on the Time Reversal Zone(TRZ) . The next major pivot will likely be within this time zone .
It seems reasonable to open a Long position near the Support zone($95,760-$95,200) , and it can give us a good Risk-To-Reward . What do you think?
----------------------------------------------------
My concerns for Bitcoin's continued bullish trend:
Because Bitcoin's correlation with US stock market indices , especially the SPX500 , is higher than in previous weeks, my analysis is that there is a re-correction in the SPX500 index , which could prevent Bitcoin from continuing its upward trend .
The Ascending Broadening Wedge pattern is likely to complete, which could cause Bitcoin to fall further if the lower lines of this pattern are broken.
If tensions between Pakistan and India increase, it could prevent Bitcoin from growing further.
----------------------------------------------------
Also, Today, the Federal Funds Rate is scheduled to be announced.
Let’s take a look at how this decision — along with Powell’s speech — might impact Bitcoin . Be cautious with your positions during the announcement and Powell’s remarks, as markets may become volatile.
Holding the rate steady is a signal of monetary policy stability, which could give risk assets like Bitcoin some breathing room in the short term.
Given recent U.S. economic data, markets are mainly focused on Powell’s tone during the press conference. If he adopts a dovish stance (hinting at potential rate cuts), this could support Bitcoin’s upward momentum.
However, if Powell emphasizes that rates will remain elevated for an extended period, we might see a temporary wave of selling pressure in the market.
Stay alert and manage your risk wisely — high-impact events like this can lead to sharp moves in crypto.
----------------------------------------------------
Cumulative Short Liquidation Leverage: $98,511-$97,774
Cumulative Long Liquidation Leverage: $95,966-$95,550
Note: If Bitcoin falls below $94,400, we can expect further declines.
Please respect each other's ideas and express them politely if you agree or disagree.
Bitcoin Analyze (BTCUSDT), 2-hour time frame.
Be sure to follow the updated ideas.
Do not forget to put a Stop loss for your positions (For every position you want to open).
Please follow your strategy and updates; this is just my Idea, and I will gladly see your ideas in this post.
Please do not forget the ✅' like '✅ button 🙏😊 & Share it with your friends; thanks, and Trade safe.