BTC NEXT MOVE?🚀 Bitcoin (BTC) Market Update
We are expecting a small dip in Bitcoin's price, potentially down to the 89,000–90,000 USD zone. From that level, we anticipate a strong rally toward 101,000 USD, as highlighted in the chart.
📈 This move could also lead Bitcoin toward making a new all-time high!
Stay patient and follow the setup carefully.
Btc-bitcoin

btc . tue . recapApproaching the cmLow during 2/4pm (utc+2) on tuesday, brought the tiny SFP liquidity and and a NO LOOK BACK push upwards. The SHORT wasn't taken as the the bounce showed no weakness
The intraday LONG turned out to be a runner.
entry . 93454
tp1 . 94854 . +1.5%
- this seems a 'too early tp', correct but: thought as an intraday . securing the daily minimum: PROFIT TAKEN
tp2 . 100477 . +7.5%
tp3 . 103626 . +10.8%
The long entry is now at average 94863 . ish prv tp1
- I was waiting for lower, to add LONG position size
But upon not seeing follow through and strong bounces on lower TFs, I went with a 30% of original trade size addition during wednesday 8/10pm.
Now it's 10:30am, we've just pushed another 1h leg higher. I'll ride this to my next TPs, bigger reactions at this point I see only at higher prices.
This thing is BULLISH
(always hungry for good SHORT trades, but paytient for reactions)

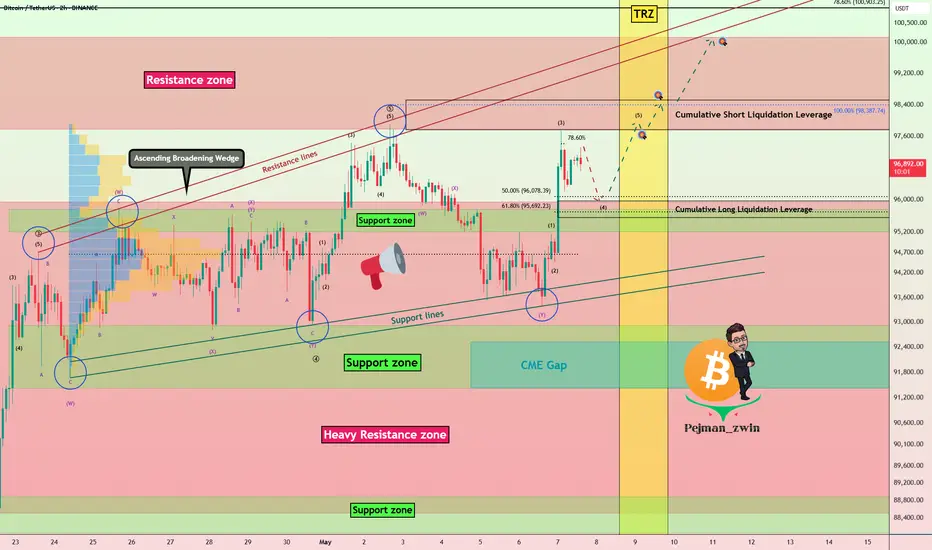
Bitcoin Breaks Heavy Resistance Zone— But Can It Hold?Bitcoin ( BINANCE:BTCUSDT ) started to rise yesterday as the S&P 500 Index ( FOREXCOM:SPX500 ) opened and it seems like it can break the Heavy Resistance zone($95,950-$88,500 ) this time, but there are still concerns from a technical analysis , so please stay tuned for this analysis .
Bitcoin is moving near the Resistance zone($100,200-$97,700) and has broken through the Heavy Resistance zone($95,950-$88,500) with good momentum .
In terms of Elliott wave theory , it seems that Bitcoin has completed microwave 3 near the Resistance zone($100,200-$97,700) and we should wait for the completion of microwave 4 . The microwave 4 can be considered a pullback to the Heavy Resistance zone($95,950-$88,500 ).
I expect Bitcoin to drop to at least $96,000 and is likely to touch the Support zone($95,760-$95,200) and start rising again, since microwave 3 was with high momentum , it is possible that microwave 5 will even be truncated . The targets I have indicated on the chart can be the target of a long position .
If you are looking for a Bitcoin reversal, you can focus on the Time Reversal Zone(TRZ) . The next major pivot will likely be within this time zone .
It seems reasonable to open a Long position near the Support zone($95,760-$95,200) , and it can give us a good Risk-To-Reward . What do you think?
----------------------------------------------------
My concerns for Bitcoin's continued bullish trend:
Because Bitcoin's correlation with US stock market indices , especially the SPX500 , is higher than in previous weeks, my analysis is that there is a re-correction in the SPX500 index , which could prevent Bitcoin from continuing its upward trend .
The Ascending Broadening Wedge pattern is likely to complete, which could cause Bitcoin to fall further if the lower lines of this pattern are broken.
If tensions between Pakistan and India increase, it could prevent Bitcoin from growing further.
----------------------------------------------------
Also, Today, the Federal Funds Rate is scheduled to be announced.
Let’s take a look at how this decision — along with Powell’s speech — might impact Bitcoin . Be cautious with your positions during the announcement and Powell’s remarks, as markets may become volatile.
Holding the rate steady is a signal of monetary policy stability, which could give risk assets like Bitcoin some breathing room in the short term.
Given recent U.S. economic data, markets are mainly focused on Powell’s tone during the press conference. If he adopts a dovish stance (hinting at potential rate cuts), this could support Bitcoin’s upward momentum.
However, if Powell emphasizes that rates will remain elevated for an extended period, we might see a temporary wave of selling pressure in the market.
Stay alert and manage your risk wisely — high-impact events like this can lead to sharp moves in crypto.
----------------------------------------------------
Cumulative Short Liquidation Leverage: $98,511-$97,774
Cumulative Long Liquidation Leverage: $95,966-$95,550
Note: If Bitcoin falls below $94,400, we can expect further declines.
Please respect each other's ideas and express them politely if you agree or disagree.
Bitcoin Analyze (BTCUSDT), 2-hour time frame.
Be sure to follow the updated ideas.
Do not forget to put a Stop loss for your positions (For every position you want to open).
Please follow your strategy and updates; this is just my Idea, and I will gladly see your ideas in this post.
Please do not forget the ✅' like '✅ button 🙏😊 & Share it with your friends; thanks, and Trade safe.
U scared, I'm eyeing $100k by May.What beautiful price action.
We are going higher.
disagree if you want.
But you should probably hedge that viewpoint, with a bullish bet.
BALLA JI!
WE WILL WIN.

Bitcoin (BTCUSD) – Bullish Continuation SetupBitcoin is showing strong bullish structure on the daily timeframe, having broken out of a key range and now approaching a potential retest zone.
Price is currently hovering around 96,990, and we’re anticipating a possible retracement into the demand zone between 91,856 – 88,533. This area aligns with a previous consolidation and breakout range, offering a high-probability buy zone if price reacts with bullish intent.
📌 Key Technical Highlights:
Break of structure confirms bullish bias
Demand zone identified between 91.8K – 88.5K
Anticipating a retracement for continuation
Bullish targets toward 100K+
We’ll be watching lower timeframes for confirmation (engulfing candles, bullish BOS, or SFPs) before entering long.

Bitcoin Analysis - 7 MayThe price continues to move within the range of $91,700 - $100,400.
In approximately 3 hours, the FED will announce its interest rate decision.
The expectation is for it to remain unchanged.
If it remains unchanged;
there could be a horizontal consolidation between 94,990 – 97,500.
If a breakout occurs, the upward movement will accelerate; otherwise, there could be a pullback to the 91,781 – 94,990 levels.
If the interest rate is reduced;
the psychological resistance at 100,400 USDT may be tested, and if surpassed, the target of 109,605 (ATH) comes into play.
If the interest rate is increased;
the supports at 94,990 USDT and below could be tested quickly.
The levels of 91,781 and 85,085 USDT become potential targets.
With stronger selling, the support zone at the 2024 ATH level of 73,776 USDT may come into play.

Bitcoin Still Stuck in Resistance – Eyes on CME Gaps & USDT.D%Bitcoin ( BINANCE:BTCUSDT ) touched $92,830(first target) and started to rise as I expected in the previous idea . Overall, Bitcoin has been moving in a range for about 12 days .
Note : In general, trading in a range market is more difficult than in a trending market . If your performance in a range market is not good, it is better not to trade until the trend is clear (this is just a suggestion).
Bitcoin is currently trading at a Heavy Resistance zone($95,950-$88,500) and has failed to break through it, and it seems like Bitcoin needs more momentum to break through this zone. Do you think Bitcoin will finally break through the Heavy Resistance zone($95,950-$88,500)?
In terms of Elliott Wave theory , it appears that Bitcoin has completed a five-wave impulsive and we should expect Corrective waves .
The analytical conditions of the Bitcoin chart have been a bit ambiguous in the past few days, so it's better to take a look at the USDT.D% ( CRYPTOCAP:USDT.D ) chart to increase the accuracy of Bitcoin analysis .
USDT.D% failed to break the Support zone(5.13%-4.95%) after several attacks. It currently appears to be forming an Ascending Broadening Wedge Pattern . It appears that USDT.D% needs to complete this pattern to break the support zone, and if this pattern fails , we should expect further increases =Bitcoin crash .
I expect Bitcoin to decline to the Support zone($92,910-$91,414) , 21_SMA(Weekly) and Cumulative Long Liquidation Leverage($93,359-$92,296) and probably fill the CME Gap($92,525-$91,415) this time and then start to rise and prepare to break the Heavy Resistance zone($95,950-$88,500) and fill the CME Gap($97,680-$96,455) .
Cumulative Short Liquidation Leverage: $98,989-$97,924
Note: If Bitcoin breaks below the Support zone($92,910-$91,414), we should expect further declines.
Please respect each other's ideas and express them politely if you agree or disagree.
Bitcoin Analyze (BTCUSDT), 1-hour time frame.
Be sure to follow the updated ideas.
Do not forget to put a Stop loss for your positions (For every position you want to open).
Please follow your strategy and updates; this is just my Idea, and I will gladly see your ideas in this post.
Please do not forget the ✅' like '✅ button 🙏😊 & Share it with your friends; thanks, and Trade safe.

BTC is suggesting a potential bearish reversalBitcoin (BTC) is currently exhibiting a head and shoulders pattern near the $96K– GETTEX:97K resistance zone, suggesting a potential bearish reversal. This pattern, characterized by three peaks—the middle being the highest—indicates that the upward trend may be weakening .
The Federal Open Market Committee (FOMC) meeting on May 7, 2025, is a pivotal event for BTC. While the consensus anticipates that the Fed will maintain current interest rates, the market is keenly awaiting Chair Jerome Powell's remarks for hints of future monetary policy directions. A dovish tone could bolster BTC prices, whereas a hawkish stance might exert downward pressure .
Technical analysis reveals that BTC has been trading within a range of $93,399.86 to $97,625.81 over the past 24 hours, with the current price around $96,362. The Relative Strength Index (RSI) stands at 58, suggesting that BTC is approaching overbought territory but hasn't crossed it yet .
A significant support level lies around $88,700, where substantial liquidity could trigger a price rebound if tested. However, if the head and shoulders pattern confirms a breakdown, BTC might retest lower support levels, potentially around $78,000 .
Actionable Insight: Traders should closely monitor the neckline of the head and shoulders pattern and the outcome of the FOMC meeting. A break below the neckline with increased volume could signal a bearish trend, while a dovish Fed stance might invalidate the pattern, leading to bullish momentum.
More Analysis and Trading Ideas on SorooshX

btc . may . w1 . waiting for lower pricesThe squeeze of shorts saw MayOpen pump through the resistance zones finally.
Friday 2pm, gave us the ladder entry to SHORT an SFP just before the weekend.
short . entry . 97368 . tp1 taken . ride the trend
Monday showed no volatility, no trades taken.
Too low to SHORT, too soon to LONG. I'd rather:
SHORT higher - add to position size.
cmVAL . pw0.5 . pwVwap
entry . 95347
tp1 . 90216 . +5.3%
tp2 . 88600 ish . +7%
LONG intraday
cwLow around 2pm and ride this for an intraday LONG into entry SHORT
entry . 93454
tp1 . 95347 . +2%

BITCOIN/GOLD BITCOIN/GOLD 🌊
Physical gold vs. Digital gold
2010: 1 BTC 0.0001 GOLD
2025: 1 BTC 27.9 GOLD

BTC - Golden Pocket test & what comes next?Bitcoin (BTC) has been steadily recovering from its January correction, entering a promising uptrend that has now brought it to a crucial technical juncture: the Golden Pocket Fibonacci zone, which lies between the 61.8% and 65% retracement levels. This area is widely watched by traders, as it often serves as a springboard for either significant reversals or continuation of the trend.
4H timeframe
On the 4H timeframe, BTC recently formed an ascending triangle, a classic bullish continuation pattern. The price managed to break above the triangle’s resistance, but it failed to hold above this level, closing back below the breakout zone. This lack of follow-through signals weakness and suggests that a short-term pullback could be imminent.
Daily timeframe
Turning to the daily chart, the situation becomes even clearer. After reaching the Golden Pocket, BTC printed a bearish engulfing candlestick, a strong reversal signal. The subsequent price action saw BTC break below both the 4H support and a daily FVG, further strengthening the case for a deeper correction or trend reversal. If this downward momentum continues, the next major support zone is likely between $89,000 and $91,000. This area marks an imbalance created during the previous rally and is a natural target for buyers to step in.
However, the bullish scenario is not entirely off the table. If BTC can reclaim and hold above the Golden Pocket, it would signal a resumption of the uptrend, with the next key target being the psychologically significant $100,000 level. For now, though, the technical structure suggests that a retracement toward the $89–91k zone is more likely before any attempt at new highs.
Conclusion
In summary, Bitcoin’s recent test of the Golden Pocket Fibonacci zone has resulted in a short-term rejection. The immediate outlook is cautious, with a likely retracement toward $89–91k. Traders should watch closely for confirmation signals in both price action and volume before making new commitments. A successful hold above the Golden Pocket would open the door for a rally toward $100,000, but for now, patience and careful observation are advised.
Thanks for your support.
- Make sure to follow me so you don't miss out on the next analysis!
- Drop a like and leave a comment!


Bitcoin - Bitcoin on the Road to $100,000?!Bitcoin is in its descending channel on the four-hour timeframe, between EMA50 and EMA200. If Bitcoin moves downward towards the specified demand zone, we can look for its next buying opportunities.
It should be noted that there is a possibility of heavy fluctuations and shadows due to the movement of whales in the market and compliance with capital management in the cryptocurrency market will be more important. If the downward trend continues, we can buy in the demand range.
In April, Bitcoin recorded a growth of 14.7%, successfully rebounding from a sharp early-month decline that had dragged its price down to $74,901. This level marks Bitcoin’s lowest price point in 2025 so far.
U.S. President Donald Trump, in an interview with NBC News, responded to growing concerns about a possible economic recession by saying that everything would be “fine.” He referred to the current phase as a “transitional period” and expressed confidence that the U.S. economy would perform “extraordinarily well.” When asked directly if he feared a recession, Trump replied, “No,” though he added, “Anything is possible, but I believe we are headed toward having the greatest economy in our nation’s history.”
On the other hand, Ethereum ended April with a 1.58% decline—marking its fifth consecutive month of losses. Over the past year, Ethereum has only seen gains in three months, and it is currently down 36.7% compared to the same period last year.
Strategy, formerly known as MicroStrategy, announced its intention to invest up to $84 billion in Bitcoin. The funds will be raised evenly through stock issuance ($42 billion) and debt securities ($42 billion).
In the first quarter of 2025, Strategy reported a profit of $5.8 billion from its Bitcoin investments, achieving a return of 13.7%. The company has also raised its annual targets, increasing its projected Bitcoin return from 15% to 25% and its dollar profit goal from $10 billion to $15 billion.Meanwhile, the short-term holder profit/loss ratio for Bitcoin has returned to a neutral level of 1.0, indicating balance between coins held at a profit and those at a loss. Historically, this level has often served as resistance during bearish phases. If prices remain above this point, it could signal strengthening momentum and a potential market recovery.
Elsewhere, reports indicate that Apple has violated a previous antitrust ruling by continuing to restrict users from accessing alternative payment methods outside of the App Store. The decision, issued by Judge Yvonne Gonzalez Rogers, now requires Apple to allow apps—including those related to crypto and NFTs—to operate without paying fees or seeking special approval. This ruling immediately strips Apple of its ability to collect commissions on out-of-app purchases and prohibits the company from monitoring or tracking such transactions.

btc . april recap . may outlookMAY instantly starts with a SHORT SQUEEZE
- out of pwRange
- into cwRange + 1 step higher
- all good, all bullish - but a price drop on HTF would open great opportunities for SHORT + LONG, while keeping bullish momentum
02.04.2025 . SHORT IDEA
- after trading out of range, start trading the/within new range
- approaching cmHigh towards 2pm Berlin time
- ladder in for possible SFP
- give yourself a little wiggle room for the SL, if price breaks +2% and approaches the next SFP level, a short entry higher towards friday close has a better R:R
entry. 97368
tp1 . 950908
tp2 . 94095
tp3 . 85113
LONG IDEA
- wait and see where the price find its support
- possibility that we keep STRONG BULL momentum, if price stays within cwVA
- on the way there, find percentage levels for daily +1.5% trades

BTC Roadmap — May 2025🚨 BTC Roadmap — May 2025
Here’s the timeline you’ll want to pin and come back to.
⸻
🔴 May 4–6
Low volume. No major moves expected.
BTC goes DOWN and BTC dominance starts trending down, but it’s not the moment to jump in yet. Patience.
🟢 May 7–9: ALT PUMPS
BTC Volume increases!
BTC UP
This is the first major altcoin opportunity.
🔴 May 10–13: SELL SIGNAL
This is your exit window.
1D SELL confirmed. Prepare for cooling.
BTC Volume drops.
⚪️ May 15–17: May USDT.D will go UP!
USDT dominance reaches a local bottom - BTC HUGE DUMP .
BTC Volume rises again → BIG MOVE up after 17th.
🟢 May 17–20: BTC and ALT PUMPS
Perfect LONG entry zone.
🔴 May 21–23: USDT HIGH — market will go UP faster!
USDT.D peaks. BTC and altcoins prepare for breakout.
BTC Volume high.
💸 Dollar weakens → Risky assets explode (BTC, alts, growth)
⸻
NOT FINANCIAL ADVICE

"Bitcoin Analysis" (Update)Here's what I can gather from the chart right now:
The Minor Resistance zone has been strongly broken to the upside; we haven't seen good pullbacks to this level yet.
On the other hand, below the broken zone, there's a price gap toward the FVG, as indicated by the arrow.
Also, the pullback to the breakout level at 0.382 has not been completed, and no patterns have formed in that area!
So? When we analyze all the breakout factors, we see a very high chance of a correction.
Now, this correction could start from the confirmation level at 96,364, or with an overextension, it could happen from the 98k zone.
Stay Awesome , CobraVanguard

BTC breaks out - Can it sustain the bullish momentum?Over the past week, Bitcoin (BTC) has shown notable strength, forming an ascending triangle pattern, a typically bullish structure that often resolves to the upside. True to form, BTC has now broken out above the triangle's resistance, pushing higher with strong momentum.
-------------------------------
Price target ascending triangle
This breakout sets a technical price target above $98,000, suggesting there’s still significant upside potential if the pattern plays out fully. However, the rally is now approaching a critical test.
-------------------------------
Golden Pocket + POC
BTC is currently moving into a zone of strong resistance, both the Golden Pocket Fibonacci retracement level and the Point of Control (POC) from recent months converge in this area. These technical levels often act as magnets for price and can serve as significant barriers, potentially leading to a pullback or consolidation.
-------------------------------
Stochastic RSI
Adding to the caution, the daily Stochastic RSI remains in overbought territory, where it has lingered for an extended period. While this doesn’t guarantee an immediate reversal, it does suggest that a corrective move could be on the horizon.
-------------------------------
Conclusion
Still, there's a chance BTC could first push toward the psychologically significant $100K level before any major retracement occurs. Traders should keep a close eye on how BTC behaves around this key resistance area, confirmation or rejection here will likely shape the next major move.
-------------------------------
Thanks for your support.
- Make sure to follow me so you don't miss out on the next analysis!
- Drop a like and leave a comment!

BTC Outlook May 2025CRYPTO:BTCUSD
Bitcoin Nears Major Resistance – What Comes Next?
As of this writing, Bitcoin is trading around $96,000, climbing steadily as it approaches what I believe is a critical resistance zone between $98,000 and $102,000. This area has the potential to act as a major turning point.
If Bitcoin can break through and hold above the $102,000 level, I believe there's a strong chance we see continued momentum pushing the price toward $120,000 or even higher. However, if Bitcoin is rejected at this resistance zone, it could mark the beginning of a retracement, with the next major support area appearing around the $71,000 level.
This zone of resistance is, in my view, one of the most important to watch in the current cycle. Whether Bitcoin can establish new support above it—or get turned away—could shape the trajectory for the rest of the year.
Previous Bitcoin Outlook
Disclaimer: The views expressed in this article are my personal opinions and should not be considered financial or investment advice. Trading cryptocurrencies involves significant risk, and you should always do your own research and consult with a financial advisor before making investment decisions.

BUY BTCUSD ScalpI am buying BTCUSD 96000, lets try this for a short scalp. This is my personal bias, practice at your own. No any financial advise just for learning purpose.

NZDJPY BULLISH OR BEARISH DETAILED ANALYSIS ??NZDJPY has successfully completed a bullish breakout from the descending channel structure that has been forming since mid-2024. The price action respected the trend boundaries flawlessly, and the breakout above the upper trendline confirms a reversal from the previous downtrend. Now trading around 86.200, this pair is showing strong momentum, supported by both technical breakout validation and fresh bullish sentiment in the market.
The pair is now targeting a measured move towards 93.000 in the coming weeks. The breakout is supported by increasing risk appetite across markets, as investors shift from safe-haven currencies like the Japanese Yen toward riskier assets such as the New Zealand Dollar. The sharp rejection from the lower trendline and the steady climb through April and early May marks the beginning of a potential bullish cycle. Traders should watch for retests and bullish continuation patterns to ride this wave.
Fundamentally, the New Zealand economy is seeing upward momentum with recent improvements in dairy exports and a surprise drop in unemployment to 3.8%, beating expectations. On the other hand, Japan’s stagnant inflation data and dovish Bank of Japan stance have weakened the Yen further. The widening interest rate differential between the Reserve Bank of New Zealand and the Bank of Japan continues to favor the Kiwi. This macro backdrop aligns with the technical breakout, offering additional conviction to bullish traders.
With technicals and fundamentals now in alignment, NZDJPY offers a high-probability long setup. Breakout traders and trend followers should consider riding this move toward the 93.000 target, with trailing stops to lock in profits as momentum continues. Keep an eye on global risk sentiment, commodity prices, and upcoming economic data from New Zealand for confirmation along the way.

Bitcoin Range-Bound in Heavy Resistance – CME Gap Still Open!Bitcoin ( BINANCE:BTCUSDT ), like Gold , has been moving in a Range for the past 5-6 days and is currently in a Heavy Resistance zone($95,950-$88,500) , as it has been in the past few days .
In terms of Elliott Wave theory , Bitcoin appears to be completing a main wave 4 . The main wave 4 structure can take two forms: Double Three Correction(WXY)_Expanding Flat(3-3-5) .
I label this analysis " Short " for the following reasons:
Due to Bitcoin's higher correlation with the S&P 500 Index ( SP:SPX ) these days, I am short on the S&P 500 Index.
China’s president Xi Jinping says Trump lied about them having a phone call ; it is NOT good news for the S&P 500 Index and Bitcoin .
CME Gap($92,525-$91,415) has NOT filled yet, and I think Bitcoin will NOT start the next bullish rally before filling the CME Gap.
I expect Bitcoin to drop to at least $92,830 and then decline to the Support zone($92,000-$91,400) if the Support lines are broken.
Cumulative Short Liquidation Leverage: $96,741-$95,520
Note: If Bitcoin can touch $97,000, we should expect more pumping.
Note: If Bitcoin goes below the 100_SMA(Daily), we should expect a fall.
Please respect each other's ideas and express them politely if you agree or disagree.
Bitcoin Analyze (BTCUSDT), 1-hour time frame.
Be sure to follow the updated ideas.
Do not forget to put a Stop loss for your positions (For every position you want to open).
Please follow your strategy and updates; this is just my Idea, and I will gladly see your ideas in this post.
Please do not forget the ✅' like '✅ button 🙏😊 & Share it with your friends; thanks, and Trade safe.

Top of ABC correction on Bitcoin ~ ShortBitcoin has had quite the run up since 2023 and is currently in an ABC corrective pattern after a 5 wave impulse. The January high was the starting point. The April low was A. Now is the top of B which happens to be 0.618 retracement of the A wave. What follows is a down move for C which should end somewhere between 63k and 53.5k. This will make a bottom and will stay in accumulation until late 2027 early 2028 before shooting to the upside in anticipation of the next halving.

Sell in May and go away, but when? 🧭 Current Situation:
📈 Market remains bullish, but I anticipate possibility for S&P500 to drop on US open. If that happens, BTC can also make a dip, but since it looks much stronger than stocks, that drop might not be a big one. Nevertheless area around 95k looks very attractive.
⚠️ Price will need to show stronger bearish pressure to trigger any real panic or sell-off. Until then, this looks more like healthy volatility within trend continuation.
🧱 The breakout level at 95770 was already re-tested, so it’s now off my watchlist. The next meaningful support is around 95K flat.
---
🔥 CME Gap Update:
4H CME gap has expanded — now stretching from 95280 to 96560
This zone will act as a magnet in the coming sessions until it gets filled.
Just a quick reminder — 4H CME gaps are not as strong or reliable as Daily gaps. They don’t carry the same close rate or magnetism.
However, they can still offer directional hints and serve as target zones, especially in short- to mid-term setups. Use them as guidance — but don’t treat them like guaranteed gravity wells.
🎯 Key Levels to Watch
• Bullish Targets: 97666 / 98500 / 99431
• Bearish Targets: 94971 / 94125 / 93550
---
🔥 BTC Liquidation Heatmap
Above: 97530 / 98191 / 98998 / 100100
Below: 96063 / 95623 / 94670 / 93715
