Probably nothing btcBitcoin has not yet recorded a real increase in percentage growth compared to previous cycles, so 2025 seems to be accompanied by surprising movements
Btc-bitcoin

$BTC Huge Daily Close Above the .618 Fib !Very BIG Daily Close for ₿itcoin above the .618 Fib 🥵
CRYPTOCAP:BTC needs to close the next week in or above the green box demand area in order to keep the rally alive and flip resistance into support.
As I originally mentioned in my idea, PA either needs to correct accordingly or this is the long-awaited PARABOLA in the making.
I still stand with my original belief on how this will play out, and have numbered my ideas accordingly.
1. Correct to 200DMA
2. Correct to 50DMA
3. Inverse Head and Shoulders reversal pattern
4. PARABOLA 🚀
I hope it's time to MOON more than anyone!
but I still have a good chunk of cash on the sideline in case the market needs more time 🤓

BTCUSDT forming a Bullish Flag patternBitcoin (BTCUSDT) is currently forming a classic bullish flag pattern on the daily chart, often regarded as a strong continuation setup in technical analysis. The breakout from the prior descending wedge has already provided strong bullish momentum, and now BTC is consolidating just below key resistance, signaling the next possible leg upward. With volume steadily increasing during this consolidation phase, this flag pattern holds significant potential for a breakout rally.
The price structure reflects healthy accumulation, where smart money seems to be stepping in before the anticipated surge. The flagpole leading up to the pattern shows strong bullish dominance, and the sideways flag structure suggests that Bitcoin is merely taking a breather before pushing higher. A confirmed breakout from the flag could target an upside of 20% to 30%+, aligning with the projected price move shown on the chart.
Fundamentally, Bitcoin continues to gain mainstream traction, and the broader crypto sentiment is turning positive again. The volume patterns and technical indicators reinforce the bullish outlook. Investors are showing renewed interest, especially as BTC holds above key psychological and structural levels, which adds confidence to the continuation narrative.
This setup is ideal for breakout traders and investors looking to capitalize on short to mid-term gains. If the bullish flag plays out as expected, BTC could make another significant move toward its all-time high zone.
✅ Show your support by hitting the like button and
✅ Leaving a comment below! (What is You opinion about this Coin)
Your feedback and engagement keep me inspired to share more insightful market analysis with you!

Bitcoin 1-Hour Chart: Quick Market BreakdownIn this concise market review, we'll analyze the latest movements on Bitcoin's 1-hour chart.

btc. SHORT to LONGwe saw a nice price rotation downwards, following the idea of NY giving up the SFP on tuesday and started looking for lower prices themselves.
SHORT entry running ASIA high at 2pm
entry . 95146
tp1 . 93453 . +1.78%
the 1h SUPPORT LEVEL of ASIA . 92902
held SUPPORT during that down price rotation.
LONG IDEA
see a rotation to dOpen / cw0.5 / value area Low / micro SFP / 2pm
entry . 94000
tp1 . 96.972
at 1 step extension of cw

EYES ON THESE TWO HYSTORICAL TRENDLINESWe are at a crucial point, the price is touching a cross between two trend lines that have lasted for YEARS.
Decisive moment for BTC.
If it breaks to the upside we will fly.
For the moment I value a short position with SL just above the trend lines.
Good Luck

ONDO Trade Setup – Range Support + Fibonacci ConfluenceONDO has retraced to a key confluence zone, aligning with both lower range support and the 38.2% Fibonacci retracement level. This presents a solid opportunity for a long spot entry, especially if bullish confirmation follows.
🔹 Entry Zone:
Around $0.90
🎯 Take Profit Targets:
🥇 $1.15 – $1.25
🥈 $1.40 – $1.55
🛑 Stop Loss:
Just below $0.85

btc . month . outlookLONG worked out nicely, BUT there was no SFP liguidity grab at cw/cmHigh
- finished LONG trade with 10pm (+2h tz)
- price dropped below entry . out of LONG . looking for lower new entry
As we're just before a new monthly open, possibility for retrace during Month May enhances
- This would give a nice new SWING LONG entry
- As well as a nice SHORT entry to ride the rotation downwards
Tuesday gave up a couple of SUPPORT levels . got me to shift SHORT for wednesday
- scaling SHORT at fib + cw0.75
Invalidation:
Running stops at 92.750 and recovering above cw0.5

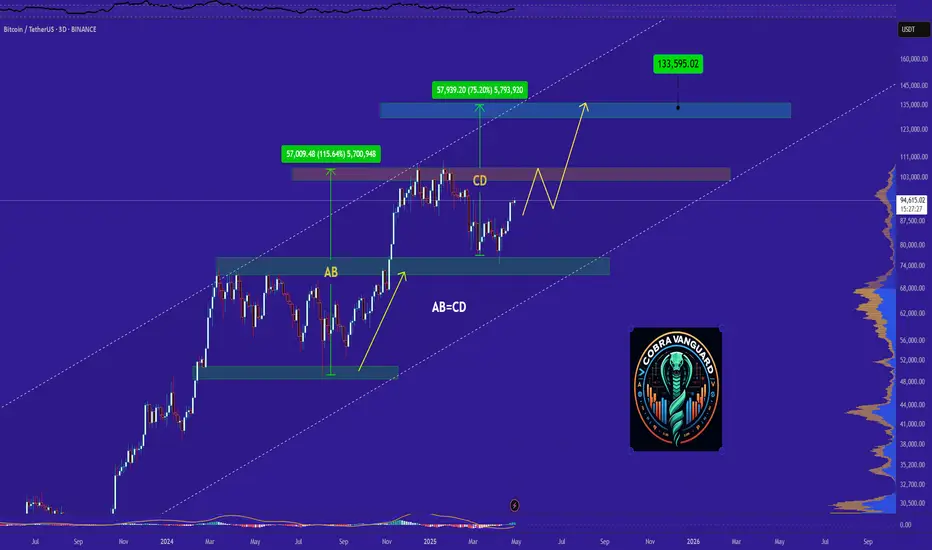
Do you think I'm joking ???I might be wrong and this might never happen, but it might come true From a technical perspective!!!
Give me some energy !!
✨We spend hours finding potential opportunities and writing useful ideas, we would be happy if you support us.
Best regards CobraVanguard.💚
_ _ _ _ __ _ _ _ _ _ _ _ _ _ _ _ _ _ _ _ _ _ _ _ _ _ _ _ _ _ _ _
✅Thank you, and for more ideas, hit ❤️Like❤️ and 🌟Follow🌟!
⚠️Things can change...
The markets are always changing and even with all these signals, the market changes tend to be strong and fast!!
BTC/USDT 1H Chart Analysis: Breakout Incoming?Hey traders! Let’s dive into this juicy BTCUSDT 1-hour chart. Bitcoin is teasing us with some serious action!
We’ve got a textbook symmetrical triangle pattern forming, with price consolidating tightly between converging trendlines. This is a classic setup for a big move — Bitcoin is coiling up like a spring, ready to explode!
The chart shows multiple phases of consolidation , with the latest triangle pushing BTC toward a critical decision point near the weekly high of $95,773.15 and the monthly high of $95,119.06.
The price is currently hovering around $95,000, testing resistance. A breakout above the upper trendline could send BTC soaring past $96,600, potentially targeting $97,200 or higher!
On the flip side, a rejection here might see it dip toward the daily low of $92,839.27 or even the lower trendline for support.
Key Levels to Watch:
Resistance: $95,773.15 (weekly high)
Support: $92,839.27 (daily low)
Breakout Target: $97,200+
Breakdown Target: $92,800
✉ What do you think — bullish breakout or bearish?
Drop your thoughts below!

BITCOIN Why is this rally surprising you?Bitcoin (BTCUSD) has completed 3 straight green weeks, with an impressive last 1W candle closing and started the new one right where it left. This rise shouldn't be surprising to most as it has fulfilled all the conditions that initiated all major rallies since the November 2022 Bear market bottom.
The first week of April rebounded strongly on the 1W MA50 (blue trend-line), which as mentioned numerous times on our channel, has been this Bull Cycle's main Support and kickstarted the Q4 2023 and Q4 2024 rallies.
At the same time, the 1W RSI broke last week above its MA, which has been the final confirmation of those Bullish Legs. With the 1W Bollinger Bands (BB) still ranged, the top trend-line is expected to rise aggressively as BTC's uptrend accelerates, something that resembles October 2023 and October 2024.
Throughout this Bull Cycle, those rallies have lasted around the same time, the longest being 14 weeks. As a result, the latest the current Bullish Leg tops should be on the week of July 14 2025 and a +92% rise as February - March 2024 should deliver a test of the Higher Highs trend-line around $140000.
Do you think that's the most probable scenario? Feel free to let us know in the comments section below!
-------------------------------------------------------------------------------
** Please LIKE 👍, FOLLOW ✅, SHARE 🙌 and COMMENT ✍ if you enjoy this idea! Also share your ideas and charts in the comments section below! This is best way to keep it relevant, support us, keep the content here free and allow the idea to reach as many people as possible. **
-------------------------------------------------------------------------------
💸💸💸💸💸💸
👇 👇 👇 👇 👇 👇

GBPJPY DETAILED TECHNICAL AND FUNDAMENTALSGBPJPY is currently trading around the 191.00 zone, and price action is forming a classic bullish flag pattern on the 4H chart. This follows a strong impulse leg, suggesting a potential continuation to the upside. The consolidation is tight and healthy, showing market participants are preparing for a breakout. My upside target stands at 193.000, which aligns with the descending trendline resistance.
From a fundamental perspective, the British Pound remains supported by recent hawkish signals from the Bank of England, which is facing persistent inflation pressures. Meanwhile, the Japanese Yen continues to weaken across the board due to the Bank of Japan’s ultra-loose monetary stance and its defense of yield curve control, which makes it less attractive in a high-interest environment.
Technically, this setup aligns with key momentum indicators and market structure. If price breaks above the flag pattern with volume confirmation, we can expect buyers to take control, pushing price toward the 193.000 resistance zone. This level also coincides with a key liquidity area where prior sellers may be trapped.
Overall, GBPJPY continues to offer a solid bullish bias in the short term. The pair is fundamentally and technically aligned for a push higher. Breakout traders should monitor closely as the price approaches the upper trendline of the flag. This is one of the most watched JPY pairs right now—momentum is building.


btc . tue . recap plan to LONG came to fruition
LONG note:
as i found wOpen heavily BULLISH - i was eager to get in early and equaly positioned:
cw0.5 . 94.200
to
cw0 . 92781
entry: 93.975
this left me with not the nicest entry . not all orders were filled . should have favoured increasing order size . one never really knows until it happens . but happy
DAY TRADE note:
a day trade of nysOpen SFP . 95.400 (to ride down for our LONG IDEA)
LONG SUPPORT will show during the day . NICE! . but not taken . it supported our search for LONG though
recap
wOpen . ASIA . LONG
nysOpen . SFP to 5.30pm . LONG
tueOpen . ASIA take profit . rotation to cw0.5 . (LONG in favour)
nysOpen . idealy tp1 : SFP . possibly rotation . (look out for SHORT and LONG)

ETHBTC x ETH.DETHBTC x ETH.D
Ethereum bitcoin pair and ethereum dominance will gain upward momentum with the reaction it receives from the major support line in 2019
The better Ethereum is, the better Altcoins will be.

Bitcoin still defying gravity. Can it hold and continueBTC is flagging out at the previously defined point of interest. Although there are signs of bullish divergence market structure has yet to provide enough evidence that a retracement is in effect. However, the chart shows a volume gap below that presents an opportunity.
Full TA: Link in the BIO

$BTC Rejected at .618 Fib - Correction Coming!Textbook rejection at the .618 Fib for CRYPTOCAP:BTC
Now on its way to retest the 200 and 50DMA as expected.
If that does not hold, we’ll go back to my original inverse head & shoulder idea ~$78k.
This will be the catalyst for Bitcoin’s next leg up to $130k end of June.

$BTC back to $59-62kAs you can see from the chart, BTC is rejecting from the range highs which sets up the next (and final) leg lower before we continue the bull run.
Despite the bounce over the last few weeks, all we've done is retested the area which we broke down from back in February.
Now this sets up a large move lower down to the lower support levels at GETTEX:59K -$62k.
After we tag those levels, we'll continue our next move higher into 2026-2027.

Will BTC Correct Before Breaking $96K? CME Gap Still Open!Bitcoin ( BINANCE:BTCUSDT ) moved as it did in the previous post , I hope it was useful for everyone.
Bitcoin is still moving in the upper areas of the Heavy Resistance zone ($95,000-$88,500) , this type of movement does NOT seem to be enough to break Heavy Resistance zone ($95,000-$88,500) , so I still expect a correction .
The volume of Bitcoin's price rebound to the previous high does NOT seem to be sufficient, and even Regular Divergence(RD-) is evident.
According to Elliott Wave theory , it seems that Bitcoin has completed its 5 impulse waves and we should expect another decline . Of course, there is still a possibility that the main wave 4 will be an Expanding Flat(ABC/3-3-5) . But both scenarios can bring us a decline in Bitcoin price .
I expect Bitcoin will NOT be able to break the Heavy Resistance zone ($95,000-$88,500) before the CME Gap($92,525-$91,415) is filled, This is just my analysis of course, considering the above explanation. What do you think?
Cumulative Short Liquidation Leverage: $96,000-$95,095
Cumulative Long Liquidation Leverage: $93,350-$92,551
Cumulative Long Liquidation Leverage: $90,276-$89,160
Note: If Bitcoin goes over $96,100, we can expect more pumps.
Please respect each other's ideas and express them politely if you agree or disagree.
Bitcoin Analyze (BTCUSDT), 1-hour time frame.
Be sure to follow the updated ideas.
Do not forget to put a Stop loss for your positions (For every position you want to open).
Please follow your strategy and updates; this is just my Idea, and I will gladly see your ideas in this post.
Please do not forget the ✅' like'✅ button 🙏😊 & Share it with your friends; thanks, and Trade safe.

We are at the decision line. As you can see, the situation is quite clear. If it supports this decision line, new Ath is on its way. But if it cannot support, a bloodbath is on its way.
* The purpose of my graphic drawings is purely educational.
* What i write here is not an investment advice. Please do your own research before investing in any asset.
* Never take my personal opinions as investment advice, you may lose your money.

BTC Potential Breakout, Daily DivergenceBTC on the daily has the opportunity to expand way upwards over the next month - a divergence on the daily evidently takes longer to play out but RSI could easily reach 80 off the back of the structure.
I have been shorting, confidently, for a good few weeks now, with longs in between, but I'm starting to feel like I should flip long.
Solana is also trying to reclaim the daily/weekly range - things to think about for sure.
Good luck out there!

Bitcoin: Will Bitcoin reach $100,000?!Bitcoin is above the EMA50 and EMA200 on the four-hour timeframe and is in its ascending channel. The continuation of Bitcoin's upward movement towards the supply zone will provide us with its next selling position with an appropriate reward to risk. In case of Bitcoin's downward movement towards the specified demand zone, we can look for its next buying positions.
It should be noted that there is a possibility of heavy fluctuations and shadows due to the movement of whales in the market and compliance with capital management in the cryptocurrency market will be more important. If the downward trend continues, we can buy in the demand range.
During the recent trading week, from April 21 to April 25, U.S. spot Bitcoin ETFs recorded over $3 billion in capital inflows. This figure marks the second-largest weekly inflow in the history of these ETFs, following the $3.4 billion inflow recorded in November 2024.
Thanks to this momentum, Bitcoin managed to climb above the $95,000 mark for the first time since February. Data reveals a notable increase in market participants’ optimism, with bullish posts on social media reaching their highest level since the night of Trump’s election victory on November 5, 2024.
More than 7,000 Bitcoins, worth over $500 million, were withdrawn from the Coinbase exchange. This trend could signal institutional accumulation and reflect a strongly bullish sentiment in the market.
During the 2018 trade tariff war, Bitcoin experienced a sharp 84.5% collapse, plunging from around $19,400 in December 2017 to approximately $3,000 by December 2018. This price decline coincided with intensifying global trade tensions.
However, Bitcoin’s price later rebounded following the Federal Reserve’s interest rate cuts and an improvement in liquidity conditions. The attached price chart clearly illustrates Bitcoin’s steep decline between December 2017 and December 2018.
According to data released in March 2025, major global corporations have significantly strengthened their presence in the digital asset market. At the top of the list stands MicroStrategy, holding over 500,000 BTC — far surpassing other companies.
Following MicroStrategy, companies such as Marathon, Galaxy Digital, Tesla, Coinbase Global, Hut 8 Mining, Riot Platforms, Block, CleanSpark, and Metaplanet respectively hold the largest Bitcoin reserves. This group of key players from technology, mining, and financial services sectors view Bitcoin as a critical part of their long-term strategies.Moreover, between April 7 and April 13, MicroStrategy purchased 3,459 Bitcoins at an average price of $82,618 per coin, totaling $285.8 million.

28/04/25 Weekly OutlookLast weeks high: $95,778.66
Last weeks low: $84,688.21
Midpoint: $90,233.44
Last week Bitcoin ETFs recorded their second highest net inflows ever, $3.06B between April 21st-25th. The result of this buyside volume is evident on the chart as BTC breaks up into the mid $90k's, and in doing so is now back at the level in which BTC fell from originally to hit $74,500. As a result it is fair to say this area will be a big resistance level, but where is new support after this rally?
The aggressive nature of last weeks move up has left a number of areas of imbalance that the market does tend to revisit. Just below midpoint we have the $89,000-$90,000 area just below a key S/R level at $91,000. Dipping below this area into the FWB:88K 's briefly to sweep the demand and reclaiming $91,000 would be ideal for the bulls and very healthy for the next rally.
A less appealing area of imbalance for the bulls would be towards weekly low of $85,300-$86,300, that would be very painful for anyone longing a retest of the $91,000 area and from a HTF perspective would be a lower high and a SFP of the range midpoint, both bearish signals. The 4H 200 EMA is currently around that area at $87,000 too which would mean losing the level after just climbing back above it.
This week I'm looking at that first imbalance area to be a level of support for the next leg up, that's the ideal bullish scenario in my mind. A move below midpoint with acceptance is a red flag on this move and would start to look like a lower high bearish continuation.
Good luck this week!
