BTC - FVG + Golden Pocket Confluence = Short SetupA strategic high-timeframe imbalance meeting Fibonacci retracement, setting up a potential bearish reaction.
---
1. FVG + Golden Pocket — High-Value Supply Zone
The red shaded area defines a significant confluence:
- Fair Value Gap (FVG): Left behind by an aggressive drop, representing inefficiency where price is likely to react.
- Golden Pocket (0.618–0.65): High-probability Fibonacci retracement level, often acting as a magnet for liquidity before continuation.
This zone is primed to act as strong supply if price retraces into it.
---
2. 0.618–0.65 Fibonacci Retracement — Prime Rejection Zone
This Fib pocket offers:
- A technical level where aggressive buyers previously failed to hold ground.
- A common area where institutional players offload positions, triggering sell-offs.
A reaction inside this range aligns with broader bearish continuation expectations.
---
3. FVG Rebalance — Liquidity Collection
As price fills the inefficiency:
- It completes the rebalancing process, removing the incentive for further upward movement.
- Typically, liquidity grabs inside the FVG precede a sharp move back toward lower liquidity zones.
This supports the short bias post-rebalancing.
---
4. Expected Price Behavior — Liquidity Trap Mechanics
The projected move mirrors classical smart money behavior:
- Step 1: Induce late buyers into the FVG + Golden Pocket area.
- Step 2: Trigger a quick rejection after liquidity collection.
- Step 3: Resume downward pressure as imbalance is resolved.
The entire flow is designed to punish inefficient entries and reward patience.
---
5. Market Context Alignment
- FVG and Golden Pocket together strengthen the case for a precise, controlled rejection.
- Emphasis on liquidity-driven movements keeps the focus sharp on execution and timing.
---
6. Summary:
- FVG + Golden Pocket = Strong Supply Confluence
- High-Probability Short Setup Based on Rebalancing and Liquidity Collection
- Structured, Smart Money-Driven Price Behavior Expected
Tactically clean setup following liquidity engineering and imbalance theories.
Btc-bitcoin

GBPJPY NEXT WEEK BULLISH OR BEARISH ??GBPJPY is setting up for a major breakout on the weekly timeframe. After weeks of consolidation under a clear descending trendline, price action is now approaching a decisive point where a bullish breakout could trigger a strong rally. With the current price holding firm at 191.00 and clear resistance overhead, a successful breakout could open the doors for a powerful bullish wave targeting 205.000 and beyond.
Fundamentally, the yen remains weak due to continued Bank of Japan dovishness and ongoing yield curve control policies. Meanwhile, the British pound is finding strength as the Bank of England maintains a relatively hawkish stance with the possibility of delaying rate cuts compared to other major central banks. This fundamental divergence between GBP and JPY heavily favors bullish momentum for GBPJPY.
Technically, the pair has formed a solid base of support and is squeezing toward the apex of a descending triangle. If the breakout confirms with strong bullish volume, GBPJPY could enter a fresh bullish cycle, offering a great risk-reward setup for medium to long-term traders aiming for the 205.000 area.
Overall, GBPJPY remains one of the hottest pairs on watch right now with excellent bullish potential. Traders should watch for a clean breakout above the trendline with strong candlestick confirmation to ride the wave higher. Staying patient and disciplined around this breakout zone could deliver highly profitable results.

Bitcoin Trading and Investment Strategy (April 2025)Bitcoin (BTC) is trading around the mid-$90,000s after rebounding ~25% in April, with market sentiment shifting to greed. BTC’s dominance is high (~64%) as capital concentrates in Bitcoin over altcoins. On-chain data shows large holders (“whales”) aggressively accumulating, even as short-term traders turn optimistic. Below is an actionable strategy.
BTC broke out of a multi-month falling wedge pattern, signaling a potential bullish reversal. On the 1H/4H charts, momentum is bullish: a textbook double-bottom formed on the daily with a neckline around $87,600 was breached, confirming upside targets near $100,600.
A bull pennant consolidation is visible on the 1H after the sharp rally, hinting at another leg up (measured move target ≈ $100,900 on breakout). Short-term EMAs (20/50) on 1H/4H have turned upward and are stacked bullishly, aligning with the daily 50 and 200 EMAs which have flipped into support. The Relative Strength Index (RSI) is in bullish territory without extreme overbought readings, leaving room for further upside. Volume has been steady to rising on upward moves, indicating buyers remain in control.
Immediate support lies at the breakout zone of GETTEX:87K –$90K (prior resistance now turned support). This area includes the daily double-bottom neckline (~$87.6K) and coincides with the top of the earlier consolidation range. Bulls want to see this zone hold on any pullback. Below that, secondary support is around $84K and roughly the 4H 200 EMA area.
Resistance is clustered at $94K–$95K (recent local high region). A 4H close above $95K with strong volume would likely trigger momentum buyers. Beyond there, $100K is a major psychological level and the short-term target from multiple patterns – importantly, a dense cluster of short seller liquidation levels sits around $100K, making it a “liquidity magnet” for market makers. Expect heavy order flow and possible volatility as BTC approaches six figures. Above $100K, minor resistance could appear near ~$102K (projected wedge target), then prior ATH ~$108K–$109K.
For longs, scale out profits in layers as BTC advances. First TP around $100K – just before the round number – to avoid slippage if a wave of selling hits there. If momentum is very strong, hold a portion for a possible extension to $102K–$105K (wedge target zone). A stretch goal for bulls would be the $108–$110K area (all-time high region), but tighten stops well before this level as profit-taking is expected near ATH.
If BTC falls back under the GETTEX:87K neckline after having broken out, it would negate the double-bottom breakout and likely accelerate downward. Thus, stop-losses for longs can be placed just below GETTEX:87K (e.g. $86K) to cap risk.
The breakout from the wedge/base was accompanied by a surge in volume, confirming institutional participation. Volume has not dried up on this rally – a positive sign that the trend could sustain. Overall, the daily chart structure sets the stage for a potential run back to five-figure territory (100K+), provided key support levels are defended.
Any dips into the high-$80Ks are buy-the-dip opportunities as long as BTC quickly reclaims $90K. Below GETTEX:87K , the next critical support is $80K–$84K. $84K was highlighted as a crucial level – failure to hold 84K during the last pullback would have signaled capitulation. It held then, so watch it on any retest.
Stop Loss:
Short-Term: 5–10% below entry ($90,000 for $92,500 entry).
Mid-Term: 10–15% below entry ($85,000 for $91,000 entry).
Long-Term: Monitor support ($80,000) but hold unless fundamentals deteriorate.
Position Sizing:
Short-Term: 1–2% of portfolio per trade.
Mid-Term: 5% of portfolio.
Long-Term: Up to 10% of portfolio.
Risk/Reward: Target 2R for short-term, 3R for mid-term, and let long-term investments ride based on fundamentals.
Not a financial advice. DYOR.

BTC - Golden Pocket Confluence + FVG Sweep = Long SetupA highly refined scenario blending Fibonacci confluence with liquidity principles, setting up a controlled bullish play.
---
1. Golden Pocket + FVG Confluence — Critical Demand Zone
The blue highlighted area represents a strong confluence:
- FVG (Fair Value Gap): Imbalance left by aggressive price movement, likely to attract price for rebalancing.
- Golden Pocket: The 0.618–0.65 Fibonacci retracement zone, statistically favored for deep retracements and high-probability reversals.
Expecting strong buying interest once price taps into this confluence.
---
2. 0.618-0.65 Fib Range — Key Reversal Territory
The Fibonacci zone offers the perfect environment for engineered liquidity sweeps and smart money accumulation.
- This range often acts as a trap for retail shorts while institutions accumulate.
- A clean entry opportunity arises as price dips into this critical golden zone before expansion.
---
3. FVG Resistance Above — Initial Reaction Zone
A notable FVG resistance area is marked around 94,400–94,500:
- Upon reaching this zone, price may face initial selling pressure or short-term consolidation.
- Observing how price interacts here can further confirm bullish strength and continuation.
---
4. Smart Money Liquidity Play
The setup suggests a classic liquidity engineering move:
- Induce shorts through a pullback into the Golden Pocket.
- Absorb liquidity inside the FVG.
- Trigger a sharp bullish reversal aligned with institutional footprints.
This layered setup is clean, logical, and methodical.
---
5. Projected Price Flow
Anticipated price action structure:
- Step 1: Dip into the Golden Pocket + FVG demand zone.
- Step 2: Reversal toward the FVG resistance.
- Step 3: Breakout continuation upon reclaiming resistance, leading to further bullish expansion.
Each leg is mapped to follow high-probability liquidity behavior.
---
6. Summary:
- Golden Pocket + FVG = Prime Reversal Confluence
- Efficient Liquidity Sweep Mechanics
- Structured Bullish Progression Based on Smart Money Concepts
This plan is framed to capitalize on precision entries and liquidity dynamics without chasing price.

BTC Is Still Bullish (4H)This analysis is an update of the analysis you see in the "Related publications" section
Bitcoin is still struggling with the supply zone we identified in the previous analysis. It has not yet been able to establish itself above this supply area.
A slight correction is expected, with support anticipated from the green box.
The closing of a 4-hour candle below the invalidation level will invalidate this analysis.
For risk management, please don't forget stop loss and capital management
Comment if you have any questions
Thank You


btc . w4 - wknd . SHORT but cautious - yet paytientfriday plan, was to SHORT (see prvs post)
sell zone
starts . friday open
ends . monday open
entry . 95.542
sl . -2.62%
10 sell orders . 1.52% spread
tp1 . 91.642 . +3.99%
funding . +0.01%
we are according to plan + collecting funding
tp1 adjusted to moderate, since bullish outlook coming from april.
tp2 . +10.11%

$BTC - Weekend OutlookBitcoin just tapped into the major overhead supply zone 95k, which corresponds to the breakdown origin of the previous range.
Notably, we observed the highest Coinbase premium in recent sessions, signaling aggressive spot-driven demand. However, a sell wall is starting to build around 95k and 97k, suggesting that short-term sellers are positioning here.
Key support to watch : the 88k–86k range, which marks the recent breakout base and vwap.
Holding this zone would validate the breakout structure and set the stage for further continuation to the upside. Failure to hold likely triggers a deeper retest toward mid-range levels.
Expect volatility over the weekend as price oscillates between overhead supply and this critical breakout support.

BTCI expect Bitcoin to move between 75k and 90k until it breaks out in one direction.
I hope to see further growth up to 120k. There is also a small chance to reach 150k, but for now it looks unlikely.
At the same time, there is a risk of a drop to the 50k–60k area, which would be about a 50% correction from the top, similar to what happened in 2021.

$BTC Bull Trap Clear As DayI’m probably the biggest 3-Year perma-bull on this app, and even I can tell this is most likely a bull trap.
This is either the beginning of the long awaited parabola, or else we’ll correct back down to at least the 200DMA in the next week, or the 50DMA within the next month.
Lack of volume on the move and RSI becoming overheated gives me feels for the latter
Remember, never trust a weekend pump 💯
Bookmark this.

BTC → 𝐁𝐮𝐥𝐥𝐢𝐬𝐡 𝐏𝐫𝐞𝐬𝐬𝐮𝐫𝐞 !!!Bitcoin has completed and broken the ascending triangle in the monthly timeframe, The price is currently supported well, which can increase the price. I expect the price to rise to around 600k .
Give me some energy !!
✨We spend hours finding potential opportunities and writing useful ideas, we would be happy if you support us.
Best regards CobraVanguard.💚
_ _ _ _ __ _ _ _ _ _ _ _ _ _ _ _ _ _ _ _ _ _ _ _ _ _ _ _ _ _ _ _
✅Thank you, and for more ideas, hit ❤️Like❤️ and 🌟Follow🌟!
⚠️Things can change...
The markets are always changing and even with all these signals, the market changes tend to be strong and fast!!

BTC Pumped Hard – Is It Time for a Pullback to Fill CME GAP!?Bitcoin ( BINANCE:BTCUSDT ) started pumping after the pullback, as I expected in my previous post , I hope you were able to take profits.
Bitcoin is trading in the upper areas of the Heavy Resistance zone ($95,000-$88,500) , near the Resistance lines and the upper line of the ascending channel .
Also, we can see the Regular Divergence(RD-) between Consecutive Peaks .
From the Elliott Wave theory perspective , it seems that Bitcoin has completed the main wave 3 and we can expect the completion of the main wave 4 today .
I expect Bitcoin to correct in the next few hours and drop to the targets I have specified on the chart and fill the CME Gap($93,465-$91,415) .
Cumulative Short Liquidation Leverage: $95,700-$94,542
Cumulative Long Liquidation Leverage: $92,666-$91,415
Cumulative Long Liquidation Leverage: $90,276-$89,160
Note: If Bitcoin can break the upper line of the ascending channel, we should wait for the next pump.
Please respect each other's ideas and express them politely if you agree or disagree.
Bitcoin Analyze (BTCUSDT), 1-hour time frame.
Be sure to follow the updated ideas.
Do not forget to put a Stop loss for your positions (For every position you want to open).
Please follow your strategy and updates; this is just my Idea, and I will gladly see your ideas in this post.
Please do not forget the ✅' like '✅ button 🙏😊 & Share it with your friends; thanks, and Trade safe.

Bitcoin Cycle Update – Are We Nearing the Peak?Check out this BTCUSDT chart – we’re at GETTEX:92K today, and seems like things are heating up!
▸We’ve seen a Cycle Bottom in late 2022 - early 2023, followed by strong Bull runs in 2023 and 2024.
▸Those Consolidation phases (sideways channels) gave us the perfect setup for massive pumps!
▸Right now, we’re in a Pause Triangle after a big rally – but the Cycle Top could be just around the corner in mid-2025.
▸After that? A potential Bear phase – time to plan your moves!
💡 What’s your strategy? Are you riding this wave to the top, or preparing for the next dip? Let’s discuss 📨

BTC.D Needs to Hit 71% For Alt Season To HappenI hate to be the bearer of bad news, but the face-melting Alt Season we are all patiently awaiting is not arriving until BTC.D reaches 71%
Having said that, there WILL be an outlier of Alts that outperform CRYPTOCAP:BTC , such as CRYPTOCAP:SOL 💯

$BTC cycle projection. Upside to $134k-$160k, then to sub $33kHere's a chart of my cycle projection of bitcoin. I think it's likely that we find support in the $62k region over the next couple of weeks and then continue the bull run up to $129k-$137k.
In terms of gains from here, I think BTC is only a ~2x, however, I think we're going to see our biggest altcoin run since bitcoin's inception.
After we hit the top $134k-160k, I think we'll make a very large correction back down to the $20-30k region (supports on the chart) before the next long term cycle begins.
This is the final wave of the first cycle of bitcoin.
Lots of money to be made.

BTC or Gold?Answer Gold!
The BTC/Gold ratio is on the verge of cracking here.
A crack here will trigger a sell-off in BTC relative to Gold.
This is a very simple, low risk, ratio trade.

BTC - Two Bullish Scenarios...Hello TradingView Family / Fellow Traders! This is Richard, also known as theSignalyst.
📉 BTC has been overall bearish, trading within the falling channel marked in red.
The $70,000 area is a key confluence zone — it aligns with the lower red trendline, horizontal support, a psychological round number, and a potential demand zone.
📚 According to my trading style:
As #BTC approaches the blue circle zone, I’ll be looking for bullish reversal setups — such as a double bottom pattern, trendline break, and more.
🏹In parallel, for the bulls to take over long-term, and shift the entire trend in their favor, a break above the last major high marked in red at $88,888 is needed!
📚 Reminder:
Always stick to your trading plan — entry, risk management, and trade management are key.
Good luck, and happy trading!
All Strategies Are Good, If Managed Properly!
~Rich

Do you think I'm joking ???Chart is speaking itself...
Give me some energy !!
✨We spend hours finding potential opportunities and writing useful ideas, we would be happy if you support us.
Best regards CobraVanguard.💚
_ _ _ _ __ _ _ _ _ _ _ _ _ _ _ _ _ _ _ _ _ _ _ _ _ _ _ _ _ _ _ _
✅Thank you, and for more ideas, hit ❤️Like❤️ and 🌟Follow🌟!
⚠️Things can change...
The markets are always changing and even with all these signals, the market changes tend to be strong and fast!!

BTC has just bounced, game a long entry from weekly support..110
“🔍 BTC has just bounced off our weekly support—here’s why I’m eyeing $110k next…”
Analysis bullets:
🛑 Risk: stop-loss around $78–80k (weekly close below red band)
▶️ Entry: current weekly close above the descending trendline
🎯 Target: $110k resistance (green zone)
Call to action:
“What do you think — will we break out or retest lows? Comment below! 👇”

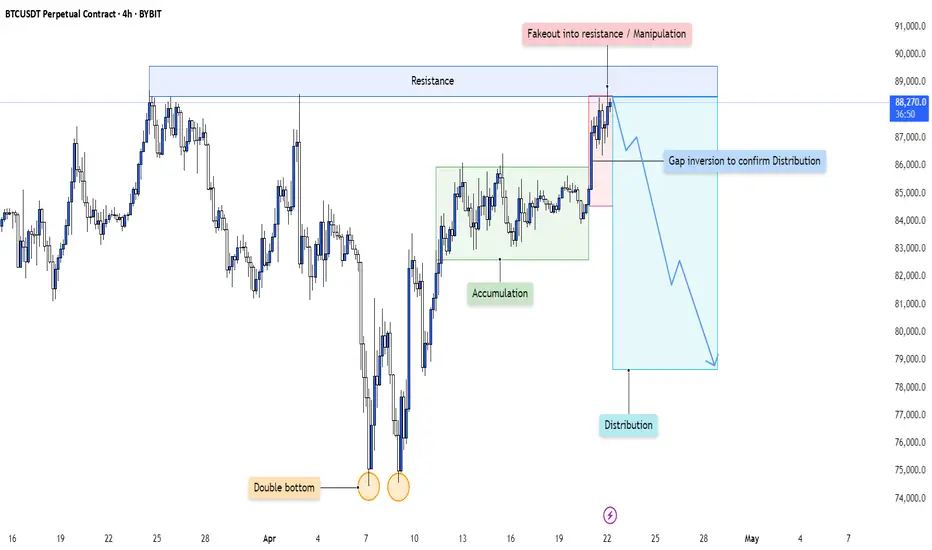
BTC - Distribution Confirmed After Accumulation Cycle CompletionThis 4H chart is a textbook illustration of how smart money cycles play out over time—starting with accumulation, leading into a sharp markup, and culminating in a deceptive distribution phase characterized by manipulation and false breakouts.
Let’s dissect each stage of this engineered move:
---
1. Accumulation Phase Following a Double Bottom
At the left of the chart, price forms a clear double bottom —a classic retail reversal signal.
- Smart money likely used this area to absorb sell-side liquidity, building long positions while retail traders expected further downside.
- This base formation set the foundation for the upcoming accumulation range , marked by sideways price action and multiple rejections from both highs and lows of the range.
The purpose of accumulation is simple: transfer supply from weak hands to strong hands. Every dip in this range allowed large players to fill bids without driving price too aggressively.
---
2. Sharp Markup and Resistance Interaction
Once positions were fully loaded, price launched into a strong impulsive move upward , confirming the transition from accumulation to markup.
- The move stalled at a clear horizontal resistance zone—marked as an area of prior supply and potential seller re-engagement.
- Price consolidated just below this resistance, building tension and liquidity in the form of breakout longs and stop orders from early shorts.
This led to the final stage of the cycle: distribution via manipulation.
---
3. Manipulation Above Resistance: The Fakeout
What followed was a classic fakeout above resistance .
- Price briefly broke above the key resistance area, attracting breakout buyers who assumed the trend would continue.
- In reality, this move served as a liquidity sweep and exit trap , allowing institutions to offload long positions accumulated earlier.
- The immediate rejection from this fakeout confirms a bull trap —a hallmark of distribution.
This is where smart money transitions from buyers to sellers while retail is left holding the bag.
---
4. Gap Inversion: Confirmation of Distribution
Post-fakeout, price creates a gap and immediately inverts back into the prior range , invalidating the breakout and forming a clear distribution schematic .
- The gap acts as a volume void or inefficiency , often revisited in reversal models.
- Once this area is rejected and price fails to reclaim the resistance zone, it becomes clear that distribution has been finalized.
- This breakdown marks the beginning of a markdown phase—typically faster and more violent than the markup.
The rejection confirms that price is now being delivered to the downside.
---
5. Narrative: From Accumulation to Redistribution and Collapse
This setup isn’t random—it’s narrative-driven:
- Double Bottom → Accumulation → Breakout → Manipulation → Distribution → Reversal
Each phase builds on the previous one, guided by smart money's intent to trap liquidity and maximize profit during transitions.
Now that distribution is confirmed, the expectation is continued downward delivery as price seeks out untapped liquidity and rebalances imbalances left behind during the markup.
---
Conclusion:
This 4H structure is a clear representation of the Wyckoff distribution model in action:
- Accumulation fuels markup.
- Breakout entices buyers.
- Manipulation traps them.
- Distribution unloads supply.
- Reversal completes the cycle.
The move down is not a random pullback—it is the deliberate continuation of a planned liquidity cycle . Expect further downside unless this structure is invalidated with a reclaim and break of the prior fakeout zone.
Will ETH do it again?Looks like we are in a decent spot to scale in for the next mark-up phase.
ETH has retraced a bit further/deeper than originally anticipated, however that just makes the entry all the better.

$BTC Closes Above the 200DMAPretty crazy how accurate ₿itcoin PA follows my squiggles, eh? 🤓
CRYPTOCAP:BTC has Closed above the 200DMA with a massive 25% rally over the past two weeks.
Next target $100k, but expect a retest of the 200DMA ~$88,5

#BTC Market Update – April 22, 2025Current Price: $90,700 (+4%)
📊 Technical Overview
• 200-Day MA: $88,356 – BTC is trading above it → Bullish sign
• RSI: 78 – Overbought zone → Possible pullback
• Resistance: $90,000 – Key psychological level
• Support: $85,000 – Watch this level on retracement
🔗 On-Chain Insight
• Long-Term Holders: Some distribution happening → Profit-taking
• Network Activity: Steady → Healthy usage
• Sentiment: Bullish → Weak USD + institutional inflows
🧭 Macro & Fundamentals
• U.S.–China tensions + Fed uncertainty → BTC seen as safe haven
• Institutions are increasing their exposure → Positive market signal
✅ Summary:
BTC shows strong bullish momentum, but RSI is overheated. Stay alert for potential short-term correction. Key levels: $85K support / $90K breakout.
