Daily Price Action BITCOIN BTC Tuesday 4/22/2025In this video, we will be looking into the potential price action of BTCUSD.
Btc-bitcoin

BTCUSD Weekly Analysis Targeting; 94k - 96k, Followed By 109k
BTCUSD Weekly Analysis
Bitcoin is currently trading around $88,638, showing strong recovery momentum after bouncing off the key 61.8% Fibonacci retracement level at $74,412, often referred to as the “golden pocket.” This bounce suggests that buyers are stepping in aggressively at this support zone, which has historically acted as a major turning point in bullish market structures.
On the upside, BTC has now reclaimed the 38.2% retracement level at $87,375, turning it into a short-term support zone. Holding above this level gives Bitcoin a clear path toward the next key resistance at $94,430, followed by a stronger resistance cluster around $96,211, where both Fibonacci and historical horizontal resistance align.
Technically, the weekly chart also confirms a breakout above the descending trendline, adding confluence to the bullish reversal. This move aligns with the Inverse Head & Shoulders pattern seen on the daily chart — a classic bullish formation that typically leads to strong upward continuation.
If BTC continues to hold above $87,000, the next short-term target would be $94,000–$96,000, and if that level breaks with volume, Bitcoin could be gearing up for a retest of its previous highs around $109,000. On the downside, $81,145 (50% retracement) and $74,412 (61.8%) remain critical support levels, with any break below $74K shifting the outlook back to bearish.
The chart structure, key Fibonacci zones, and bullish reversal pattern all point toward continued upside, with BTC needing to maintain above GETTEX:87K to sustain the bullish trend.

BITCOIN - Bullish Double BottomHello Traders !
The BTC price formed a double bottom pattern.
Currently, The neckline is broken !
So, I expect a bullish move🚀
______________
TARGET: 88700🎯

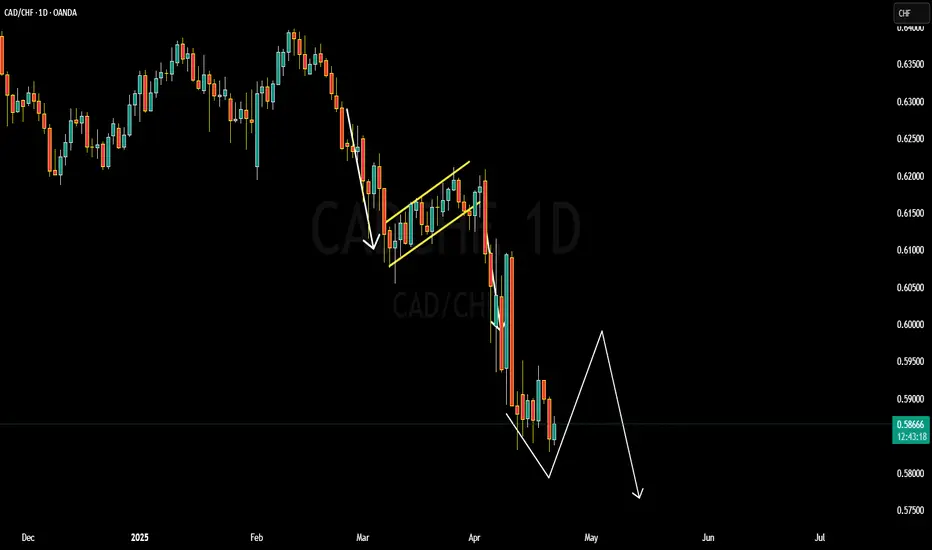
CADCHF BULLISH OR BEARISH DETAILED ANALYSIS We closely monitoring CADCHF, which is currently trading around 0.588. The pair has been in a strong downtrend, reflecting the broader weakness in the Canadian dollar against the Swiss franc. Technical indicators, including moving averages and momentum oscillators, suggest continued bearish momentum.
Fundamentally, the Canadian dollar is under pressure due to declining oil prices and a cautious stance from the Bank of Canada regarding interest rate hikes. In contrast, the Swiss franc benefits from its safe-haven status amid global economic uncertainties. The Swiss National Bank's relatively stable monetary policy further supports the franc's strength.
Key support levels to watch are at 0.57 and 0.58, while resistance levels are at 0.6050 and 0.6100. A break below the support could signal further downside potential, whereas a move above the resistance might indicate a reversal. Traders should remain cautious and consider macroeconomic developments when making trading decisions.
In conclusion, CAD/CHF presents a bearish outlook in the near term, influenced by both technical and fundamental factors. Monitoring economic indicators and central bank policies will be crucial for identifying potential trading opportunities in this pair.
WHY EURUSD IS STILL BULLISH DETAILED ANALYSIS We closely monitoring EUR/USD, which is currently trading around 1.0430. The pair has shown resilience after rebounding from the 1.0220 support level, forming a bullish engulfing pattern on the 3-day chart. This pattern suggests potential for a bullish reversal, especially as the Relative Strength Index (RSI) recovers from oversold conditions. The price action aligns with the lower boundary of a long-term descending channel, indicating a possible shift in trend.
Fundamentally, the euro is under pressure due to the European Central Bank's (ECB) recent rate cut to 2.25%, marking the seventh reduction since mid-2024. This move aims to counteract the economic slowdown exacerbated by U.S. tariffs on EU imports. In contrast, the U.S. dollar faces its challenges, with political tensions arising from President Trump's criticism of Federal Reserve Chair Jerome Powell for not cutting rates swiftly. These dynamics have led to increased volatility and a weakened dollar, influencing EUR/USD movements.
Technically, the ascending triangle pattern observed on the 4-hour chart supports a bullish outlook. A decisive break above the 1.0625 resistance could pave the way for targets at 1.0760 and subsequently 1.0850. However, traders should remain cautious, as a drop below the 1.0220 support might signal a continuation of the bearish trend, potentially testing parity levels.
In the current market environment, it's crucial to stay updated with economic indicators and geopolitical developments. Key events, such as U.S. Non-Farm Payrolls and Eurozone inflation data, will provide further insights into the pair's direction. Employing sound risk management strategies and staying informed will be essential for navigating the EUR/USD landscape effectively.

(BTC) bitcoin "signs"the blue/green line is crossing the purple dotted line. This is a sign representing a transitional phase between moving averages where the short line begins to cross over the patterns of longer time frames. I was looking at this today and though any indicator is never 100% accurate it is always better to see positive signs rather than no signs at all. Could this be the summer of crypto? A positive crypto summer unlike so many previous years? I'm well aware the second quarter just started and summer is not close by 3 months time.

BTC Breaks Key Resistance –Pullback Your Last Chance to Enter!?To start today's analysis, it's best to look at the Bitcoin ( BINANCE:BTCUSDT ) analysis I shared with you on April 10 , which can give us good insight and has performed well so far .👇
Bitcoin seems to have finally managed to break through Important Resistance lines as well as the Resistance zone ($86,500-$85,150) . The break volume is also high and could be a good sign for the continuation of the upward trend .
According to Elliott Wave theory , with the breaking of important resistance lines , we should wait for the next 5 impulsive waves , which I will try to analyze step by step in this idea and future ideas.
I expect Bitcoin to attack the Heavy Resistance zone ($95,000-$88,500) for the first time after the pullback to the broken Resistance zone ($86,500-$85,150) (it is better to enter a long position on the pullback ). Basically, assets can NOT break such heavy zones for the first time . ( With very good news, it may break for the first time ).
Cumulative Long Liquidation Leverage: $86,022-$85,539
Cumulative Short Liquidation Leverage: $89,340-$88,000 = Important
Do you think the main uptrend has resumed or will Bitcoin correct again?
Note: The pullback is likely to start from the third point of contact with the Resistance lines.
Note: If Bitcoin falls below $85,100, it seems we should expect further declines.
Please respect each other's ideas and express them politely if you agree or disagree.
Bitcoin Analyze (BTCUSDT), 1-hour time frame.
Be sure to follow the updated ideas.
Do not forget to put a Stop loss for your positions (For every position you want to open).
Please follow your strategy and updates; this is just my Idea, and I will gladly see your ideas in this post.
Please do not forget the ✅' like '✅ button 🙏😊 & Share it with your friends; thanks, and Trade safe.

Failed Breakout + Rising Wedge = Bearish Signal for Bitcoin!?Bitcoin ( BINANCE:BTCUSDT ) attacked the Resistance zone ($87,520-$85,840) and the important Resistance line as I expected in yesterday's idea , but it seems that it failed to break .
Bitcoin is moving between two Support and Resistance zones .
From a Classic Technical Analysis , Bitcoin appears to have formed a Rising Wedge Pattern .
From an Elliott Wave theory , Bitcoin appears to have completed a main wave 5 on the 1-hour time frame .
Also, we can see the Regular Divergence(RD-) between Consecutive Peaks .
If we look at the Bitcoin chart in the 4-hour timeframe , a Shooting Star Candlestick Pattern with high volume is clearly visible near the Resistance zone ($87,520-$85,840 ), which could signal a reversal and decline in Bitcoin .
I expect Bitcoin to start declining again after an upward correction and break the lower line of the rising wedge pattern , and reach the targets I have indicated on the chart.
Cumulative Short Liquidation Leverage: $87,708-$86,487
Cumulative Long Liquidation Leverage: $84,520-$83,687
Do you think Bitcoin can finally break the important resistance line? I would like to hear your thoughts.
Note: If Bitcoin breaks above the Resistance zone ($87,520-$85,840), we can expect a pump.
Note: If Bitcoin falls below $81,000, we can expect further declines.
Please respect each other's ideas and express them politely if you agree or disagree.
Bitcoin Analyze (BTCUSDT), 1-hour time frame.
Be sure to follow the updated ideas.
Do not forget to put a Stop loss for your positions (For every position you want to open).
Please follow your strategy and updates; this is just my Idea, and I will gladly see your ideas in this post.
Please do not forget the ✅' like '✅ button 🙏😊 & Share it with your friends; thanks, and Trade safe.

BTCUSD: Heavily supported, targeting $160k.Bitcoin is neutral on its 1W technical outlook (RSI = 51.863, MACD = 1668.900, ADX = 41.878), running a bullish steak of 3 green 1W candles in a row. Supported heavily by the 1W MA50, this looks like all previous HL bottoms since late 2022. Those kickstated bullish waves that have reached at least the 2.0 Fibonacci extension. The medium term trade here is long, TP = 160,000.
## If you like our free content follow our profile to get more daily ideas. ##
## Comments and likes are greatly appreciated. ##

Bitcoin Laguerre Weekly Setup – Road to $110K or Breakdown Risk?📈 Idea:
Bitcoin continues to hold above key weekly support, consolidating after its recent move up. Using the Laguerre system as confirmation, we’re now watching a high-stakes setup with two clear paths:
🔸 Bullish Scenario:
A breakout from the current wedge structure could ignite momentum toward the $110,000 target zone, aligning with Laguerre mid-band strength and upper Bollinger expansion. That orange line is the roadmap — breakout, retest, push.
🔻 Bearish Risk:
If price fails to hold the ~$80K region, the structure breaks down — risk increases sharply. The 50-week EMA and Laguerre zone below offer possible support, but the setup weakens significantly.
🧠 Why It Matters:
Laguerre momentum curling up from key zones
Clean trend structure with well-defined risk
Weekly compression often leads to expansion
🎯 Target: $110,000
🛑 Risk Line: $80,000
📅 Timeframe: Weekly
🔍 System: Laguerre + Trend Structure
Drop your thoughts 👇
Are we gearing up for the next leg or prepping for a flush?
#Bitcoin #BTC #Crypto #Laguerre #TradingView #WeeklySetup #JTraderEdge

Bitcoin Bearish Dead Cat BounceI am not a financial advisor. This is not meant to be and does not constitute financial, investment, trading, or any other types of advice or recommendation.

Bitcoin 240k next 10k on bear marketOn chart I see good support level created on Covid times and good liquidity compression which must be grabed well. Alternative scenario we must see very good move upside to 500k+ but I don't believe in it.

Bitcoin - Is Bitcoin on the way up?!Bitcoin is above the EMA50 and EMA200 on the four-hour timeframe and has broken out of its descending channel. The continuation of Bitcoin’s upward trend will depend on maintaining the drawn upward trend line.
A valid break of this trend line will cause Bitcoin’s price to correct to the 80,000 range. It should be noted that there is a possibility of heavy fluctuations and shadows due to the movement of whales in the market and compliance with capital management in the cryptocurrency market will be more important. If the downward trend continues, we can buy within the demand range.
Following the announcement of new trade tariffs by the United States, Bitcoin experienced a 16.7% drop in price. However, it partially recovered from its 26.7% plunge. The total global cryptocurrency market capitalization has now reached $2.74 trillion, marking a 1.71% increase compared to the previous day.
Over the past 24 hours, the total crypto market trading volume hit $60.7 billion, reflecting a 32.28% rise. Within this, DeFi transactions account for $5.25 billion, making up 8.65% of the total 24-hour market volume. Meanwhile, stablecoins have dominated trading activity with $55.84 billion in volume, representing 92% of the total market volume for the day.
When comparing Bitcoin’s performance to other major assets, gold leads with a 12.9% gain. In contrast, both silver and the U.S. Dollar Index saw a 4.8% decline. The S&P 500 fell by 13.8%, while the Nasdaq dropped 17.5%. Despite its volatility, Bitcoin sits between oil and the Nasdaq in performance, showing signs of partial recovery. However, its behavior still diverges from that of traditional safe-haven assets like gold.
On the political front, Hong Joon-pyo, a presidential candidate from South Korea’s conservative party, pledged that if elected, he would implement reforms in blockchain and cryptocurrency regulations. He also promised to integrate blockchain technology into public sector and administrative services. Additionally, Hong plans to invest at least 50 trillion Korean won (approximately $35.1 billion) over the next five years in research and development across artificial intelligence, quantum technology, and room-temperature superconductors. These initiatives are part of his broader strategy focused on growth driven by emerging technologies.
In Q1 2025, publicly traded companies collectively acquired 95,431 bitcoins, bringing their total holdings to 688,000 BTC. This amount represents 3.28% of Bitcoin’s fixed supply of 21 million coins.
The Coinbase Premium Index, which tracks the difference in Bitcoin demand between U.S. markets and global exchanges, has shown reduced volatility since March 2024. It appears to be forming a pattern often seen before bullish market trends.
Robert Kiyosaki, renowned entrepreneur and author of the best-selling book Rich Dad Poor Dad, has forecasted that Bitcoin’s price could rise to between $180,000 and $200,000 by the end of 2025. Kiyosaki has long been an outspoken supporter of Bitcoin, portraying it as a safe hedge against inflation and economic instability.

Bitcoin $200k in June 2025Despite the fact that US stocks look bleak, there is no better time for growth than the spring-summer of 2025. By the end of the year, the statistics will start to come out quite sad, and if you do All Time High, then only now. I am waiting for positive news
I estimate the probability of such a scenario at 65%

GBPCAD IS BULLISH OR BEARISH DETAILED ANALYSISGBPCAD is currently presenting a high-probability bullish setup after a textbook inverse head and shoulders formation on the 12H chart. Price is now hovering around 1.8457 and has just broken out above the descending trendline acting as neckline resistance. This structural shift, combined with clean bullish price action, signals the potential beginning of a fresh upward leg toward the 1.8976 region, a prior key supply zone and the projected target based on the measured move technique from the pattern.
From a fundamental standpoint, the British Pound is supported by hawkish BoE rhetoric and stronger-than-expected UK inflation data. Sticky core CPI and a robust labor market are keeping interest rate expectations elevated, which strengthens GBP across the board. In contrast, the Canadian Dollar remains under pressure due to softer oil prices and the Bank of Canada's dovish stance as it flirts with rate cuts in upcoming meetings. This macro divergence is fueling the momentum in GBPCAD’s favor, making it a favored pair for swing longs.
Technically, the pair is forming higher lows with increasing volume, which adds confidence to the breakout. The risk is well defined below 1.8198, making this an attractive trade with a solid 1:2+ reward-to-risk profile. As price continues to respect bullish market structure, any pullback toward the neckline could offer a prime re-entry zone for continuation traders.
This setup aligns with highly searched price action strategies such as “inverse head and shoulders breakout,” “neckline retest,” and “GBP strength vs CAD weakness.” With both technical and fundamental confluence pointing in the same direction, GBPCAD is set up for a potentially profitable swing opportunity heading into May.


Bitcoin risingBitcoin had 2 bullish divergences on daily TF , now its rising and 98k is not that hard to reach IMO

Skeptic | Bitcoin (BTC/USD) Analysis: Why 85850 is Critical!The breakout above 85,850 could push Bitcoin into a new uptrend phase, potentially driving price toward 90K, 95K, and even 105K in the coming weeks. That’s why this zone is so important. But let me explain why in more detail.
⭐Let’s start with the daily timeframe. After breaking out of its descending trendline, BTC entered a range between 82,800 and 85,850 . Looking at the bigger picture, you’ll see that 88,500 is a key resistance level — and breaking above it could act as a strong trigger.
But if you’re not a breakout trader and prefer reactive entries, the 80K–82K zone is a major PRZ (Potential Reversal Zone) based on RSI, Fibonacci, and Pivot Points — meaning it could offer a decent spot-buying opportunity.
Just keep in mind: we’re not officially in a daily uptrend yet, so if you’re thinking about spot buying, it’s better to wait for a confirmed higher low and higher high on the daily chart.
The long-term target for the next uptrend is around 140K , based on long-term Fibonacci extensions, pivot points, and trend channels.
🔮 Now let’s drop to the 4H timeframe to find some long and short triggers.
As you can see, we’ve got a range box between 83,055 and 85,853.89.
A long trigger activates after a clean breakout above 85,853.89.
A short trigger activates after a breakdown below 83,055.
It’s better to use stop buy/sell orders rather than entering at market price, since price may move sharply after staying in this box for quite a while.
You can also use this box to set your stop losses.
If you’re a reaction-based trader, you could:
Short around 85,853 when price reacts there,
Or go long around 83,055, depending on your personal strategy.
Just remember: crypto markets often fake breakouts, especially during low-volume periods like now.
Indicators like RSI, Volume, and SMA can help confirm moves.
Understanding momentum — when it’s present and when it’s not — can save you from taking unnecessary trades.
Also, the candlestick itself matters a lot:
How long is the shadow?
What’s the body size and color?
Are we getting strong bullish or bearish confirmations?
If you want a tutorial on identifying real vs. fake breakouts, let me know in the comments — I’ll make one soon.
If you enjoyed the analysis, hit that Boost
By the way, I’m Skeptic.

BTC - Halving Cycle | Historical Patterns & 2025-2026 Projection
In this chart, we dive deep into the cyclical nature of Bitcoin price action post-halving and draw parallels between past and current movements, with a specific focus on how the market has historically reacted at various intervals following each halving event. This analysis incorporates both structural and temporal elements, providing a potential roadmap based on previous behavior.
---
Historical Context: Previous Cycles
3rd Halving – May 11, 2020
Following the 3rd Bitcoin halving, we observed a parabolic run-up over the next several months:
- 11 months after halving (April 2021): BTC reached a major peak, hitting nearly $65,000.
- This was followed by a significant correction.
- 19 months after halving (December 2021): Bitcoin printed a second top close to the previous all-time high, forming a classic double top pattern. This structure often signals market exhaustion and precedes deeper corrections.
Cycle Completion – Price Reversion
By 30 months after the 3rd halving (around November 2022), BTC had retraced much of its gains and returned to prices nearly equivalent to the halving level (~$8,000–$10,000 zone in log-adjusted terms). This marked the end of the cycle, confirming a full reversion to the mean after the double-top distribution phase.
---
Current Cycle: 4th Halving – April 19, 2024
We're now entering the 4th post-halving cycle , and so far, the structure appears to be rhyming closely with the previous cycle :
- Pre-halving rally took BTC to ~ FWB:73K (March 2024), indicating strong bullish momentum leading into the event.
- If this cycle follows a similar path, we may expect:
- A first major top around 9 months after the halving , potentially at or above $100K.
- A second top forming around 17 months after the halving (projected for September 2025), possibly signaling the beginning of a broader correction phase.
---
Projection: October 2026 (30 Months After Halving)
Using the same temporal framework:
- By October 2026 (30 months post-halving), the chart suggests a return to a much lower level , possibly around $50K.
- This projection mimics the post-double-top decline of the previous cycle, reinforcing the idea of cyclical mean reversion .
- It’s important to note: this isn’t necessarily bearish, but it highlights the cyclical and psychological nature of markets —boom, euphoria, distribution, and reversion.
---
The Macro View: Halving Cycles Are Rhythmic
- Every halving has historically set off a new bull run, but the timing of tops and bottoms is shockingly consistent :
- Peaks often occur 9–18 months post-halving .
- Full cycle completion is around 30 months post-halving.
- These cycles are heavily influenced by supply shocks , market psychology , and macro liquidity cycles .
---
Final Thoughts
This chart isn’t a guarantee—it’s a probability model based on cyclical symmetry. If history repeats or rhymes, we may be witnessing another textbook cycle play out, where a euphoric run in 2025 gives way to a deep correction by late 2026.
Stay alert for the double top pattern and macro divergences. Just as in 2021, timing the exit after the first peak can be the difference between profit and pain .
What do you think? Will Bitcoin follow the same 30-month post-halving trajectory?

Inverted Head & Shoulders Pattern for BTC??!!!??!Bitcoin appears to be trading in an inverted h&s pattern.
Which coincides with a bullish breach of a Bullish Expanding Triangle highlighted in red to the upside!!
A double bottom is where the head of the inverted triangle can be formed, the space between the two bottoms forms the apex of the head of triangle.
First upside target of $90k USD
Second upside target is $260k USD

The Perfect Bounce- Quick update
- IYKYK.
- Everything is in graph, no need a long speech.
Happy Tr4Ding !

Bitcoin Monitoring- This is not a trade setup.
--------------------------------------------
- Zones to keep close surveillance :
--------------------------------------------
- 25,200$
- 27,300$
--------------------------------------------
Happy Tr4Ding!

BTC Diamond Ser ?- While bears see bearish pennants, I see diamonds in the rough.
- I remain bullish, not due to the price, but for the sake of humanity.
- This isn’t an analysis, just a light-hearted joke, so please don’t roast me too hard! 🙏.
- Remember, diamonds are forever.
- Hodl!
Happy Tr4Ding!
