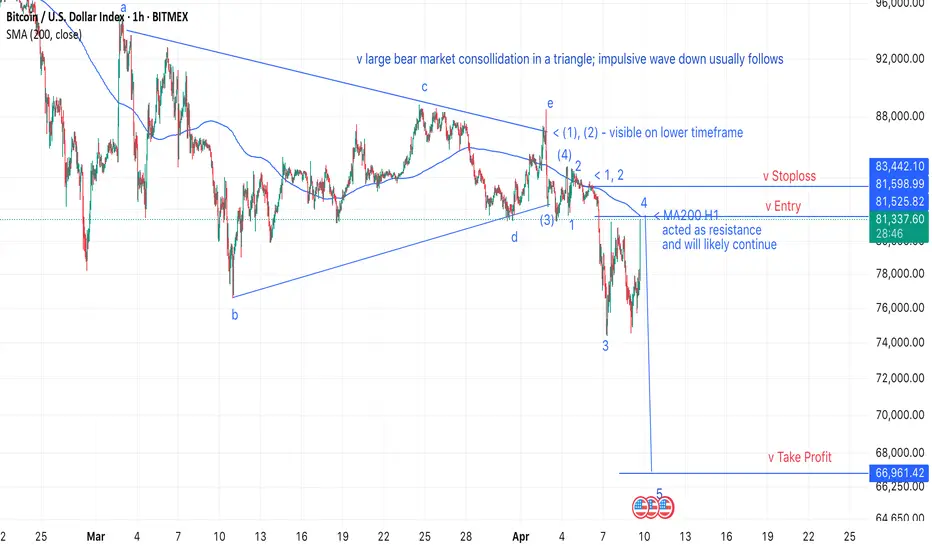
[BTC short] Entry: 81.5k, SL: 83.5k, TP: 67kThe backdrop is my prediction of a 2008-style crash, with Bitcoin (BTC) dropping to $26k (see related ideas).
During the crash, I’ll aim to capitalize on short-term moves, targeting clear patterns with high reward-to-risk ratios.
Following a prolonged consolidation—resembling a triangle—an impulsive wave down has begun to form. I now expect the 200-hour moving average (MA200 H1) to act as resistance, pushing the price to a new low and trade accordingly.
Btc-bitcoin

Bitcoin Pullback Complete – Bears Gearing Up for Round Two!!!First of all, let me say that the market has been very excited these past few days, so be more careful with your capital management.
Also, these days, Bitcoin ( BINANCE:BTCUSDT ) has a high correlation with the US stock market indices , and one of the most important of them is the S&P 500 Index ( FOREXCOM:SPX500 ).
Today, I published the following analysis for the S&P 500 Index , which I used as a result of that analysis for Bitcoin .
Bitcoin is trading near the Resistance zone($81,610-$79,800) , the Yearly Pivot Point , the Daily Pivot Point , the important uptrend line (broken) , and the Cumulative Short Liquidation Leverage($81,500-$79,677).
Overall, it seems that this uptrend in Bitcoin over the past few hours was a pullback to the broken Important uptrend line and the liquidation of short position s. Do you agree with me?
In terms of Elliott Wave theory , it seems that the uptrend of the last few hours has been in the form of a Zigzag Correction(ABC/5-3-5) and we should expect another decline .
Based on the above explanation , I expect Bitcoin to resume its downtrend and approach the Potential Reversal Zone(PRZ) again ( after breaking the support lines ).
Cumulative Long Liquidation Leverage: $74,520-$73,244
If you want to see my overall view of Bitcoin on the weekly timeframe and further understand the significance of the Uptrend line(broken) , you can refer to the following idea:
Note: If Bitcoin can completely fill the CME Gap($84,475-$81,450), we should expect further increases.
Please respect each other's ideas and express them politely if you agree or disagree.
Bitcoin Analyze (BTCUSDT), 15-minute time frame.
Be sure to follow the updated ideas.
Do not forget to put a Stop loss for your positions (For every position you want to open).
Please follow your strategy and updates; this is just my Idea, and I will gladly see your ideas in this post.
Please do not forget the ✅' like '✅ button 🙏😊 & Share it with your friends; thanks, and Trade safe.

[BTC] Crash to $26k: Generational Buying OpportunitySince 2022, Bitcoin has surged in a major bull market, hitting the psychological $100k milestone. However, a triple divergence on the weekly RSI signals an overbought market, pointing to an imminent pullback.
The recent peak likely marked the end of Wave (3). Given that Wave (2) was an expanding flat (verifiable on lower timeframes), Wave (4) should bring a sharp, significant correction.
Wave 4 of (3) formed a running triangle, followed by a short Wave 5—exactly as occurred. Running triangles in Wave 4 paired with a brief Wave 5 often indicate distribution, typically preceding a major move against the trend.
The price action from March 2024 into 2025 resembles classic distribution. Since peaking near $110k, Bitcoin has declined slowly but steadily, suggesting a major crash rather than a typical medium-term pullback.
The $26k–$30k range offers robust support, and it’s unlikely the price will drop much lower. Along the way, the 200-week moving average (MA200 Weekly)—Bitcoin’s strongest historical support—could trigger a significant bounce. However, if this level is decisively breached, full-blown panic could ensue.
Given my expectation of a 2008-style bear market in the S&P 500 (see related ideas), the timing aligns perfectly. A market-wide crash would inevitably impact Bitcoin, as panic drives capital out of all markets to meet margin calls.
The $26k zone should mark the crash’s bottom, potentially presenting a generational Bitcoin-buying opportunity. If the S&P 500 retests its COVID lows while Bitcoin only revisits its 2023 consolidation range, it would underscore BTC’s relative strength. Once panic subsides, capital could flood into Bitcoin from across the globe.
Technically, this would be the bottom of Wave (4). Wave (5) could then propel Bitcoin to $1 million per coin in a powerful uptrend.

1day chart fallingwedge/bullish pennant on bitcoinI just posted a weekly version of this same pennant in the previous idea which I will link below, i wanted to also post the version of it on the 1day timeframe as well because the top trendline of the wedge on the 1day time frame has a different trajectory which lengthens the wedge considerably. With this longer wedge we can see that if it is the more valid for the 2 versions, that we probably wouldn’t be expecting a breakout until June at the earliest. Not quite sure yet which version of this wedge is ore valid so I’m posting both versions for now to keep and eye on them. For the weekly charts pattern to be the more valid of the 2, we will likely need to see the weekly 50ma continue to maintain support. *not financial advice*

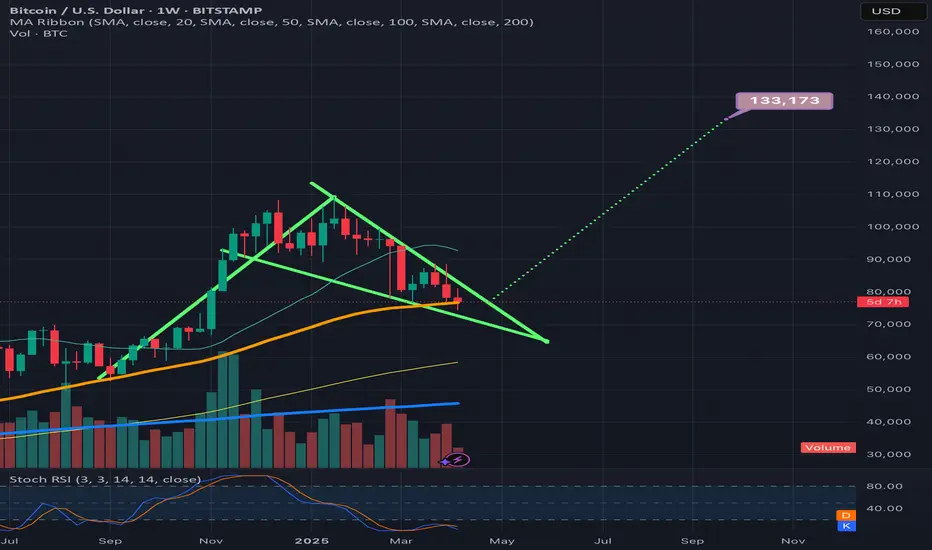
BTCUSD. Weekly bull pennantThe daily failing wedge’s top trendline is not as sharp of a trajectory as the the weekly timeframe’s and due to this, the daily time frames wege is noticeably longer, so I thinkI am going to post a follow p idea to this one that shows the longer version of the wedge, not sure which one is more valid yet at this current time. If the weekly 50ma(in orange) can hold support then we should break up from this wedge right around where I have placed the dotted measured move lne, in which case the breakout target would be around 133k, if the longer version of the wedge on the daily time frame is the more valid of the two then we will likely have to correct longer before we see a breakout. Will post the longer version n the very next idea post. *not financial advice*
#Bitcoin is in a bull run!#Bitcoin is in a bull run!
Even if you are exposed to maximum pain, you have to deal with it, not in CRYPTOCAP:BTC bear season!

Bitcoin Technical Breakdown – Bearish Channel in Motionhello guys.
🔻 1. Bearish Channel
Bitcoin is currently respecting a downward-sloping channel with lower highs and lower lows.
Every attempt to break the upper boundary has been met with rejection, confirming bearish pressure.
🔁 2. Retest of Former Trendline
The former ascending trendline (drawn from 2023’s bottom) was broken and recently retested as resistance, failing to flip it back to support.
This retest often signals confirmation of trend reversal.
🧱 3. Critical Support Zone: $62K– FWB:65K
This zone served as a strong accumulation range in the past and aligns with the current downside target.
____________________________
🔮 What’s Next?
Based on this pattern and price behavior:
Bitcoin may continue its bearish descent, following the projected zig-zag pattern in the channel.
The next significant bounce area lies around $64,000, aligning with both volume-based support and previous breakout zones.

The last bullish chance of Bitcoin in mid-term !!BTC is in a Falling Wedge Pattern. This means The Bulls Have Higher Chance To Claim The Trend Than Bears! No Break out Has Happened yet and we shall wait for a Break out But It should Happen Pretty Soon Because there is also a Regular Bullish Divergence On MACD as well! So The Bullish Chance for BTC Is Pretty High and we Shall see a Bullish Movement Up to $100K Pretty Quick!
-BTC is in a Falling wedge Pattern
-No Break out
-(+RD) on MACD
Give me some energy !!
✨We spend hours finding potential opportunities and writing useful ideas, we would be happy if you support us.
Best regards CobraVanguard.💚
_ _ _ _ __ _ _ _ _ _ _ _ _ _ _ _ _ _ _ _ _ _ _ _ _ _ _ _ _ _ _ _
✅Thank you, and for more ideas, hit ❤️Like❤️ and 🌟Follow🌟!
⚠️Things can change...
The markets are always changing and even with all these signals, the market changes tend to be strong and fast!!

BTCUSDT📊 Bitcoin Weekly Analysis – Smart Money Concept (SMC)
On the 1W BTC/USDT chart, we are currently observing a corrective move after a strong bullish impulse. The price is approaching a high-probability demand zone formed between two significant Fair Value Gaps (FVGs):
• 🔹 FVG 3M around $74,000
• 🔹 FVG M around $66,000
🟩 Long Setup Zone:
The area between these FVGs represents a discounted price zone where smart money is likely to step in. This is labeled as a “zone for long position” on the chart.
⸻
🧠 Smart Money Perspective:
• The market is in a retracement phase, targeting inefficiencies (FVGs).
• If price taps into this zone and shows signs of bullish intent (e.g., weekly bullish engulfing, BOS/CHOCH on lower timeframes), we can expect a strong upward move.
⸻
🎯 Mid-to-Long Term Target:
• Based on the current market structure and SMC model, the next major target is $130,000.
⸻
🔐 Risk Management:
• Ideal entry: within the FVG zone
• Stop-loss: below the lower FVG (around $65,000)
• Confirmation: bullish price action on lower timeframes or weekly candle close with strong momentum
⸻
📌 Conclusion:
This setup offers a potential high-reward opportunity if smart money reacts to this discounted zone. Patience and proper confirmation are key.
⸻

WHY XAUUSD IS BULLISH ?? TECHNICAL AND FUNDAMENTALSXAUUSD is currently trading around the key psychological level of 3000, and as expected, price action has just completed a textbook retest of the previous breakout zone. The support level near 2960–2980 has held strongly, giving gold the momentum it needs for the next leg up. Price has reacted with a clear bullish bounce from this demand zone, confirming the structure and setting up for a potential continuation toward the 3100 target.
From a technical perspective, we’re seeing a classic bullish continuation move. The previous impulse to the upside was followed by a correction phase, which respected the support area now acting as a launchpad. This bounce, combined with strong candle formations on the 12H and daily charts, suggests bulls are regaining control. Volume is gradually increasing, aligning with the anticipated breakout from the recent consolidation.
On the fundamentals side, the gold market remains well-supported. Recent macroeconomic data shows inflationary pressures are still lingering, while expectations for Federal Reserve rate cuts later in the year continue to weigh on the US dollar. Geopolitical tensions and increased central bank gold accumulation are adding further demand for safe-haven assets like gold. These drivers remain bullish catalysts as long as uncertainty stays elevated and real yields remain low.
With price holding above 3000 and a strong structure in place, I expect continuation toward 3100 in the near term. This is a high-probability setup supported by both technicals and fundamentals. I’ll be closely watching for higher lows and continuation signals above 3020 for additional confirmation. Risk management remains key, but the market structure strongly favors further upside.

$BTC Retests 50WMA For The First Time in 217 DaysAs expected,
CRYPTOCAP:BTC retested the 50WMA for the first time since September 2024 (217 days ago).
₿itcoin historically has outsized reactions when this happens.

Shorting BitcoinBINANCE:BTCUSDT
Bitcoin put a massive Bearish Engulfing Candle yesterday, with high volume, which is very bearish, and now I’m expecting it to continue to decline.
It also tends to follow the US Indices, which are heading lower.
My target is about 70k, maybe even lower.
Good luck to you

BTC is still bullish!!!🚨 CRYPTOCAP:BTC is dipping hard! 🚨
📍 All eyes on $72,000 — this could be the ultimate buy zone:
🔽 Why this level matters:
1️⃣ Bottom of the blue wedge
2️⃣ Flipped resistance → support
3️⃣ Major demand zone
4️⃣ Classic -34% pullback move
📊 This could be a textbook entry point.
Are you ready to catch the bounce?

Bitcoin Key levels for a tradeBitcoin Key levels for a trade
81k - local swing buy zone
76 - 78k area - swing long zone

$BTC Inverse Head and Shoulders Finally FormedAnd just like that, the Death Cross has formed the right shoulder for the Inverse H & S idea I formed on March 14th
We may sit a bit more downside to retest the 50WMA at $76k for confirmation
If we get a V-shaped recovery tomorrow, this very well could be the bottom for CRYPTOCAP:BTC

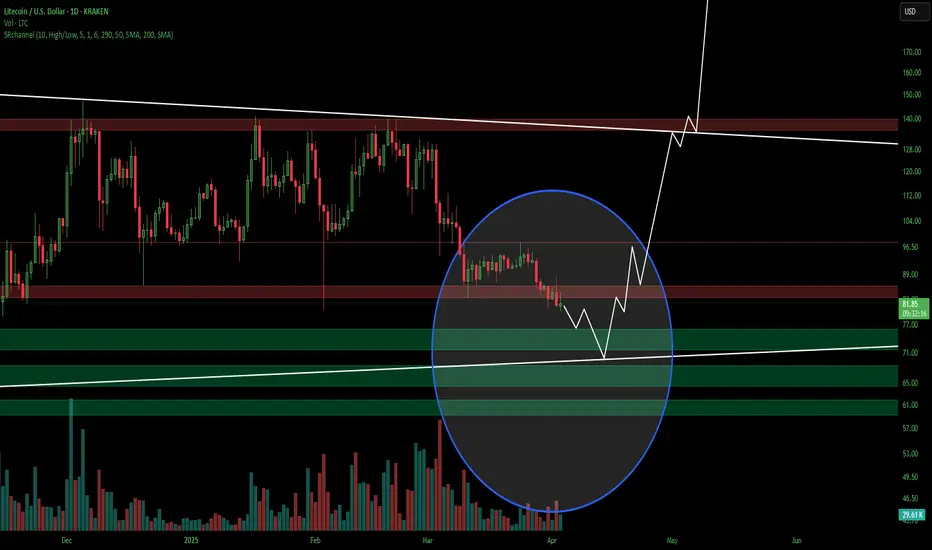
LTCUSD Litecoin OH NO TARIFFS! Everyone SELL NOW!The market reacted to the tariffs negatively as expected. I don't think these tariffs will last long. Countries will cave and remove their tariffs. Bottom line is they need us more than we need them. Once global free and easier trade starts you're going to see a boom cycle like never before. This is the bottom and the beginning of the biggest bull run you'll ever see. I don't get involved in politics but this move that Trump made with the tariffs is going to be a major positive for the USA and the world moving forward. This isnt 1929, we live in a much more advanced world now. Collapses and depressions are a thing of the past in my opinion.
As for Litecoin I see it coming down to test around $70 dollars by the middle of April. This is also timed almost perfectly to the 2017 run Litecoin had, coincidentally trump was starting his first term in 2017 as well. Also timed perfectly to when tax day is over for USA.
Many have capitulated and sold everything thinking a giant recession is coming, or a war, or a collapse, or aliens, or you name it people are scared of their own shadows lately. Like a plague of Grackles where one gets spooked and the whole lot of them get scared and take off when they dont even know why. This is how the markets work though, most will make the wrong decision so the few who made the right decision can profit from their mistakes. Once the market starts to run again those who sold will think its just a fake pump or dead cat bounce and wont buy in. Then the market will continue to rise and rise and finally when its near an all time high those who capitulated and sold early will fomo back in and buy the top to provide liquidity for those who were called crazy for buying the bottom. Its a cycle thats been happening since markets started.
So Im sticking with my predictions for Litecoin, I am not falling for this bear trap crap. Im doubling down. This is not financial advice. This is just my opinion.
BTCUSDT – Short Setup Brewing at FVG with IFVG ConfirmationMarket Context:
Bitcoin (BTC) continues its retracement phase following a sharp decline, now approaching a high-probability reaction zone. Price is climbing back toward a previously identified Fair Value Gap (FVG), positioned within the premium Fibonacci retracement levels, suggesting a potential area for distribution and bearish continuation.
Technical Breakdown:
- Price bounced off a well-defined support zone, beginning a recovery toward the 0.618–0.65 Fibonacci zone, where the FVG exists.
- An additional Inverse Fair Value Gap (IFVG) has now formed just beneath the FVG zone, creating a dual-layer of imbalance—offering even more potential confluence for a reversal.
- A short position idea is highlighted with a trigger condition: **“If the gap inverses, possible short entry”**—meaning traders are looking for the IFVG to act as resistance following the FVG reaction.
Price Behavior & Trade Setup:
The green path illustrates the anticipated move higher into the FVG zone, likely grabbing liquidity above recent highs. Should price tap this supply zone and then reject into the IFVG, it would present an ideal scenario for a short entry confirmation.
Key Considerations:
- The presence of both FVG and IFVG increases the likelihood of strong resistance forming in this region.
- Rejection at this level would imply smart money distribution, and a renewed bearish leg could develop.
- Patience is key here—entry should only be considered if the IFVG confirms its role as resistance following the sweep into FVG.
Conclusion:
BTC is in a critical retracement phase, and the overlapping FVG and IFVG zones mark a high-confluence area to watch. If price shows weakness after filling the gap, it sets up a clean short opportunity targeting a return to lower support levels. Until that bearish confirmation appears, bulls still have short-term control, but risk is growing as price approaches imbalance zones.

BTC Weekly – System Says Wait
BTC closed above the 200 MA — structurally bullish.
But the system remains bearish:
LR < SMA < BB center
PSAR dots above price
No setup confirmed. No rule = no trade.
After a macro-heavy week, BTC is holding, but that can flip fast.
This is where discipline protects you.
You can have the best system, but without the right mindset, it won’t help you.
Discipline is more than following rules — it’s about being in the right state to trust them.
I don’t predict. I follow.
The system keeps me calm, focused, and out of emotional trades.

Bitcoin Holding PRZ Support Lines – Is a Weekend Rebound Coming?First of all, I would like to say that the Trading Volume is generally low on Saturdays and Sundays , so I don't expect the Support Lines and Potential Reversal Zone(PRZ) [$82,340-$82,000 ] to break. Of course, we should always be prepared for any scenario.
Bitcoin ( BINANCE:BTCUSDT ) is moving near the Support lines and PRZ , and with the help of the Failed Falling Wedge Pattern , Bitcoin has declined in the last few hours .
Educational Note : In technical analysis, if a Reversal Pattern fails , it often acts as a Continuation Pattern instead .
I expect Bitcoin to trend upward in the coming hours and be able to reach the targets I have outlined on the chart.
Note: If Bitcoin touches $81,900, we should most likely expect more dumping.
Please respect each other's ideas and express them politely if you agree or disagree.
Bitcoin Analyze (BTCUSDT), 15-minute time frame.
Be sure to follow the updated ideas.
Do not forget to put a Stop loss for your positions (For every position you want to open).
Please follow your strategy and updates; this is just my Idea, and I will gladly see your ideas in this post.
Please do not forget the ✅' like '✅ button 🙏😊 & Share it with your friends; thanks, and Trade safe.

BITCOIN - Price can correct to support area and rise to $86000Hi guys, this is my overview for BTCUSDT, feel free to check it and write your feedback in comments👊
Some days ago, the price moved inside rising channel and then made breakout, reaching upper resistance area.
After that, Bitcoin dropped sharply and entered a flat pattern between support and resistance boundaries.
It tested $82300 support level several times, bouncing from this zone without a clear downward breakout.
Recently, the price again touched the support area between $82300 and $81500 and bounced from this demand zone.
Now BTC trades near the middle of the flat and shows signs of strength after holding a support area.
In my opinion, Bitcoin can rise from current range and reach $86000 resistance level in the next move.
If this post is useful to you, you can support me with like/boost and advice in comments❤️


Bitcoin Faces a "Resistance Lines WALL" – Breakout or Breakdown?Bitcoin ( BINANCE:BTCUSDT ) started to rise as I expected in my previous post and hit all targets . Will Bitcoin continue the upward trend of the past two days!?
Please stay with me.
First of all, I have to say that Bitcoin is facing a Wall of Resistance lines ( intersection of at least 4 Resistance lines ). Do you think Bitcoin can easily break these resistance lines with a single attack?
Bitcoin is trading near the Resistance zone($87,520_$85,840) , Potential Reversal Zone(PRZ) , and a Series of Resistance lines .
In terms of the Elliott Wave theory , Bitcoin appears to have completed Corrective waves . The corrective wave structure in the Ascending Channel is a Double Three Correction(WXY) .
I expect Bitcoin to drop to $85,000 in the first step in the coming hours. The Second target is $84,333 , and if the Support zone($84,430_$83,170) is broken, we should wait for the CME Gap($80,760_$80,380) to fill.
Do you think Bitcoin can break the wall of the Resistance lines, or will it start declining again?
Note: Donald Trump's speeches over the next hours could also affect the market, so trade a little more cautiously during this hour.
Trump’s Speech & Potential Tariffs
In today’s speech, Trump is expected to discuss new tariffs on imports from China, Mexico, and Canada, possibly ranging from 20-25%. If confirmed, this could impact global markets, strengthen the USD, and increase economic uncertainty.
Note: If Bitcoin touches $89,000, we should most likely expect more pumping.
Please respect each other's ideas and express them politely if you agree or disagree.
Bitcoin Analyze (BTCUSDT), 4-hour time frame.
Be sure to follow the updated ideas.
Do not forget to put a Stop loss for your positions (For every position you want to open).
Please follow your strategy and updates; this is just my Idea, and I will gladly see your ideas in this post.
Please do not forget the ✅' like '✅ button 🙏😊 & Share it with your friends; thanks, and Trade safe.
