BTC Weekly Chart Update📉 CRYPTOCAP:BTC Weekly Chart Update
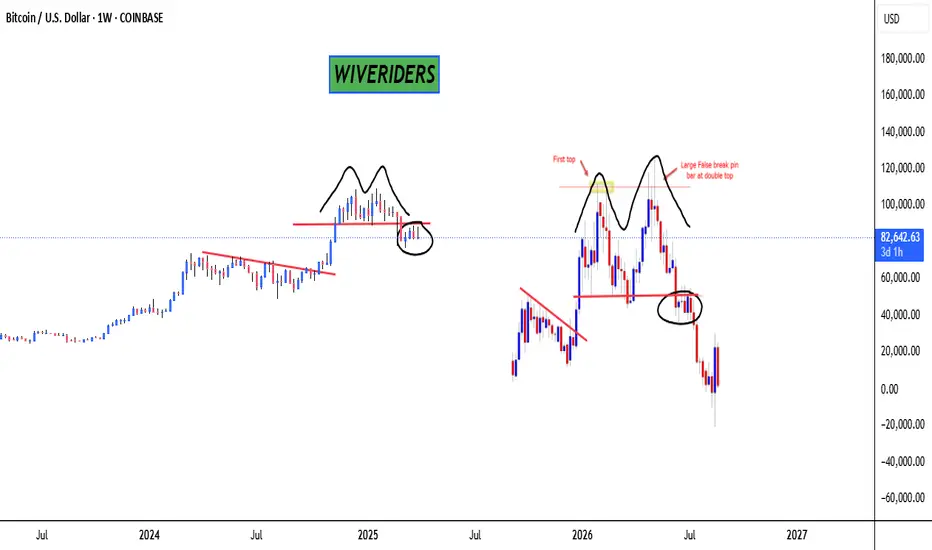
It looks like a double top pattern is clearly forming on the BTC weekly chart — and honestly, doesn't it remind you of a similar structure we’ve seen before? 👀
Patterns like these often signal potential trend reversals, so this is definitely a chart to watch closely.
Do you see the similarity with the previous one? Let me know your thoughts in the comments 👇
🔴 Bearish scenario could continue unless we break above key resistance.
Btc-bitcoin
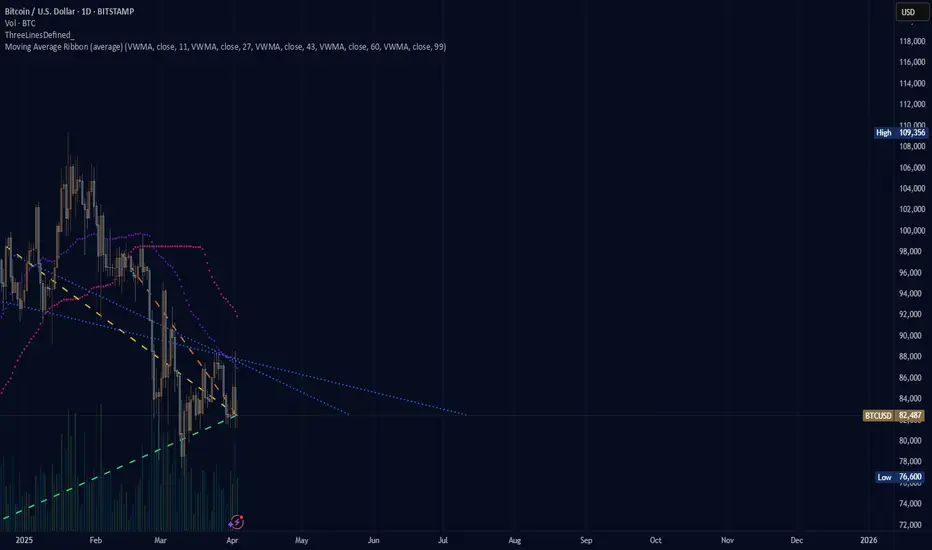
(BTC) bitcoin "the case for bitcoin"Where is bitcoin going to be during this 2025 year. The image shows a blank canvas. The drawing untold, unknown for now? Where will the price move and how long will it take to move through the pattern, bearish? bullish? neutral? fire? ice? greener pastures? The graph showing what is being seen tends to see a rise in price once the price moves past the crossing of the blue lines but the purple and pink dotted lines are facing down with no indication that the price is moving neutrally in a recovery effort.
BTC 4H Technical & Fundamental AnalysisTRUMP EFFECT & RESISTANCE DENIAL
CRYPTOCAP:BTC 4H Technical & Fundamental Analysis
As we expected, Bitcoin reached the upper band of the falling channel (approximately $88,000), touched the red resistance circle and then experienced a strong rejection. The timing of this technical rejection is no coincidence.
Last night, former US President Donald Trump's announcement that he would impose new customs duties on all countries of the world created a risk-off mood in the markets . In particular, global uncertainty and protectionist policies triggered selling pressure in risk assets such as Bitcoin.
Technically:
🔸RSI still has no obvious negative mismatch.
🔸However, since the price cannot break the upper band of the falling channel, this region continues to work as a selling zone for now.
If this retracement movement deepens, the first major support level of $73.777 , followed by the $69.000 line may come to the agenda.
On the other hand, if the price manages to regain strength and break this zone in volume, there may be a rapid movement to the GETTEX:92K - $95K band.
In short, Technical resistance + Trump news effect combined, we can say that the market has stepped back for now. From now on, volume and news flow will be directional.
#btc #Bitcoin #crypto #cryptocurrency

BTC TARIFF TALKAs President Trump steps up on the stage to deliver his tariff plan BTC had a steady price rise going into the talk, a nice HH & HL LTF structure up into range high/ last weeks high, then as the speech began all of the progress made throughout the day wiped in less than 2 hours to reset BTC's price to Tuesdays low.
In the end the news event gave volatility as expected but ultimately the structure remains the same, rangebound. As the Tax year comes to an end it would be a hard ask for this choppy price action to shift bullish when institutions are going to be window dressing their portfolios for the next financial year.
In essence A continued LTF range with an overall HTF bearish trend looks to continue, this is compounded by yet another failed attempt at the 4H 200 EMA which had temporarily been broken but sent back below by the tariff announcements.
The SPX, DJI & NASDAQ Futures pre-market is looks dreadful so a revisit on the range low is probable on the cards at some stage today.
Bitcoin Breaks Resistance – Bullish Flag in Play(Short-term)!!!Bitcoin ( BINANCE:BTCUSDT ) started to rise and pump after '' the Mastercard Plans to Enable 3.5 Billion Cardholders to Transact with Bitcoin and Crypto, " and the US indexes movements and managed to break the Resistance zone($84,380_$83,580) .
Bitcoin is moving near the Monthly Pivot Point and Support lines .
Bitcoin seems to be completing the Bullish Flag Pattern .
I expect Bitcoin to reach the Targets I have outlined on the chart in the coming hours and most likely fill the CME Gap($86,620_$86,565) .
There is a possibility that Bitcoin will fall again after this increase. What do you think!?
Note: The Crypto market is full of excitement. Please pay more attention to capital management than before.
Note: This analysis could be a short-term Roadmap for Bitcoin .
Note: If Bitcoin falls below $83,500, we should expect further declines, possibly heavy declines.
Please respect each other's ideas and express them politely if you agree or disagree.
Bitcoin Analyze (BTCUSDT), 15-minute time frame.
Be sure to follow the updated ideas.
Do not forget to put a Stop loss for your positions (For every position you want to open).
Please follow your strategy and updates; this is just my Idea, and I will gladly see your ideas in this post.
Please do not forget the ✅' like '✅ button 🙏😊 & Share it with your friends; thanks, and Trade safe.


BTC Major Breakout - Symmetrical TriangleBTC is currently trading in a symmetrical triangle. This pattern is indecisive and has a 50/50 chance of breaking to the upside or downside. Meaning in the coming days or weeks, BTC will have a major breakout.
My guess would be to the downside but honestly, the direction wont be clear until it actually breaks out.

Déjà Vu, BTC's Historical Pattern EncoreIt is possible the pattern that shaped in late 2020 and 2021 might repeat again.
Everything just looks like the previous main high which is selected with the red square in the left of chart.
There is no guarantee even if it happens - movement and ratios of movement can be different.
Déjà vu on the charts isn't by chance.

BTC Dominance Breaks Out Altcoins Set to Bleed, Be CautiousHey everyone, let’s dive into this BTC Dominance chart on the 4H timeframe. As you can see, BTC Dominance has just broken out to the upside from a descending triangle pattern, which is a bullish signal for dominance. Currently sitting at 62.633%, it’s testing a key resistance zone around 62.71% (the recent high). If this level holds as support, we could see BTC Dominance push higher toward the next resistance around 64-65%, a zone that aligns with the upper trendline of the longer-term ascending channel.
What does this mean for altcoins ?
When BTC Dominance rises, it typically signals that Bitcoin is outperforming altcoins, often leading to altcoins bleeding in value relative to BTC. The breakout suggests capital is flowing into Bitcoin, likely due to market uncertainty or a flight to safety within crypto. Altcoins could face downward pressure in the short term, especially if BTC Dominance confirms this breakout with a strong close above 62.71%.
Key Levels to Watch
Support: 62.62% (recent breakout level) – if this fails, we might see a retest of 61.5%.
Resistance: 64-65% – a break above this could accelerate altcoin underperformance.
Invalidation: A drop below 61.5% would negate the bullish setup for BTC Dominance and could signal a potential altcoin rally.
Altcoin Outlook
Altcoins are likely to struggle in the near term as BTC sucks up market liquidity. However, keep an eye on major altcoins like ETH, BNB, or SOL for relative strength – if they hold key support levels despite this dominance move, they might be the first to recover when BTC Dominance cools off.
Final Thoughts
This BTC Dominance breakout is a warning sign for altcoin holders. Consider tightening stops on altcoin positions or hedging with BTC exposure. Also don't forget this is NFP Week as well. Let’s see how this plays out over the next few days – stay nimble and trade safe!

CME Gap Target: Is Bitcoin Headed for $80K!?Bitcoin ( BINANCE:BTCUSDT ) is moving in the important Support zone($84,120_$81,500) , and on the 1-hour time frame , Bitcoin is moving near the Support zone($82,360_$82,000) and the lower line of the ascending channel (small) .
Overall, Bitcoin has started another downtrend after breaking the lower line of the ascending channel (big) .
Since trading volume is generally low on Saturdays and Sundays , it is unlikely that the important Support zone($84,120_$81,500) will be broken before the financial markets open .
In terms of Elliott Wave theory , Bitcoin appears to have completed the main wave 3 at $81,644 and is currently completing microwave C of the main wave 4 . The main wave 4 will most likely have a Zigzag Correction(ABC/5-3-5) .
In general, the financial markets and US indices such as TVC:DJI , SP:SPX CME_MINI:NQ1! were not in a good state last week , and this trend will most likely continue next week . The tariffs that Donald Trump is imposing on countries around the world, as well as the turbulent situation in the Middle East , will all lead to the possibility of a fall in Bitcoin and other financial markets in the coming days.
I expect Bitcoin to make at least a temporary increase to $83,200 and then next target the Resistance zone($84,380_$83,580) and the upper line of the ascending channel before starting to fall and attack the important Support zone($84,120_$81,500) and also fill the CME Gap($80,760_$80,380) .
Note: If Bitcoin breaks above the Resistance zone($84,380_$83,580), we can expect more pumping.
Please respect each other's ideas and express them politely if you agree or disagree.
Bitcoin Analyze (BTCUSDT), 1-hour time frame.
Be sure to follow the updated ideas.
Do not forget to put a Stop loss for your positions (For every position you want to open).
Please follow your strategy and updates; this is just my Idea, and I will gladly see your ideas in this post.
Please do not forget the ✅' like '✅ button 🙏😊 & Share it with your friends; thanks, and Trade safe.

BTCUSDT BEARISH RISING WEDGE PATTERN IN 15-MI Created This BTCUSDT Chart Analysis In 15-M Tf
Entry: SELL from 83800
Resistance zone : 83800 / 84100
Target Will Be : 82200
BINANCE:BTCUSDT Make Rising wedge, Probably BTC going downtrend.

btc bullCRYPTOCAP:BTC BULL RUN CONTINUES!
#Bitcoin Corrections are healthy and fuel for the next parabolic run!

BTCUSD: Bollinger squeeze paving the way for $160k.Bitcoin remains marginally neutral on its 1W technical outlook (RSI = 46.017, MACD = 2013.300, ADX = 45.410) and started last week a Bollinger Bands squeeze process. This squeeze has been present inside the 2.5 year Channel Up every time after it bottomed. Only July-August 2024 made a slightly lower low because the squeeze process turned out to be longer. Even in the event, what follows all Bollinger squeezes is an expansion rally, especially after a 1W STOCH RSI Bullish Cross and the pattern shows that by this September, we can reach $160,000.
## If you like our free content follow our profile to get more daily ideas. ##
## Comments and likes are greatly appreciated. ##

BTC Breakout or Breakdown: 83K to 87K or Bust to 73K?BTC’s standing at a fork in the road, and it’s itching to make a move! If it pushes past 83,121, we’re looking at a smooth jump to 84,600—like a quick win you can almost taste. Keep the good vibes going, and 87,000 might just be the big payoff. But hold up—if it stumbles below 81,300, things could get messy. The bears might crash the party, pulling us down to 80K, then 79,900. And if the slide keeps going? We’re talking 74,700, maybe even a rough landing between 73,600 and 73,000.
Kris/Mindbloome Exchange
Trade Smarter Live Better

Can we be optimistic that this will come true?( road to 300k )I might be wrong and this might never happen, but it might come true From a technical perspective!!!
Remmember
Give me some energy !!
✨We spend hours finding potential opportunities and writing useful ideas, we would be happy if you support us.
Best regards CobraVanguard.💚
_ _ _ _ __ _ _ _ _ _ _ _ _ _ _ _ _ _ _ _ _ _ _ _ _ _ _ _ _ _ _ _
✅Thank you, and for more ideas, hit ❤️Like❤️ and 🌟Follow🌟!
⚠️Things can change...
The markets are always changing and even with all these signals, the market changes tend to be strong and fast!!

Bitcoin (BTCUSD) Sell Limit Trade IdeaTRADENATION:BTCUSD Bitcoin has formed a double top pattern, confirmed by a breakdown below 89,199, signalling potential for further downside. Additionally, a bearish flag breakdown in recent sessions suggests continuation lower.
This morning’s gap down highlights market weakness, but a fill of this gap at $83,543 may offer an ideal entry for short positions.
Trade Details
Entry (Sell Limit): 83,543
Stop Loss: 87,992
Take Profit: 70,613
Risk/Reward Ratio: 2.9:1
Key Levels
Resistance:
R1: $83,543 (Entry Point)
R2: $85,819
R3: $88,767
Support:
S1 : 76,590
S2: 70,531
S3: 63,411
Technical & Fundamental Factors
✅ Double Top Formation – Breakdown below 89,199 confirms bearish momentum.
✅ Bearish Flag Breakdown – Indicates continuation of the current downtrend.
✅ Gap Lower – Signals further weakness; gap fill at 83,543 offers a selling opportunity.
⚠️ Smart Money Not Buying – Commercial participants are selling Bitcoin, suggesting a lack of institutional support.
Summary
This setup offers a high-probability short opportunity at 83,543, targeting a move down to 70,613, with a stop at 87,992. The combination of technical breakdowns and weak institutional demand supports a bearish outlook.
Disclosure: I am part of Trade Nation's Influencer program and receive a monthly fee for using their TradingView charts in my analysis.

Bitcoin - Where will Bitcoin go?!Bitcoin is trading below the EMA50 and EMA200 on the four-hour timeframe and is trading in its descending channel. The continuation of Bitcoin’s downward trend and its placement in the demand zone will provide us with the opportunity to buy it again.
The continued rise of Bitcoin will also lead to testing of selling transactions from the supply zone. It should be noted that there is a possibility of heavy fluctuations and shadows due to the movement of whales in the market and compliance with capital management in the cryptocurrency market will be more important. If the downward trend continues, we can buy in the demand range.
Since March 14, inflows into spot Bitcoin ETFs have maintained a positive trend. For seven consecutive days, these ETFs have recorded net capital inflows without any outflows. This marks the first instance in 2025 of such a consistent streak of inflows into Bitcoin ETFs.
The assets under management (AUM) of actively managed ETFs in the United States have surged over the past two years, surpassing $1 trillion—a more than threefold increase. This remarkable growth indicates a rising investor interest in strategies beyond index-based funds.
Bitcoin had an overall positive week, whereas the S&P 500 and global equity markets suffered declines due to ongoing concerns over tariffs and persistent inflation. The S&P 500 closed the week lower, dropping to $5,580—just 1.2% above its recent low from March 13. Meanwhile, despite experiencing pullbacks, Bitcoin remains 9.3% above its previous low of $77,000, recorded on March 10.
Strategy, following its latest acquisition, now holds 2.41% of the total global Bitcoin supply.Given that a significant portion of Bitcoin has either been lost or remains dormant in wallets, this stake represents nearly 4% of the actively circulating supply.
About a month and a half ago, Eric Trump, son of former President Donald Trump, tweeted that it was the perfect time to buy Ethereum. Since that tweet, however, Ethereum’s price has dropped by approximately 35%. This highlights the risk of making investment decisions solely based on endorsements from well-known individuals.
Trump Media & Technology Group, owned by U.S. President Donald Trump, has announced a partnership with the cryptocurrency exchange Crypto.com to launch a range of exchange-traded products (ETPs) and exchange-traded funds (ETFs). This includes a multi-crypto ETF (the first of its kind) and ETPs comprising digital assets and securities from various sectors, including the energy industry. Crypto.com will provide the underlying technology, custodial solutions, and crypto asset management services.
In the second half of March, the cryptocurrency market experienced a significant rebound, reigniting optimism among traders. However, historical analysis suggests that the crypto market often moves contrary to mainstream expectations. When bullish sentiment—such as the phrase “To the Moon”—becomes widespread on social media, it may signal an impending price drop. Conversely, when negative sentiments like “Crypto is dead” or “Bitcoin is a scam” become dominant, this could indicate a potential price surge.
Therefore, investors should pay close attention to market sentiment and exercise caution in their decision-making. Recognizing that markets may move against the prevailing consensus can help in formulating more strategic investment approaches.

bitcoin halving effect#Bitcoin Halving pricing is still in its early stages.
CRYPTOCAP:BTC 2024\2025 bull run is not over!

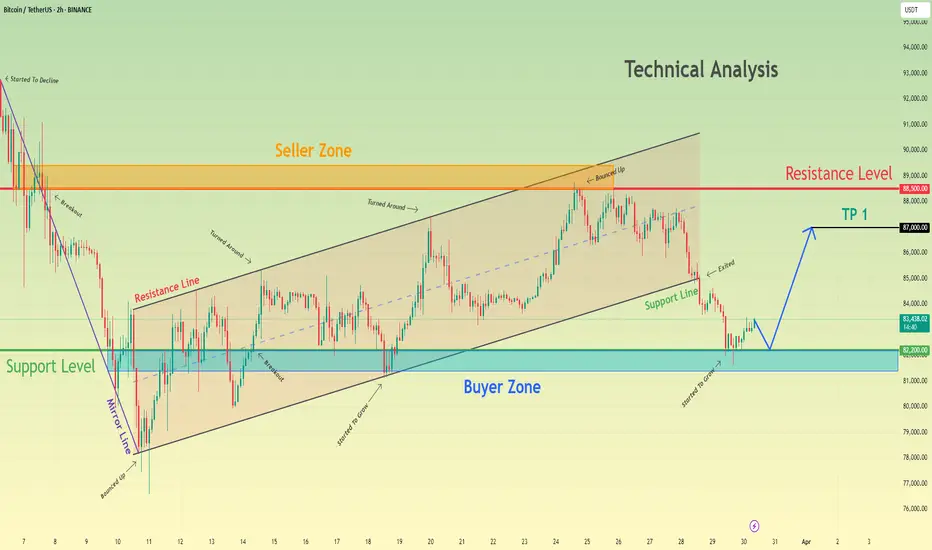
Bitcoin can correct to support level and then continue to growHello traders, I want share with you my opinion about Bitcoin. Looking at this chart, we can observe how the price began to decline around the mirror line and soon reached the 88500 resistance level. After that, BTC attempted to move upward but resumed its decline, eventually breaking below the 88500 level and falling toward the support area, which aligned with the buyer zone. Following this drop, Bitcoin bounced back into the buyer zone and even pushed slightly higher, beginning a steady rise within an ascending channel. Inside this channel, BTC reached the 82200 level and broke through it, made a minor correction, and then continued climbing to the upper boundary of the channel. The price then pulled back to the buyer zone, rebounded again, and returned to the channel’s resistance line before continuing its upward move. Eventually, BTC touched a key resistance level, hovered around it for a while, and then began to decline. Shortly after, the price broke out of the channel and dropped back to the support zone. However, more recently, it has started to rise again. In my view, BTC might first revisit the support area once more before continuing its upward movement. For this scenario, I’ve placed my first target near the resistance level at 87000 points. Please share this idea with your friends and click Boost 🚀
$BTC Death Cross Forming Inverse H & SAs expected, CRYPTOCAP:BTC is rolling over, hopefully to form that right shoulder for the inverse h & s patter to confirm the next leg up.
This dumped is fueled by the impending death cross, which historically marks big reversals, since the cross is already priced in.

Bitcoin 1-Year Pattern- The art of trading lies in analyzing the past to anticipate the future.
On the yearly timeframe, BTC has consistently followed this cycle:
- 1 year of bearish decline.🟥.
- 1 year of consolidation and bottoming out.🟩.
- 1 year of steady growth.🟩.
- 1 year of explosive upward movement.🟩.
based simply on that :
- 2025 is poised to be a breakout year for BTC.
- 2026 should be the next bear market.
- Everything changes, nothing lasts forever, but as a trader, you must stay on course.
- Don't let market noise shake your confidence.
Happy Tr4Ding !

15-Min Bitcoin Setup – Quick Scalping Opportunity?First of all, I must say that this is a short-term analysis in a 15-minute time frame . Please be careful .
Let's take risks while respecting capital management. Be sure to respect capital management.
Bitcoin ( BINANCE:BTCUSDT ) is currently trading in the support zone($84,120_$81,500) , Potential Reversal Zone(PRZ) near the lower line of the ascending channel .
In terms of Elliott Wave theory , it seems that Bitcoin could complete its 5 bearish waves near the lower line of the ascending channel .
Also, we can see the Regular Divergence(RD+) between Consecutive Valleys .
I expect Bitcoin to be able to rise to at least $85,400.
Cumulative Short Liquidation Leverage: $86,397_$85,760
Cumulative Long Liquidation Leverage: $84,262_$83,336
Note: One of the reasons for Bitcoin's decline is the decline in US indices such as CME_MINI:NQ1! , SP:SPX , and TVC:DJI .
Note: If Bitcoin falls below $83,000, we can expect more dumps.
Please respect each other's ideas and express them politely if you agree or disagree.
Bitcoin Analyze (BTCUSDT), 15-minute time frame.
Be sure to follow the updated ideas.
Do not forget to put a Stop loss for your positions (For every position you want to open).
Please follow your strategy and updates; this is just my Idea, and I will gladly see your ideas in this post.
Please do not forget the ✅' like '✅ button 🙏😊 & Share it with your friends; thanks, and Trade safe.

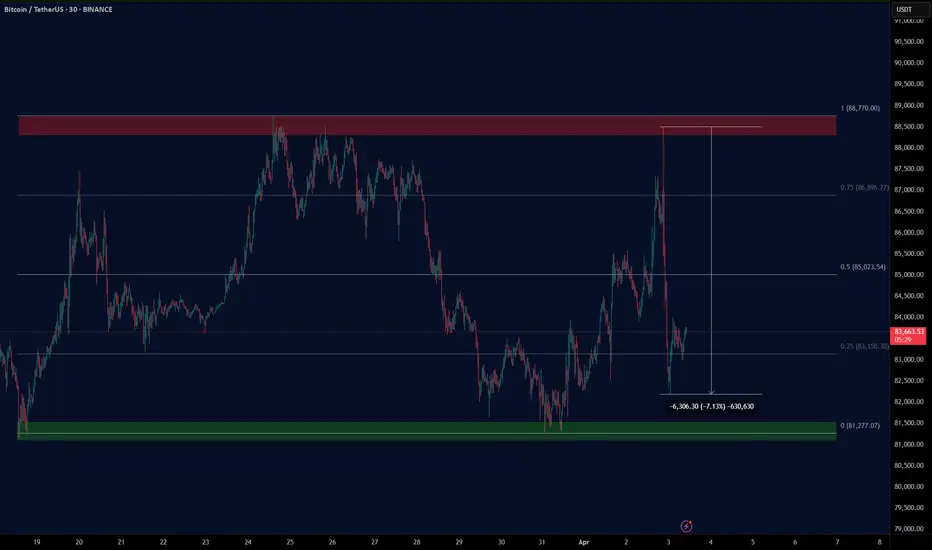
BTC/USDT: Strategic Entry Points for a Potential Bullish ReversaAnalysis of Key Positions in the BTC/USDT Chart
The chart provided shows a 30-minute timeframe for Bitcoin (BTC) against Tether (USDT) on Binance. The chart includes two labeled positions ("Position 1" and "Position 2") that highlight key areas of interest for traders. Below is a detailed breakdown of these positions:
---
1. Position 1
- Location: Near the horizontal green support line, around the $83,600 level.
- Significance:
- Support Zone: This area acts as a strong support level, where the price has previously bounced back after testing it. The horizontal green line indicates that this level has held firm multiple times, suggesting it is a critical zone for buyers.
- Potential Entry Point: Traders can consider entering long positions near this support level if they believe the price will reverse higher. This is a classic "buy the dip" strategy.
- Stop-Loss Placement: To manage risk, traders should place stop-loss orders slightly below this support level (e.g., $83,200–$83,400). If the price breaks below this level, it could signal a continuation of the downtrend.
2. Position 2
- Location: Near the descending blue trendline, around the $85,000–$86,000 range.
- Significance:
- Resistance Zone: The blue trendline acts as dynamic resistance, and the price has been bouncing off this level multiple times. A breakout above this trendline would be a strong bullish signal, indicating that buyers have overcome short-term selling pressure.
- Potential Entry Point: Traders can consider entering long positions after a confirmed breakout above the trendline. A breakout is typically confirmed when the price closes above the trendline on a candlestick.
- Stop-Loss Placement: For safety, traders should place stop-loss orders just below the trendline (e.g., $84,800–$85,000). This ensures that the trade is exited if the breakout fails and the price reverses lower.
---
Comparison Between Position 1 and Position 2
- Position 1 (Near Support):
- Risk Profile: Lower risk, as it is closer to a well-defined support level.
- Reward Potential: Moderate, as the upside target would likely be the next resistance level (e.g., the trendline or Fibonacci retracement levels).
- Strategy: Suitable for traders who want to enter at a cheaper price but are willing to take on some downside risk.
- Position 2 (Near Trendline Breakout):
- Risk Profile: Higher risk, as it requires waiting for a confirmed breakout.
- Reward Potential: Higher, as a successful breakout could lead to a stronger upward move.
- Strategy: Suitable for traders who prefer confirmation before entering long positions.
---
Actionable Insights
1. For Short-Term Traders:
- Entry Strategy: Look for pullbacks to the $83,600 support level to enter long positions. Use tight stop-loss orders below the support to manage risk.
- Exit Strategy: Set profit targets based on Fibonacci retracement levels or previous highs (e.g., $85,000–$86,000).
2. For Long-Term Traders:
- Entry Strategy: Wait for a confirmed breakout above the blue trendline ($85,000–$86,000) before entering long positions. This ensures that the bullish trend is sustainable.
- Exit Strategy: Use trailing stops or take profits at key resistance levels (e.g., $87,000–$88,000).
---
Risk Management
- Always use stop-loss orders to protect against unexpected price movements.
- Consider using position sizing to limit exposure to market volatility.
- Monitor volume and momentum indicators to confirm the strength of any breakout or reversal.
---
Conclusion
The two positions highlighted in the chart provide distinct trading opportunities:
1. Position 1 (Near Support): A potential entry point for aggressive traders looking to buy the dip near $83,600.
2. Position 2 (Near Trendline Breakout): A safer entry point for traders who prefer confirmation before entering long positions near $85,000–$86,000.
By combining these positions with proper risk management and technical analysis, traders can increase their chances of success in the BTC/USDT market.
---
Final Answer: The two positions indicate key trading opportunities:
- Position 1: Near the $83,600 support level, suitable for traders willing to buy the dip.
- Position 2: Near the $85,000–$86,000 trendline breakout, ideal for traders seeking confirmation before entering long positions.
