Bitcoin in coming days ...frankly, Bitcoin will reach $89000 in the coming days.
Give me some energy !!
✨We spend hours finding potential opportunities and writing useful ideas, we would be happy if you support us.
Best regards CobraVanguard.💚
_ _ _ _ __ _ _ _ _ _ _ _ _ _ _ _ _ _ _ _ _ _ _ _ _ _ _ _ _ _ _ _
✅Thank you, and for more ideas, hit ❤️Like❤️ and 🌟Follow🌟!
⚠️Things can change...
The markets are always changing and even with all these signals, the market changes tend to be strong and fast!!
Btc-bitcoin

Bitcoin at Key Resistance – Will Bears Take Control?Bitcoin ( BINANCE:BTCUSDT ) started to rise as I expected in the previous posts .
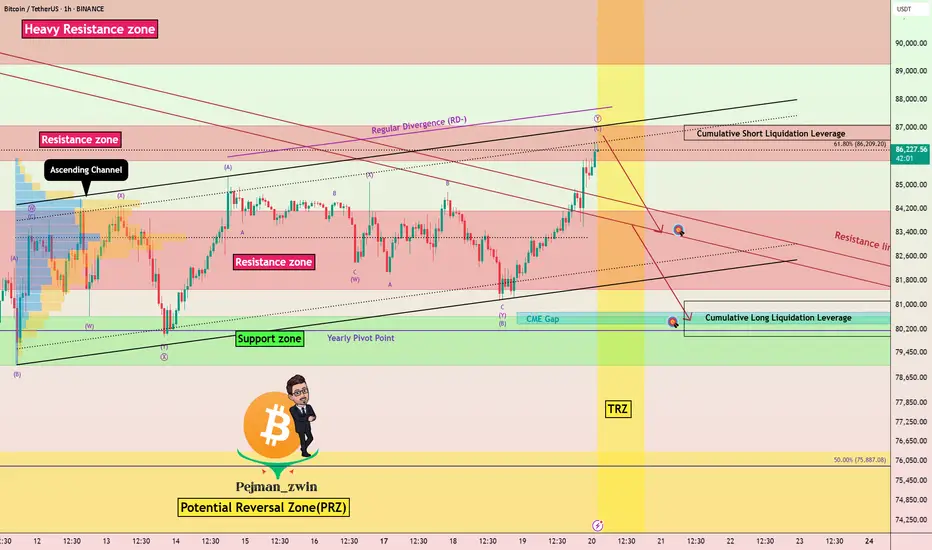
Bitcoin is moving near the Resistance zone($87,100_$85,800) , the upper line of the Ascending Channel , and the Time Reversal Zone(TRZ) .
In terms of Elliott Wave theory , Bitcoin appears to be completing microwave C of the main wave Y .
Also, we can see the Regular Divergence(RD-) between Consecutive Peaks .
I expect Bitcoin to start declining from the Resistance zone($87,100_$85,800) again, the first target could be $83,400 and the second target can be the CME Gap($80,760_$80,380) filling.
Note: If Bitcoin breaks the Resistance zone($87,100_$85,800) we can expect more pumps.
This analysis is in line with the following analysis that I shared with you on the weekly timeframe. 👇
Please respect each other's ideas and express them politely if you agree or disagree.
Bitcoin Analyze (BTCUSDT), 1-hour time frame.
Be sure to follow the updated ideas.
Do not forget to put a Stop loss for your positions (For every position you want to open).
Please follow your strategy and updates; this is just my Idea, and I will gladly see your ideas in this post.
Please do not forget the ✅' like '✅ button 🙏😊 & Share it with your friends; thanks, and Trade safe.
$BTC Battle at 200DMA - Bullish DivergenceThe 200DMA is the real battle for bulls and bears rn.
At least PA is respecting my squiggles 😊
Bullish Divergence is the key here.

The Fed Cuts Balance Sheet Runoff by 80% - BULLISH!RISK-ON 🚨
I’m seeing so many people incorrectly analyzing the September 2019 emergency repo OMOs, which were short-term liquidity injections from the Fed, and then comparing it to the price of BTC going down, before QE officially started in March 2020 because of the pandemic.
Here’s what really happened.
September 15, 2019 was a tax deadline, pulling ~$100B out of markets as large corporations paid the IRS and funds flew into the TGA.
Meanwhile, the Treasury issued new T-Bills to rebuild cash reserves following the post-debt ceiling resolution in August, draining another $50-100B as big banks and institutions absorbed the securities.
During this time, the Fed continued reducing its balance sheet (QT) down to $3.76T, but the balance sheet did not leave enough slack for unexpected cash drains to the system, such as corporate taxes and Treasury issuance.
Unfortunately, the Fed was flying blind and did not have a hard number estimate for “ample reserves” in the banking system.
These reserves were largely hoarded by a few of the larger banking institutions due to Liquidity Coverage Ratio (LCR) rules and a higher IOER at 2.1% vs the ON RRP rate of 1.7% - a 40 bp spread.
This caused a liquidity crisis in the US repo market because bank reserves held at the Fed ($1.36T) were too low and repo lending dried up. Banks weren’t able to access each other’s reserves to fund daily operations.
SOUND FAMILIAR !?
The US just resolved its CR to avoid a government shutdown, and they will be refilling the TGA by issuing new T-Bills. The reverse repo facility is also nearly drained.
Today, we heard the Fed will be reducing its securities runoff from $25B - SEED_TVCODER77_ETHBTCDATA:5B on April 1st, an 80% adjustment.
One of the main drivers is they wanted to get ahead of another 2019-style repo crisis (although they won’t say this), rather than being reactive and having to perform emergency OMOs once again.
Now to go back to my original point with people saying the Fed reducing its balance sheet runoff is a big nothingburger based on BTC price action in 2019.
BTC dumped because of the repo crisis, NOT because markets needed QE.
By early 2020, the liquidity crisis was resolved, and BTC pumped ~45% before the pandemic hit in March and nuked the chart.
Proof is in the pudding - just look at the 2017 bull market.
QT started in October 2017, and the market ripped until early 2018.
The Fed reducing its balance sheet runoff by 80% is definitely a signal of risk-on for educated market participants, as it leaves more reserves in the financial system, which gives banks more liquidity to loan the market.
i.e. M2 go up.
But keep listening to your favorite large accounts who are all of a sudden macro gurus, what do I know 🤓

Bitcoin at the D-Point of a Bullish Gartley – What’s Next?Bitcoin ( BINANCE:BTCUSDT ) is currently trading near the Support zone($80,600_$79,000) and Potential Reversal Zone(PRZ) and Support line .
Bitcoin appears to be completing the Bullish Gartley Harmonic Pattern .
Educational Note : The Bullish Gartley is a harmonic pattern that signals a potential reversal in an uptrend after a corrective move. It consists of five points (X-A-B-C-D) and follows specific Fibonacci retracements, with the D-point acting as a key buying zone.
Regarding Elliott wave theory , Bitcoin is completing the microwave B of the main wave Y .
Also, we can see the Regular Divergence(RD+) between Consecutive Valleys .
I expect Bitcoin to rise at least to Cumulative Short Liquidation Leverage . If the Resistance zone($84,130_$81,500) is broken, we can expect further increases in Bitcoin .
Note: If Bitcoin breaks below the Support zone($80,600_$79,000), we can expect further declines.
Please respect each other's ideas and express them politely if you agree or disagree.
Bitcoin Analyze (BTCUSDT), 1-hour time frame.
Be sure to follow the updated ideas.
Do not forget to put a Stop loss for your positions (For every position you want to open).
Please follow your strategy and updates; this is just my Idea, and I will gladly see your ideas in this post.
Please do not forget the ✅' like '✅ button 🙏😊 & Share it with your friends; thanks, and Trade safe.

Inverse Head & Shoulders in Play – Bitcoin’s Bullish Setup!!!Bitcoin ( BINANCE:BTCUSDT ) touched $84,500 as I expected in my previous post (even higher).
Right now it seems like Bitcoin has managed to break the Resistance zone($84,130_$81,500) and the 200_SMA(Daily) . The formation of the classic pattern , the Inverse Head and Shoulders Pattern , could be a sign that Bitcoin is preparing to break the Resistance zone($84,130_$81,500) .
Another Classic Pattern that we can see on the one-hour Bitcoin chart and hope for an increase in Bitcoin is the Fan Principle at the Bottom Pattern .
Educational tip : The Fan Principle at the Bottom is a bullish reversal pattern where the price forms a series of downward trendline breaks, signaling weakening bearish momentum. As each trendline is broken, buying pressure increases, leading to a potential uptrend.
According to Elliott Wave theory , with the resistance zone broken, we can expect Bitcoin to enter the next impulsive wave , which will likely continue to at least $86,300 .
Also, Today's U.S. economic data release could significantly impact financial markets, including Bitcoin :
UoM Consumer Sentiment : 57.9 (Forecast: 63.1 | Previous: 64.7) – A sharp decline, indicating consumer pessimism about the economy.
UoM Inflation Expectations : 4.9% (Previous: 4.3%) – A worrying increase, which could push the Fed toward a more hawkish stance.
Declining consumer sentiment may pressure the Fed to adopt a more accommodative stance, which is positive for risk assets like Bitcoin.
Rising inflation expectations could increase demand for inflation-hedge assets like Bitcoin.
However, if the Fed sees inflation rising as a concern, they may maintain a tighter policy, which could weigh on markets.
Today's data presents mixed signals, but falling consumer confidence and rising inflation expectations could ultimately fuel Bitcoin's next leg up.
Based on the above explanation , I expect Bitcoin to rise to at least the upper resistance zone($87,000_$85,820) after completing its pullback and complete the mission of filling the CME Gap($86,400_$85,595) . Of course, a CME Gap($80,760_$80,380) has also formed.
In your opinion, has Bitcoin finished its correction or created an opportunity for us to escape again?
Note: If Bitcoin falls below $81,300, we should expect further declines.
Note: If Bitcoin goes above $87,800, we should expect further increases.
Please respect each other's ideas and express them politely if you agree or disagree.
Bitcoin Analyze (BTCUSDT), 1-hour time frame.
Be sure to follow the updated ideas.
Do not forget to put a Stop loss for your positions (For every position you want to open).
Please follow your strategy and updates; this is just my Idea, and I will gladly see your ideas in this post.
Please do not forget the ✅' like '✅ button 🙏😊 & Share it with your friends; thanks, and Trade safe.

$BTC Bitcoin at critical point... Head and shoulder Pattern!CRYPTOCAP:BTC Bitcoin is at a critical point
Current price: 91000
Bitcoin has retraced over 16% from an all time high of 108k, Price action is currently forming a head and shoulder pattern which is usually a bearish pattern!
#btc needs to remain supported around 90.5k to continue its uptrend to all time highs at 119k
If MARKETSCOM:BITCOIN price action loses support at 90.5k then expect prices to retest supports at 85k and then 80k.
Definitely a critical point to watch! What do you think?

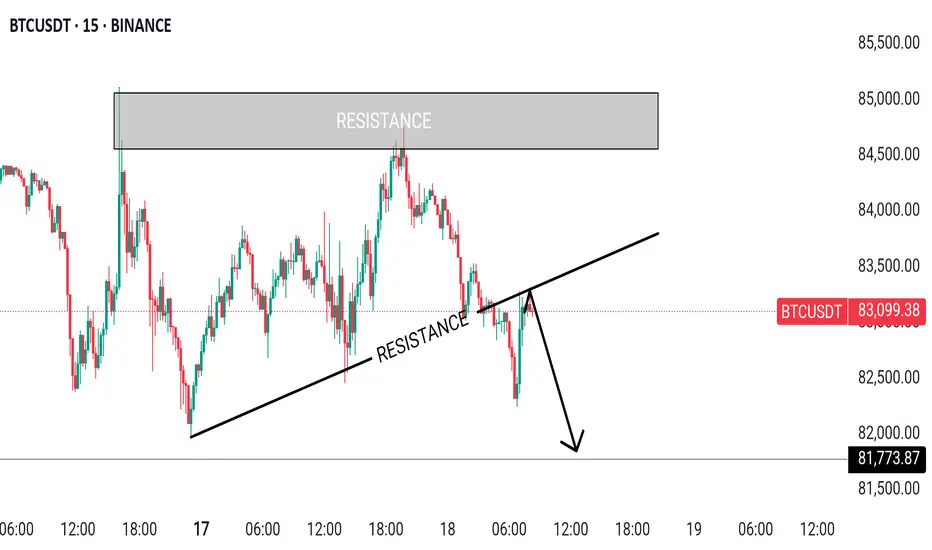
BTCUSDT IN 15-M CHART MAPPINGHello Guys Here Is Chart Of BTCUSDT in 15-M AT
Entry Level: SELL Around 83200
Resistance: 84200
Target Will Be : 81700
BTC Retest below this level, And then it went to more further downside could.
Double down like Michael Chad Saylor - MSTR ----> MSTU 2X"Are you convicted?"
Of Bitcoin achieving a new All time high if so Saylor will greatly rewarded and lauded.
MicroStrategy's unwavering focus on acquiring Bitcoin through unconventional financing methods, rather than building a sustainable revenue-generating business, carries significant risks, especially if a major bear market were to hit the cryptocurrency sector again. This exposure to Bitcoin offers a distinctive investment opportunity for those looking to gain leverage in the crypto space without direct participation.
While MicroStrategy's inherent volatility may deter more traditional investors, it also provides a platform for those eager to engage with market dynamics. The MSTU adds an additional layer of volatility, but unlike options, it does not have an expiration date.
Investors should closely monitor Bitcoin's market fluctuations, as these directly influence MSTR's stock price, potentially creating advantageous entry points for savvy traders.

The current BTC chart, incorporating my 'flash-crash' thesisThis chart illustrates the current Bitcoin pattern, with my 'April flash crash thesis.'
I believe we will see another thrust lower into the green box ranges before a spring into the fifth wave. However, the fifth wave will be a "false breakout," as a flash crash in mid to late April is likely to occur, intentionally designed to sweep liquidity by liquidating overleveraged positions and triggering stop losses—driving price past the previous low set in the green box, only for the market to recover shortly thereafter and continue its breakout to the upside. This breakout will likely push beyond the pattern, taking out the all-time high, and setting a new high somewhere in the 20K to 25K range.
There could be some opportunities in the next 4 to 6 weeks, but with opportunity comes risk. Always use a proper risk management strategy suited to your skill level and wallet size.
Good luck, and always use a stop loss!

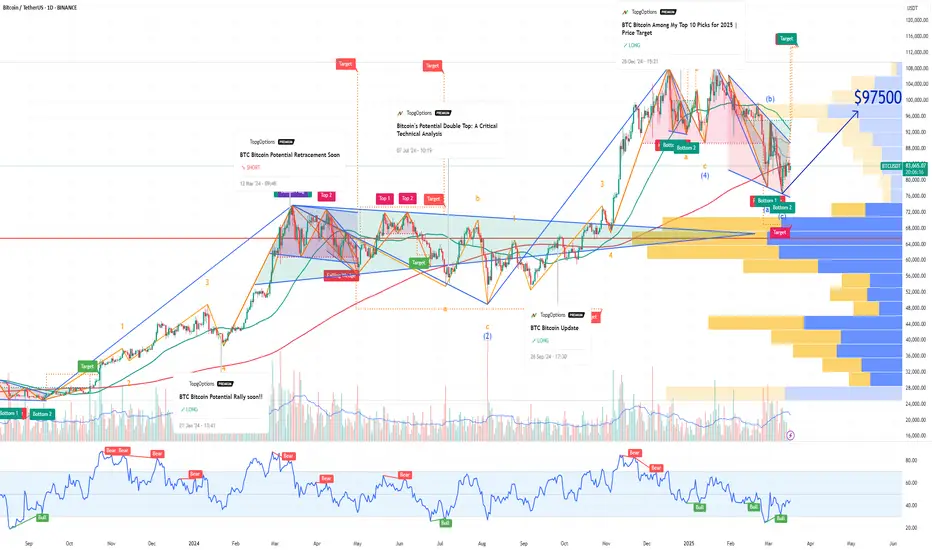
BTC Bitcoin Technical Rebound Despite Whale Short Position !If you haven`t sold this recent top on BTC:
Now Bitcoin (BTC) has recently pulled back, but signs are emerging that a technical rebound could be imminent.
A large crypto investor, or whale, has reportedly opened a 40x leveraged short position for over 4,442 BTC (valued at over $368 million), effectively betting on a near-term price drop. However, this appears to be more of a short-term, low-volume trade rather than a sustained bearish position.
Given the high leverage involved, the whale will likely seek to close the position soon with a modest profit rather than holding it as a long-term directional bet. Weekend trading volumes tend to be lower, which could contribute to short-term price weakness — but once the position is closed, buying pressure could return, fueling a recovery.
From a technical perspective, Bitcoin is currently near key support levels, with momentum indicators like the RSI signaling oversold conditions. Historically, similar setups have led to sharp rebounds as short covering and renewed bullish sentiment drive prices higher.
My price target for Bitcoin is $97,500 by the end of the year, which would represent a recovery of approximately 15-20% from current levels. If the whale closes the short position and broader market sentiment stabilizes, Bitcoin could quickly regain upward momentum toward this target.
Bitcoin (BTC/USDT) – Potential Bullish BreakoutCurrent Market Overview:
Price: $83,295
24h Change: -1.24% (-$1,043.43)
Exchange: Binance (2-Day Timeframe)
Technical Breakdown:
Support Levels:
38.2% Fibonacci Retracement: ~$77,262 – This level has acted as a significant support area.
Trendline Support: Bitcoin is currently bouncing off a key ascending trendline that has been respected since mid-2023.
Major Fibonacci Support: Lower retracement levels at $67,346 (50%), $57,430 (61.8%), and $50,539 (70%) indicate potential deeper corrections if the trendline breaks.
Resistance Levels:
Key Resistance at $106,183 - $109,588: A breakout above this zone could trigger a rally toward new all-time highs.
Psychological Level at $100,000: A critical milestone for BTC that could act as temporary resistance.
Bullish Scenario:
If Bitcoin maintains support above the 38.2% Fibonacci retracement and trendline, a potential breakout above $109,588 could push prices toward $130,000.
The upward projection aligns with historical price action and Fibonacci extensions.
Bearish Scenario:
A break below $77,262 could lead to further downside, with possible retracements to $67,346 (50%) or lower levels like $50,539 (70%).
The long-term trendline breakdown would be a major bearish signal.
Conclusion & Strategy:
Short-Term: Look for confirmation of support at $77,262 before entering long positions.
Mid-Term: If BTC breaks $109,588 with volume confirmation, a bullish rally toward $130,000 is likely.
Risk Management: A drop below $77,000 could invalidate the bullish setup, prompting caution.
🚀 Bullish Outlook Above $109,588 | ⚠️ Caution Below $77,000

BCH: Current SituationYou asked, and we delivered.
Bitcoin Cash (BCH) is trading at $331, a pivotal level that’s acting as a battleground between buyers and sellers. This price sits near a critical support zone, and recent price action shows BCH struggling to push higher amid broader crypto market weakness. The total crypto market cap has dropped by 4.4% in the last 24 hours, putting pressure on altcoins like BCH and fostering a cautious sentiment. Social media buzz, especially on platforms like X, has flagged $330 as a make-or-break level, holding here could spark optimism, while a breakdown might fuel bearish momentum. That said, take these posts with a grain of salt; they’re often speculative and lack the full technical or fundamental picture.
Technical Breakdown: What the Charts Are Saying
Short-Term (1-Hour and Daily Charts)
Support Levels:
Immediate: $330 – A close below this could signal trouble.
Next: $315.58 – A deeper drop might test this level if selling picks up.
Resistance Levels:
Immediate: $339 – A hurdle to watch for any upside push.
Next: $350 – A tougher ceiling that’s rejected recent rallies.
Indicators:
MACD: Bearish crossover, suggesting short-term weakness.
RSI: At 46.40, it’s neutral but leaning bearish, room to fall or bounce.
Moving Averages: Price is below the 20-period MA on the 1-hour chart, a sign of near-term softness.
Pattern: A falling wedge is forming, a setup that could hint at a bullish reversal if BCH breaks above the upper trendline with solid volume.
Long-Term (Weekly and Monthly Charts)
Support Levels:
Key: $300 – A major floor to hold for bulls.
Next: $263 – A deeper correction could target this if $300 fails.
Resistance Levels:
Key: $536 – A 50% Fibonacci retracement level and a big hurdle.
Next: $800 – A long-term target if momentum flips bullish.
Indicators:
200-Day MA: Trending down, reflecting prolonged bearish pressure.
RSI/MACD: Neutral on weekly, with no extreme signals yet.
Pattern: A double-bottom around $300 is worth watching, confirmation could spark a reversal, while a drop below $263 would sour the outlook.
Potential Scenarios: What Could Happen Next?
Short-Term Scenarios
Bullish Case:
If BCH holds $330 and punches through $339 with strong volume, it could climb to $350. A break above $350 might target $380, especially if MACD flips bullish. Look for a volume surge to confirm this move.
Bearish Case:
A close below $330 could trigger a slide to $315.58, or even $300 if selling accelerates. High volume on the drop would lock in bearish control, watch this closely.
Long-Term Scenarios
Bullish Case:
Holding $300 and breaking $536 could kick off a new uptrend, with $800 or higher in sight by 2026. This depends on a crypto market rebound and growing BCH adoption for payments.
Bearish Case:
A sustained fall below $300 might drag BCH to $263 or lower, especially if altcoins stay weak. This would kill the double-bottom setup and point to a longer downtrend.
Broader Context: What’s Driving BCH?
Market Sentiment: BCH’s identity as a scalable, low-fee payment option (thanks to bigger block sizes) keeps it in the game, but it faces stiff competition from other coins and regulatory uncertainty. Adoption is key, more real-world use could lift its value.
Tech Developments: Network upgrades enhancing scalability could boost BCH’s appeal. Watch for news on this front.
External Factors: Crypto prices often dance to macro tunes, think regulatory shifts, US economic data (like inflation), or Bitcoin’s moves. These could sway BCH in either direction.
Practical Tips for Traders and Investors
Risk Management: Crypto’s wild, set tight stop-losses and don’t over-leverage. A stop below $330 for shorts or $315 for longs could save your bacon.
Volume is King: Breakouts or breakdowns without volume are suspect. Wait for confirmation.
Stay Flexible: Markets shift fast, keep an eye on news and adjust your plan as needed.

BTC TRIANGLE CHART PATTERN IN 15-MHello Guys Here Is Chart Of BTCUSDT in 15-M AT
Entry Level: SELL Around 84500
Resistance: The upper trendline of the Triangle 84800
Support: Around below our Target 82000
Target Will Be : 82600
If BTC breaks below this level, the Triangle pattern and,And then it went to more further downside could.

BTCUSD, Are we going to face 35% Correction ?! (Local View)BTCUSD, Are we going to face 35% Correction ?! (Local View)
Let's take a look at local movements on INDEX:BTCUSD .
Since last post Bitcoin moved in our favor, reached 38,500$.
We have a strong bounce here, which is heading towards upper 40s as long as daily close was above big red candle.
There is a probability, that Bitcoin is going to draw lower high which can be anywhere from 38.2 to 61.8 (Golden Pocket) Fib. In confluence we have several magnets at this range.
Possible stop losses around 43,500$
Fair Value Gap around 44,500$. Possible liquidations Across top 3 exchanges (Binance, OKX, Bybit) totaling around 4.0 Bln. USD. (This number covers last 30 Days Data)
Hence we should take into consideration, that huge amount of liquidity is sitting down in the previous reaccumulation zone. (Suggesting to check out Liquidity Heatmap . Putting link because I am not able to add screenshot.)
- - - - - - - - -
Next I want to mention one weird thread I bumped into on Twitter.
It’s about HTX (ex Huobi), which is owned by Justin Sun. They turned off their proof-of-reserves system, what hints about their insolvency. Onchain analysis say that they have problems with ETH holdings.
Also this is not connected to only HTX, things are being wrong with TUSD and stUSDT (Stacked USDT receipt on TRON Network).
For further details about this event please read thread from adamscochran on twitter . Hence there was around 600 Mln. USDT transfer to JustlandDao yesterday.
In the end, I want to mention, that there is no 100% accurate analysis.
We are dealing with probabilities, just with analysis we are shifting probabilities to our favor.
Best Wishes.

Tether Dominance, Weekly OutlookAs we see USDT.D Bounced from long formed Support / Resistance zone, while tested it with long wicks several times.
- RSI Divergence
- Bounced From Support
- Below 21 Week EMA

Bullish Quasimodo in Play – Bitcoin’s Next Target: $84,500?Bitcoin ( BINANCE:BTCUSDT ) attacked the Resistance zone($84,130_$81,500) again as I expected yesterday . Has Bitcoin given up or is it gathering momentum to attack the resistance zone again? What do you think?
Bitcoin is moving near Yearly Pivot Point and Cumulative Long Liquidation Leverage($80,537_$78,390) .
From Elliott Wave theory , Bitcoin appears to be completing an Expanding Flat(ABC/5-3-5) corrective wave .
According to the Price Action , Bitcoin appears to be completing the Bullish Quasimodo Pattern .
Educational Note : The Bullish Quasimodo Pattern is a reversal pattern that signals a potential uptrend after a downtrend. It forms when the price creates a lower low followed by a higher high and a higher low, confirming a shift in market structure.
I expect Bitcoin will NOT leave the CME Gap($86,400_$84,650) unfilled and will rise to at least $84,500 .
What do you think, will Bitcoin leave this CME Gap($86,400_$84,650)?
Note: If Bitcoin falls below $78,800, we should expect further declines.
Please respect each other's ideas and express them politely if you agree or disagree.
Bitcoin Analyze (BTCUSDT), 1-hour time frame.
Be sure to follow the updated ideas.
Do not forget to put a Stop loss for your positions (For every position you want to open).
Please follow your strategy and updates; this is just my Idea, and I will gladly see your ideas in this post.
Please do not forget the ✅' like '✅ button 🙏😊 & Share it with your friends; thanks, and Trade safe.

btc halving CRYPTOCAP:BTC halving pricing is still around 50%, so there is ample room for growth ahead!

M2 GLOBAL LIQUIDITY COMING TO SAVE THE DAYDoes the market look dead?
Wanna know what brings it back?
PRICE.
Wanna know what brings back price?
LIQUIDITY.
Steady lads, deploying more capital 🚢

btc rising trend and ema50CRYPTOCAP:BTC Preparing for Next Run from Weekly rising trend and EMA50 Support!

Bitcoin’s Wild Ride: Up or Down, I’m Watching!Hey there, trading family—just chilling and watching Bitcoin like it’s my buddy on a rollercoaster. It’s hanging out near that FWB:83K spot, and I’m like, “Dude, if you bust through, I can see you tearing up to $120K-$130K—time for a high-five and a snack!” But if you start slipping with those lower lows, no biggie. You might drop to $79,600, then maybe $78,700, $77,000, or even $73,500. I’m just kicking back, enjoying the show—up or down, it’s all good vibes! If you liked this, comment below, boost, or follow—let’s keep the trading love going!
Kris/ Mindbloome Exchange
Trade Smarter Live Better

Follow the trend until it breaks! Bitcoin!Follow the trend until it breaks! Bitcoin!
in a video i shared 2 key areas for short
1st area at 84k -85k as 1st VWAp deviation from ATH
and 2nd area 0.5dev of VWAP form ATH 89k 90k

Bitcoin in a falling wedge / bull pennant It’s hard to say where it will. Break up from ths pennant, I put the dotted measured line in an arbitrary spot which will almost certainly have to be readjusted and most likely further down than where I placed it but if it were to somehow break up from the wedge by then and confirm that breakout the target would be in the 145k zone. *not financial advice*
