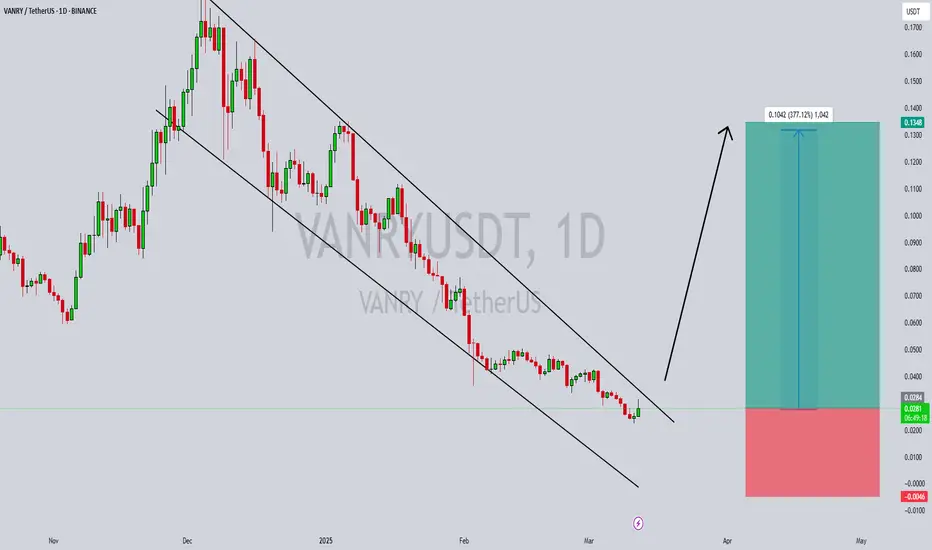
VANRYUSDT Approaching a Breakout from Falling Wedge VANRYUSDT is currently forming a falling wedge pattern, a bullish technical setup that traders are closely watching. This pattern often signals a potential breakout, and with strong volume backing the movement, the chances of a significant price surge are increasing. As the price consolidates within the wedge, buyers are gradually stepping in, indicating growing investor confidence in this project.
The market sentiment around VANRYUSDT remains positive, with investors showing increased interest in its potential. A breakout from this pattern could trigger an explosive rally, with expected gains ranging between 250% to 300%. If the price successfully breaches the resistance, it could initiate a strong uptrend, attracting even more market participants and pushing VANRYUSDT toward higher levels.
With strong volume supporting the price action, traders should keep a close watch on the key resistance level. A confirmed breakout with sustained buying pressure could validate the bullish outlook. As the crypto market remains volatile, proper risk management and technical confirmation are essential before entering a position in this promising setup.
✅ Show your support by hitting the like button and
✅ Leaving a comment below! (What is your opinion about this Coin?)
Your feedback and engagement keep me inspired to share more insightful market analysis with you!
Btc-bitcoin

Bitcoin Tests Resistance: Will the CME Gap Get Filled?Bitcoin ( BINANCE:BTCUSDT ) continued its downward trend as I expected in the previous post , but over the past 12 hours , Bitcoin has started to increase from Potential Reversal Zone(PRZ) . The question is whether this upward trend will continue in the past few hours or not !?
-------------------------------------------------------------------------
JOLTS Job Openings & Its Potential Impact on Bitcoin
The JOLTS Job Openings report will be released today, March 11 . It provides key insights into the U.S. labor market . This data can influence the Federal Reserve’s monetary policy stance , impacting risk assets like Bitcoin.
Potential Impact on Bitcoin :
Higher-than-expected job openings : Signals labor market strength, increasing the likelihood of Fed tightening → Bearish for Bitcoin
Lower-than-expected job openings : Suggests labor market weakness, increasing the odds of rate cuts → Bullish for Bitcoin
Historical Influence :
In previous months, JOLTS data has triggered volatility across financial markets, including crypto. For instance, a sharp decline in job openings last year led to a weaker dollar and Bitcoin rally. Conversely, stronger-than-expected job numbers have reinforced hawkish Fed expectations, pressuring Bitcoin.
I believe there's a higher probability that the JOLTS report will come in weaker than expected, which could lead to a short-term rally in Bitcoin and gold. However, if the report is stronger than anticipated, we might see temporary selling pressure in the market. What is your idea!?
Today's positive news was " Trump Plans Order to End Crypto Banking Restrictions ". In general, Trump's statements no longer affect the crypto market as much as before. Do you agree with me?
-------------------------------------------------------------------------
Now let's take a look at the Bitcoin chart on the 1-hour timeframe and use technical analysis tools .
Bitcoin is moving in the Resistance zone($84,130_$81,500) and near the 200_SMA(Daily) .
According to Elliott Wave theory , Bitcoin has completed five down waves , and we should wait for the next up waves . One of the signs of the end of wave 5 is the presence of a Regular Divergence (RD+) between two consecutive valleys .
According to the above explanation , I expect Bitcoin to re-attack the Resistance zone($84,130_$81,500) after a downward correction and attempt to fill the CME Gap($86,400_$84,200) .
Note: If Bitcoin can move above $87,200, we can expect the start of an uptrend.
Note: We should expect a bigger drop if Bitcoin falls below $72,000.
Please respect each other's ideas and express them politely if you agree or disagree.
Bitcoin Analyze (BTCUSDT), 1-hour time frame.
Be sure to follow the updated ideas.
Do not forget to put a Stop loss for your positions (For every position you want to open).
Please follow your strategy and updates; this is just my Idea, and I will gladly see your ideas in this post.
Please do not forget the ✅' like '✅ button 🙏😊 & Share it with your friends; thanks, and Trade safe.

Bitcoin CME Gap at $77,930 Filled! Now, can $BTC push to $150K?Bitcoin CME Gap at $77,930 Filled! Now, can CRYPTOCAP:BTC push to $150K? 🚀
🔹 Support Level: $75,000 – If it holds, #BTC may target $100K+
🔻 If support breaks, my spot bids: $72K | $69K | $66K (Already filled at $77K ✅)
This drop was a liquidity flush to shake out high leverage traders. Stay prepared!
📢 Where’s your next buy order? Share below! 👇
#Bitcoin

2 Options, Keeping it simpleBTC is currently within its long-term ascending channel but has shown strong rejection at the upper boundary (~$100K).
A pullback toward the mid-channel support (~$70K-$75K) seems likely, aligning with historical retracement patterns.
Indicators Show Weakness:
RSI Divergence suggests a slowdown in momentum.
MACD hints at a potential bearish crossover.
📉 Key Levels to Watch:
Resistance: $95K - $100K (Upper trendline)
Support: $75K (Mid-channel), $60K (Lower trendline)
📈 Scenario 1: BTC consolidates and regains strength for a new ATH attempt.
📉 Scenario 2: A deeper correction to the lower trendline before continuation.
Needs to really break $95k first.

Can Bitcoin reverse its trend?BTC is at horizontal support that can pivot the short-term trend. However, without market structure pivoting and breaking the short-term trend the trend is likely our friend. A confirmed higher low and higher high would build a strong bullish thesis.
Full TA: Link in the BIO

BIGGEST ECONOMIC RESET: BTC!🚨 WHAT IF THE BIGGEST ECONOMIC RESET IS HAPPENING BEFORE OUR EYES? 🚨
We’ve seen governments manipulate markets before, but what if we’re witnessing the most sophisticated financial maneuver in history?
Right now, the U.S. is drowning in historic levels of debt—over $35 trillion—with interest payments soaring to nearly $1 trillion per year. The system is unsustainable. But what if Trump, or whoever is pulling the strings, is playing the ultimate financial chess game? 🎭
🔹 The Playbook:
1️⃣ Crashing Bitcoin from $109K to $60K:
• Market manipulation? Coordinated selling? Whatever it is, we see heavy downward pressure on Bitcoin’s price.
• The Federal Reserve begins lowering interest rates, making money cheaper.
• Institutions, possibly even governments, buy Bitcoin at $60K, accumulating billions—or even trillions—at a discount.
2️⃣ Pumping Bitcoin to $120K:
• After accumulating at low prices, strategic moves (regulatory shifts, institutional adoption, positive media cycles) push Bitcoin up.
• The U.S. government (or key financial players) now holds Bitcoin at twice the original value.
• Instead of selling, they use Bitcoin as collateral to take out new loans at higher valuations—doubling their money on paper.
3️⃣ Paying Off U.S. Debt with Bitcoin Gains:
• Now sitting on a $10T profit, the U.S. (or its financial arms) uses the capital to pay off a significant portion of its debt.
• Trump, or whoever executes this plan, is suddenly praised as the savior of the U.S. economy.
• The media calls it “the greatest financial turnaround in history.”
4️⃣ Dumping Bitcoin Again—Back to GETTEX:25K -$35K:
• After securing profits and lowering debt, Bitcoin is strategically dumped back down.
• The cycle repeats: Buy low, manipulate, sell high, control the financial game.
• The next cycle? 2027. This could be the biggest financial fraud scheme—or the smartest economic move in modern history.
💡 What If This is the Plan All Along?
• Bitcoin-backed national reserves become reality.
• Debt cycles are no longer a problem—they become a trading strategy.
• The Federal Reserve and U.S. Treasury master market cycles instead of fighting them.
• The average investor? Left chasing shadows in a manipulated system.
👀 Sounds insane? Maybe. But in a world where trillions are printed overnight, where governments engineer financial crises and solutions, and where crypto is no longer just “internet money” but a strategic asset, anything is possible.
🔥 What do you think? Is this the master plan, or just another conspiracy theory? Drop your thoughts below!
#Bitcoin #Crypto #EconomicReset #Trump #FederalReserve #DebtCrisis #FinancialManipulation #Markets #Crypto2027


$BTC is literally running the 2016-2017 dynamics!Bitcoin is literally following the 2016-2017 period, which momentum confirms

Bitcoin can fall to buyer zone and then start to growHello traders, I want share with you my opinion about Bitcoin. A while ago, the price entered a downward channel, where it immediately rebounded from the resistance line and dropped to the resistance level, which aligned with the seller zone. After that, BTC bounced back up, rising to the resistance line of the channel before falling to the support line. However, it quickly climbed back to the seller zone before continuing its decline within the downward channel. Later, the price reached the 99000 resistance level, reversed, and dropped to the support level, which coincided with the buyer zone. Eventually, it broke through this level, exiting the downward channel. After that, Bitcoin started trading within a triangle pattern, where it made a sharp upward impulse from the support line to the resistance line, followed by a correction to the 84400 support level. Recently, BTC rebounded from this level and attempted to grow but failed, and now it is trading near the support line of the triangle. In my view, Bitcoin could decline to the buyer zone, breaking out of the triangle pattern before beginning a new upward movement. Based on this, my target is set at 93000. Please share this idea with your friends and click Boost 🚀

Bitcoin, Trump Crypto conference today what to expect?Bitcoin, Trump Crypto conference today what to expect?
i think with bigger chance trap will happens
trend is down
better to follow it until it breaks

Bitcoin - Short after pullbackBitcoin - Short after pullback
price took swing low
at this moment better to creat a pullback and after look for a new short

Bitcoin Forecast by NEoWaveIn the previous analysis, I said that we seem to be in wave-(e) of D. We considered wave-D as a diametric, which seems to have ended with the drop in Bitcoin price and we should consider the diametric to be over and change the labeling a little. Currently, considering what happened, we have two scenarios:
Scenario 1
In this scenario, if the Bitcoin price is maintained above $70,000, there is a possibility of a double combination pattern, the second pattern will probably be a Diametric or Neutral Triangle or a Reverse Contracting Triangle, and wave-D (higher degree wave) will continue. In this case, the price could touch $150,000.
Scenario 2
In this scenario, if the price goes below the key level of $70,000, we should consider wave-D to be over and the price could decline to the range of $49,000-43.00 and wave-E will be completed.

BTC - the path to $72k This trade continues. And started months ago.
BTC is in a deep bear market.
And has more room to run.
$68,600 is now really looking like the 1st stabilization point. There will be rallies in between, but there is a lot of slow grinding pain ahead. Elliot Wave, Murrey Math and Kumar wave being used for the forecasts. Comments always welcomed. Happy Trading.

Best time to Buy BitcoinBitcoin is forming a correction and has scared retailers out of the market, so this could be the perfect momentum to catch before it makes a bigger movement to the upside.

Bitcoin falls amid disappointment with Trump’s crypto policy
Bitcoin fell as investor hopes for a US strategic reserve plan were let down. Rather than accumulating cryptocurrencies, the US government held only its previously seized assets, triggering a price decline. However, large investors viewed the dip as a buying opportunity. Data reveals that whale and shark wallets acquired 5,000 Bitcoin during the downturn, reflecting confidence in the market despite the drop.
BTCUSD tested the 77,500 support level after failing to reclaim the EMA21. The widening bearish EMAs suggest a potential continuation of the downtrend. A sustained recovery and a close above 80,000 could lead to a retest of the next resistance at 82,500. On the other hand, if BTCUSD fails to hold above 77,500, a further drop toward 75,000 may follow.

Bottom Still Not in, Drop could hit low 70kBTC is falling due to markets and investor fear. The Bottom still hasn't travelled the length of the the FVG on the Weekly Chart that will be attractive to smart money and institutional investors
When looking at the Historical Data it shows that the price had a pullback and found resistance at the Weekly 21 day RMA .
Currently that looks like a point where Resistance once again will be established when combined with the FVG on the Weekly, Price will likely fall below and recover to hold the 21d RMA

btc 2017-2025Ignore the noise and donte be shaken, the CRYPTOCAP:BTC run will continue to be as epic and violent as the 2017 run!

Double Top Breakdown & Key Support Level📊 $BTC/USDT Market Update – Double Top Breakdown & Key Support Level
Welcome to today’s analysis! Let’s break down the Bitcoin ( CRYPTOCAP:BTC ) chart, focusing on the double top pattern and key levels.
⸻
🌐 Overview: Double Top Formation & Breakdown
📉 CRYPTOCAP:BTC has formed a double top pattern and has broken the neckline (yellow level).
🔄 Current Scenario:
• The double top pattern suggests a bearish move, with a projected target at the green support level.
• The green support zone aligns with the previous ATH from the last bull run, making it a key area for potential price stabilization.
• If buyers step in at this support, we could see a bounce and possible bullish reversal.
⸻
🔑 Key Levels to Watch
🟡 Neckline (Broken Support): Confirmed breakdown, acting as new resistance.
🟢 Support Zone: Green Level (Previous ATH, potential stabilization area).
⸻
🛠️ Trade Scenarios
📌 Bullish Scenario (Support Holds & Price Bounces Up)
• If CRYPTOCAP:BTC stabilizes at the green support, buyers may step in, leading to a potential recovery move.
• Confirmation of bullish strength could come from a higher low formation at this level.
📌 Bearish Scenario (Break Below Green Support)
• If CRYPTOCAP:BTC fails to hold the green support zone, further downside could occur, potentially testing lower support areas.
• A confirmed breakdown below this level would signal continued bearish momentum.
⸻
📌 Conclusion
CRYPTOCAP:BTC has broken the neckline of a double top pattern, and its projected target aligns with the green support zone (previous ATH level). This area is critical for potential price stabilization—if buyers defend it, we could see a rebound and bullish continuation. However, if it breaks down, further losses may follow.

BTC Time to FLY.As of now according to weekly chart i can see that the Market is on that resistance level of its channel, so what i think here is that the Market will goes according to its history, probability is market will retest 50 MA and will show the new high, after that it will move towards channel's support level.
So According to me, its the best time to be Bullish, or have some spot in portfolio.

BTC Warning Time .As of now according to weekly chart i can see that the Market is on that resistance level of its channel, so what i think here is that the Market will goes according to its history, probability is market will retest 50 MA and will show the new high, after that it will move towards channel's support level.
So According to me, its the best time to be Bullish, or have some spot in portfolio.

BTC HALVING APRIL 2024! 479497$As we approach the impending halving event in 2024, slated to commence in a month, speculation arises regarding its potential outcomes. Historical data provides insights into recurring patterns, yet uncertainty looms regarding whether past scenarios will manifest once again.
We invite your insights:
Do you foresee growth or a departure from traditional trends towards decline?
Your perspectives are welcomed and valued.

Powell’s Speech & Bitcoin’s Decline: Is More Downside Ahead? Today, Fed Chair Jerome Powell is set to speak, and traders should brace for potential market volatility! Given the recent economic data , his tone is likely to be balanced but leaning hawkish .
Why a More Hawkish Powell?
1- Strong Job Market :
Unemployment Rate : 4.1% (Still low)
Non-Farm Payrolls (NFP) : 151K (Decent, but lower than before)
Average Hourly Earnings : 0.3% (Steady wage growth)
This suggests that the labor market remains resilient, which might discourage the Fed from cutting rates too soon.
2- Inflation Still a Concern :
Wage growth and inflationary pressures persist, which means Powell may emphasize keeping rates steady longer to combat inflation.
3- Markets Are Too Optimistic on Rate Cuts :
Investors are heavily betting on rate cuts in 2024, but Powell may push back against these expectations to prevent excessive risk-taking.
Powell will likely maintain a cautious yet hawkish stance to manage expectations. Big price swings are expected across forex, crypto, and commodities—so stay alert! (Of course, this is just a personal analysis).
In addition to Donald Trump , Signs Executive Order to Create Bitcoin Strategic Reserve
Of course, today, we didn't see any strange movement in Bitcoin, and probably, the proverb " buy the rumor, sell the news " was fulfilled.
----------------------------------------------------------
Now let's take a look at the Bitcoin chart on the 1-hour time frame and also take help from technical analysis tools .
Bitcoin ( BINANCE:BTCUSDT ) is in a Heavy Resistance zone($93,300_$89,250) and has started to decline from Potential Reversal Zone(PRZ) .
From a Classic Technical Analysis , Bitcoin appears to move in a Symmetrical Triangle .
According to Elliott Wave theory , Bitcoin has completed the Double Three Correction(WXY) , and we should wait for the next bearish wave .
I expect Bitcoin to attack 200_SMA(Daily) again after breaking the lower line of the Symmetrical Triangle .
Note: Bitcoin is likely to pump more if the symmetrical triangle's upper line breaks.
Please respect each other's ideas and express them politely if you agree or disagree.
Bitcoin Analyze (BTCUSDT), 1-hour time frame.
Be sure to follow the updated ideas.
Do not forget to put a Stop loss for your positions (For every position you want to open).
Please follow your strategy and updates; this is just my Idea, and I will gladly see your ideas in this post.
Please do not forget the ✅' like '✅ button 🙏😊 & Share it with your friends; thanks, and Trade safe.
