BITCOIN WILL BE AT 50-60K THIS YEARMake it simple, BTC need to relax a little this year before going much higher. If BTC goes around 100k would be nice to take profits and wait for new lows... USA stock market is having alot of volatility with Trump, I wouldn't be surprised if we see a -20% drawdown in S&P 500!!
Btc-bitcoin

BTC- bearish divergenceBearish divergence on weekly = more downward movement expected. Trade with care.

Btc correctionsCRYPTOCAP:BTC Healthy Corrections are not the end but the fuel needed for another parabolic run!

ETHUSD (Ethereum)A follow up from this:
Looking at the upmove from the $880 bottom in June'22, it's tough to consider an impulsive count. Since ETH has lagged compared to Bitcoin, the so called Alt season may take much longer than expected. Bitcoin completing it's cycle doesn't necessarily mean the Alt season begins simultaneously.
It will be interesting to watch this in the next few months. If this turns out well, I would expect a very sharp fall in the coming weeks (a noticeable quality in Wave c). However, those levels would give amazing opportunities in Eth and the other few good Altcoins.

BTC Bitcoin Dont Panic Here This Is A Perfect Measured MoveI like the line chart because it filters out the noise and only shows the close prices. As you can see Bitcoin plays out these double top measured moves almost to the T perfectly. I can go back further but I dont need to its fairly similar.
Bitcoin will bounce around here for a bit and come dow to close the 5 day at the measured move around 82k then its back to the races. We're not going to crash, its just getting started. It may wick below 82 but on a closing basis on the 5 day, which has been very accurate in its history, 82k is where the measured move is. Dont fall for the bearish we're gonna crash stuff. Bitcoin has a long way to go before any top.
Not financial advice just my opinion.

Bitcoin & Trump Effect: A Short-Term Pump or Sustainable Rally?Bitcoin ( CRYPTO:BTCUSD ) started to rise as I expected in the previous post , but Donald Trump helped double the momentum of Bitcoin yesterday. But the question here is whether the correction of Bitcoin is over or if this is an increase in the chance of exit.
Bitcoin is trying to break the Heavy Resistance zone($93,300_$89,250) .
According to the theory of Elliott waves , it seems that Bitcoin has succeeded in completing wave 4 and we should wait for wave 5 .
Note : Due to the high momentum of wave 3, it is possible that wave 5 is a truncated wave.
I expect Bitcoin to rise to at least $95,000 in the coming hours. The next target of Bitcoin can be Resistance lines and 100_SMA(Daily) .
What do you think about Bitcoin movement? Time to escape or wait for a new All-Time High(ATH) to be created?
Note: If Bitcoin goes below $89,000, we can expect Bitcoin to decline and the big CME Gap($91,610-$84,830) to be filled.
Please respect each other's ideas and express them politely if you agree or disagree.
Bitcoin Analyze (BTCUSDT), 1-hour time frame.
B e sure to follow the updated ideas.
Do not forget to put a Stop loss for your positions (For every position you want to open).
Please follow your strategy and updates; this is just my Idea, and I will gladly see your ideas in this post.
Please do not forget the ✅' like '✅ button 🙏😊 & Share it with your friends; thanks, and Trade safe.

BTC filled the CME gap and needs support. BTC filled the CME gap and almost retraced to the golden pocket fib level. There is a decent volume gap below before we get more support. This is a critical level for Bitcoin a CHofCH would be ideal.

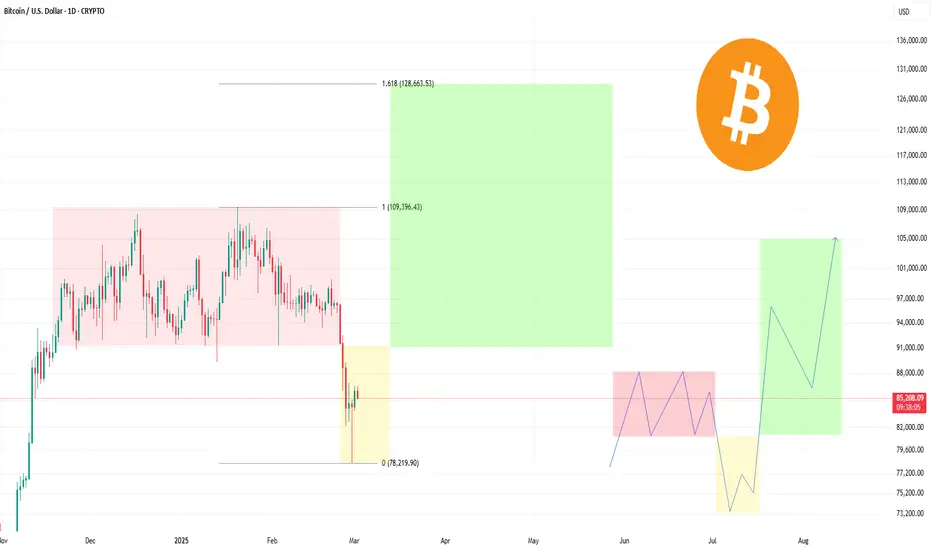
PO3 and Fibonacci: The Path to $128,000I've always been an advocate of analyzing data deeply and finding patterns where others see chaos. And today I want to share my perspective on one of the most exciting opportunities that are taking shape right now.
PO3 is not just an indicator, but a real key to understanding how the market shapes its moves. When you combine it with Fibonacci levels, a unique picture opens up in front of you that gives you a glimpse into the future. This is exactly the case when the data speaks for itself. Now, analyzing the current dynamics, I come to the conclusion that we can expect a significant rise in price to the level of 128,000 dollars. PO3 shows a clear direction and Fibonacci levels confirm the potential for such a move.
So, my prediction: $128,000 is not the limit of dreams, but a realistic goal that we can achieve. And those who understand this trend have a unique advantage.
Alex Kostenich,
Horban Brothers.
$BTC CME Futures Gap - Market Makers Flash Crash to FillI don't think I've ever seen market makers try to fill a CME Gap this fast in the history of CRYPTOCAP:BTC Futures.
I wonder WHY they want to fill it so fast 🧐
HODL ✊


GBPUSD FUNDAMENTALS AND TECHNICAL ANALYSISGBPUSD is currently trading at 1.265, showing strong bullish momentum as it finds solid support at this level. The gradual increase in trading volume indicates growing interest from buyers, suggesting that the pair is gaining strength for a potential move toward the 1.288 target. If this support level holds, we could see further bullish continuation in the coming sessions.
From a technical perspective, GBPUSD is respecting key support, with increasing volume confirming buyer interest. A break above minor resistance levels could further accelerate the uptrend, providing a clear path toward 1.288. If price action remains above 1.260, it will reinforce the bullish outlook, while traders should watch for any pullbacks as potential buying opportunities.
Fundamentally, GBPUSD's strength is influenced by a softer US dollar as expectations around the Federal Reserve’s rate policy shift. Any dovish signals from the Fed or weaker US economic data could push the dollar lower, giving GBP an advantage. Additionally, positive UK economic indicators or a hawkish stance from the Bank of England could further support the pair’s bullish momentum.
In summary, GBPUSD is holding strong support with increasing volume, signaling potential upside toward 1.288. If this bullish momentum sustains, traders could capitalize on the breakout, with confirmation needed through technical signals and macroeconomic developments. Keep an eye on resistance levels and market sentiment for further validation.

Bitcoin - Bitcoin, waiting for another decline?!Bitcoin is located between the EMA50 and EMA200 on the four-hour timeframe and is trading in its descending channel. Bitcoin's downward correction and its placement in the demand zone will provide us with the opportunity to buy it again. It should be noted that there is a possibility of heavy fluctuations and shadows due to the movement of whales in the market and compliance with capital management in the cryptocurrency market will be more important. If the downward trend continues, we can buy in the demand range.
Donald Trump has issued an executive order on digital assets, directing the Presidential Task Force to move toward establishing a strategic cryptocurrency reserve that will include XRP, SOL, and ADA. He emphasized, “I will ensure that the United States becomes the cryptocurrency capital of the world.” Trump further added, “We are making America great again!”
He also highlighted Bitcoin and Ethereum as other valuable digital assets that will be central to this reserve, stating, “I love Bitcoin and Ethereum!” Following this announcement, Bitcoin responded positively to the news of the executive order.
On February 28, BlackRock made headlines after Bitcoin (BTC) dropped below $80,000. Amid speculation, some claimed that the company had sold $500 million worth of Bitcoin, playing a significant role in the price decline.
However, a closer analysis contradicts these claims. Data shows that BlackRock’s iShares Bitcoin Trust (IBIT) still holds 577,919 BTC. While this fund saw an outflow of 2,274 BTC on February 27 and a total of 10,595 BTC over the past week, this does not imply that BlackRock itself is selling Bitcoin.
These ETF outflows result from investors selling shares of the fund. In such scenarios, the ETF is required to sell Bitcoin proportionally to meet liquidity demands. Therefore, these movements are not directly tied to BlackRock’s own decision to offload BTC but rather reflect investor behavior.
Contrary to circulating rumors, BlackRock is not exiting Bitcoin; in fact, it has been increasing its exposure. Recent financial filings reveal that the company now holds a 5% stake in MicroStrategy (MSTR), up from 4.09% in September 2024.
Additionally, it has been announced that BlackRock plans to integrate its Bitcoin ETF into the firm’s $150 billion portfolio. This move suggests that rather than pulling out of the market, BlackRock is strengthening its position in Bitcoin-related assets.
Ultimately, this situation highlights how quickly rumors and speculation can spread during market downturns, but a detailed analysis of the data always provides a clearer picture of reality.
Meanwhile, Ronaldinho, the former Brazilian football star, has announced plans to launch his own cryptocurrency. He also warned his fans to stay vigilant against fraudulent meme coins.

Let's break the range on $MSTR!Exciting news for crypto enthusiasts! A new state strategic reserve for digital assets that features five top cryptocurrencies, with Bitcoin and Ether front and center. Bitcoin, the undisputed heavyweight of the crypto world, saw an impressive 8% surge to about $90,800 following the announcement, NASDAQ:MSTR

$BTC Closes Above WMA20 - Cue Trump Pump 2.0Last time CRYPTOCAP:BTC claimed the WMA20 signaled the US election Trump Pump.
BTC has once again closed above the WMA20.
Cue the Trump Pump 2.0 🚀
(please)

xrpusd H4 Best Level to BUY/HOLD +40% gains🔸Hello guys, today let's review 4hour price chart for XRP. Outlook remains bullish currently pullback in progress, however buying low still is a perfect trade setup with low risk.
🔸XRP is currently in pullback/correction mode after the re-test of ATH.
limited upside at current market price 2.50 usd, pullback not complete.
🔸Recommended strategy bulls: BUY/HOLD 2.00 usd, TP 2.80 USD.
40% unleveraged gains. swing trade setup, patience required. good luck.
🎁Please hit the like button and
🎁Leave a comment to support our team!
RISK DISCLAIMER:
Trading Futures , Forex, CFDs and Stocks involves a risk of loss.
Please consider carefully if such trading is appropriate for you.
Past performance is not indicative of future results.
Always limit your leverage and use tight stop loss.

BTC recovery to 95kToday is the big day and we will likely recover to 95k as early as this week. Mark my words.

Global Liquidity Index \ BitcoinYou are not optimistic enough about CRYPTOCAP:BTC
Global Liquidity Index \ Bitcoin

BITCOIN - Price can start to grow to resistance line of channelHi guys, this is my overview for BTCUSDT, feel free to check it and write your feedback in comments👊
Some days ago price started to decline inside falling channel, where it some time traded near $104600 level and broke it.
Then, BTC declined to the $91000 level, after which it turned around and rose to the resistance line of the falling channel.
Price some time declined near this line and then exited from this channel and tried to grow, but failed.
After this Bitcoin continued to decline in another one falling channel, where it firstly rose to resistance line.
In this channel, BTC broke $91000 level and fell to support line, but recently it bounced and started to grow.
In my mind, Bitcoin can bounce from support line and rise to $90900 resistance line of falling channel.
If this post is useful to you, you can support me with like/boost and advice in comments❤️

BITCOIN → The “90K” door opened a corridor to $75,000BINANCE:BTCUSD is changing its market structure to bearish after the 90K breakout. A deeper correction is forming and in my opinion this is a logical and technically correct structure for a healthy market
I think it is a wrong siutation when the market is only going up and solely due to buying (injecting huge amount of funds on a HYIP).
A bitcoin correction or even a trend reversal can bring a drop of life to this market.
Fundamentally, traders have not waited for any active support for cryptocurrencies from the US as stated in Trump's election campaign. Crypto exchange hacks, scam coins and bitcoin dominance are negatively affecting altcoins.
Bitcoin's current decline and possible drop to 75-73K could give fundamentally valuable altcoins a chance, provided the flagging dominance index also starts to decline. As the simultaneous flow of funds from bitcoin to altcoins and bitcoin's rise from strong support could renew the chances of an altcoin season
Resistance levels: 88150, 90700
Support levels: 75К, 73570, 66830
A small correction to resistance 88.1 - 90.7 is possible before price starts its decline. BTC may try to go deeper, but based on the situation with the market imbalance, lack of driver and support, the price may descend in the medium term and reach the zone of interest and liquidity 75-73.5K.
Regards R. Linda!

Bitcoin Roadmap: Breaking the Broadening Wedge – A Buy Signal?After the tariffs that Donald Trump approved for the European Union and China , Bitcoin ( BINANCE:BTCUSDT ) received a shock with each approval. Otherwise, Bitcoin should have returned to the upward trend, at least in the short term.
Bitcoin seems to have failed to break 200_SMA(Daily) , and most of the time the invalid break is accompanied by the opposite movement of that break with high momentum. Also, Bitcoin seems to have broken the Resistance zone($83,530_$82,250) and is pulling back to this zone .
In terms of Classic Technical Analysis , it seems that Bitcoin has succeeded in completing the Descending Broadening Wedge Pattern .
According to the theory of Elliott waves , Bitcoin seems to have completed five downward waves and we should expect Bitcoin to rise .
Also, we can see the Regular Divergence(RD+) between Consecutive Valleys .
I expect Bitcoin to rise AFTER breaking the upper line of the Descending Broadening Wedge Pattern up to the targets I specified on the chart.
Do you think Bitcoin correction is over?
Note: If Bitcoin goes below the 200_SMA(Daily), expect more dumps.
Please respect each other's ideas and express them politely if you agree or disagree.
Bitcoin Analyze (BTCUSDT), 1-hour time frame.
Be sure to follow the updated ideas.
Do not forget to put a Stop loss for your positions (For every position you want to open).
Please follow your strategy and updates; this is just my Idea, and I will gladly see your ideas in this post.
Please do not forget the ✅' like '✅ button 🙏😊 & Share it with your friends; thanks, and Trade safe.

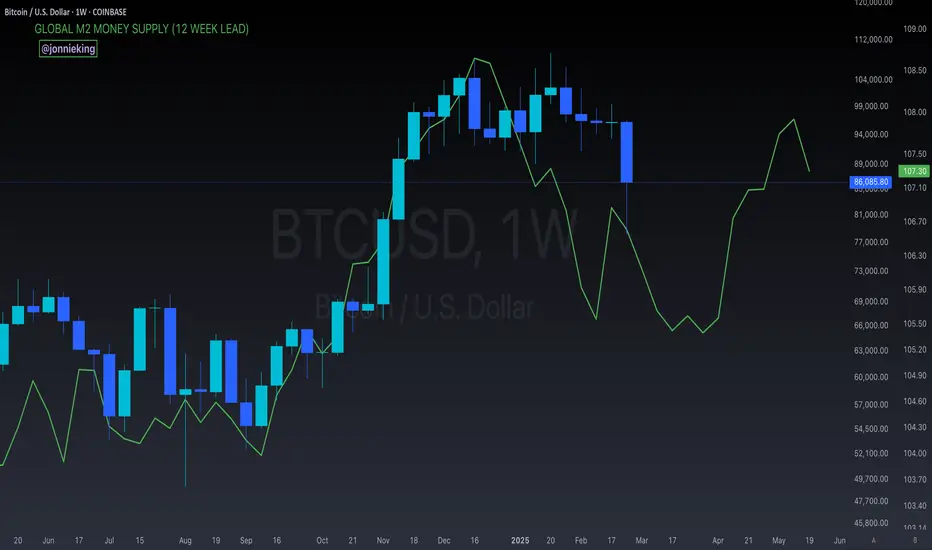
$BTC with Global M2 Money Supply (12-Week Lead)Shows a big liquidity injection coming in early April.
Might be a bit bumpy until then 🎢
Bitcoin parabolic curve Zoom Out CRYPTOCAP:BTC
“Don’t sell your Bitcoin”
Bitcoin parabolic curve is in mega run phase

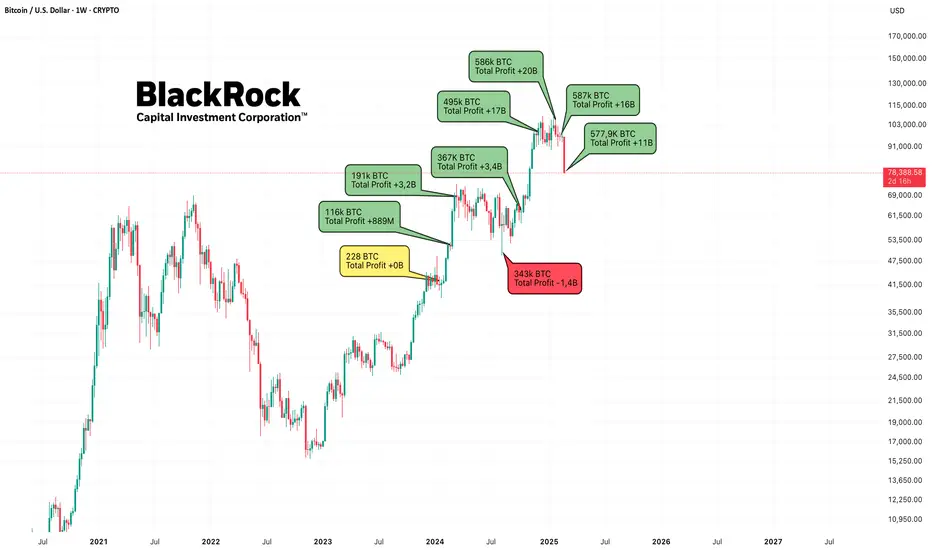
BlackRock & BitcoinA giant's journey into the world of blockchain!
This post highlights how BlackRock's balance sheet and profits have changed since the introduction of the Bitcoin ETF. The data is collected from the Arkham platform. The information will be updated periodically.
28.02.2025
Current balance: 577.9K BTC
Total Profit: +11B USD
This rapid growth underscores BlackRock's confidence in bitcoin's long-term potential and signals a new era of institutional growth. Take a look at the chart to see the trend of balance sheet growth since the ETF's launch. Will BlackRock continue to grow Bitcoins? Share your thoughts in the comments!
Data has been verified through Arkham Intelligence. Updates will follow.
Alex Kostenich,
Horban Brothers.