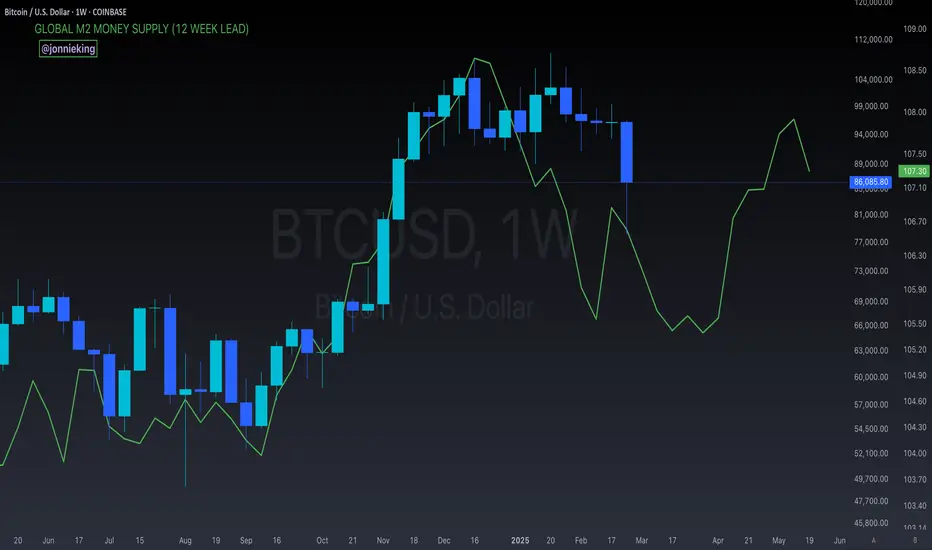
$BTC with Global M2 Money Supply (12-Week Lead)Shows a big liquidity injection coming in early April.
Might be a bit bumpy until then 🎢
Btc-bitcoin
Bitcoin parabolic curve Zoom Out CRYPTOCAP:BTC
“Don’t sell your Bitcoin”
Bitcoin parabolic curve is in mega run phase

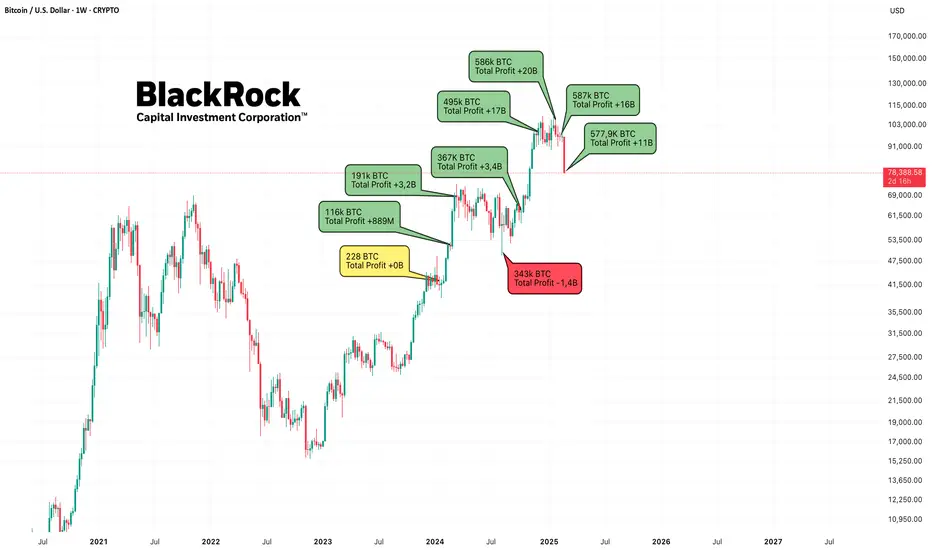
BlackRock & BitcoinA giant's journey into the world of blockchain!
This post highlights how BlackRock's balance sheet and profits have changed since the introduction of the Bitcoin ETF. The data is collected from the Arkham platform. The information will be updated periodically.
28.02.2025
Current balance: 577.9K BTC
Total Profit: +11B USD
This rapid growth underscores BlackRock's confidence in bitcoin's long-term potential and signals a new era of institutional growth. Take a look at the chart to see the trend of balance sheet growth since the ETF's launch. Will BlackRock continue to grow Bitcoins? Share your thoughts in the comments!
Data has been verified through Arkham Intelligence. Updates will follow.
Alex Kostenich,
Horban Brothers.
$BTC Critical Support Retest at 50WMA - Must Read!50WMA is a CRITICAL SUPPORT to watch for ₿itcoin.
Historically, if CRYPTOCAP:BTC closes below it for more than one week, it signals the beginning of the BEAR MARKET.
We’ve only seen BTC close beneath the 50WMA once in its history during a Post-Halving year, and that was in 2021, but then rallied to a new ATH.
People often ask me what would invalidate my bull market thesis;
this is one of them.
I’ll be watching this support very closely, and if BTC closes below it for more than 2 weeks, i’m probably selling a good portion of my stack until we get more clarity in the market.
However, this could very well have been the bottom of this correction.
BTC is known to have a big Q1 drawdown in Post-Halving years.
2013 was a massive -82% correction over a week.
2017 gave us two.
January -34% over 7 days.
March -33% over 14 days.
January 2021 gave us -31% over 14 days.
The current correction we’ve seen with BTC has been the longest over 35 days with -28%.
$75k would be a -31% correction, which would line up perfectly with the previous cycle.
That’s the line in the sand for me.
If we did see the bottom with this 28% correction, that would line up with the diminishing return theory.

Monday Monday la la lala la la...Double Top, Possible Downside
Price currently Below the Mid of the Range
Check Financial Colander for upcoming Events

MicroStrategy $MSTR | MicroStrategy’s Bitcoin Bet Sees 20% DropMicroStrategy NASDAQ:MSTR | MicroStrategy’s Bitcoin Bet Sees 20% Drop Feb28'25
With recent downturns in the crypto market, Bitcoin's sharp drop has significantly impacted companies like MicroStrategy NASDAQ:MSTR , which has heavily invested in crypto. I've kept this analysis updated for my students throughout the week and figured I'd post it publicly.
This is what I would personally look at before entering trades, everything is subject to change on a daily basis and as I analyze different timeframes and ideas.
ENTERTAINMENT PURPOSES ONLY, NOT FINANCIAL ADVICE!
trendanalysis, trendtrading, priceaction, priceactiontrading, technicalindicators, supportandresistance, rangebreakout, rangebreakdown, rangetrading, chartpatterntrading, chartpatterns, spy, btc, bitcoin, mstr, micro, microstrategy, strategy, cryptocurrency, cryptodrop, cryptotrend, memecoins, crypto, digitalcurrency, digitalassets, mstrdrop, btcdrop, bitcoinidea, mstridea, mstranalysis, btcanalysis, cryptoanalysis, cryptotrades,

Remember!Remember guys,
Pay attention to the technicals
Plan ahead
The news is just a distraction
Price is everything

Bitcoin’s Candlestick Pattern- Reversal Signal Confirmed?As I expected in the previous post , Bitcoin ( BINANCE:BTCUSDT ) started to fall with the help of a Symmetrical Triangle Pattern .
Bitcoin is moving near Support lines and the important Potential Reversal Zone(PRZ) .
According to the theory of Elliott waves , Bitcoin seems to have successfully completed its 5 downward impulse waves . One of the signs of the completion of the main wave 5 is the Regular Divergence (RD+) between two consecutive valleys .
Another sign of Bitcoin's reverse can be the Hammer Candlestick Pattern .
Let's take some risks today and swim against the current, but please follow capital management and follow your strategy .
I expect Bitcoin to rise to at least the Heavy Support zone($93,300-$90,500)(broken) after breaking the Resistance zone($88,200-$87,450) .
Do you think Bitcoin can rise to at least $90,000 again?
Note: If Bitcoin goes below $84,500, we can expect more dumps .
Please respect each other's ideas and express them politely if you agree or disagree.
Bitcoin Analyze (BTCUSDT), 1-hour time frame.
Be sure to follow the updated ideas.
Do not forget to put Stop loss for your positions (For every position you want to open).
Please follow your strategy and updates; this is just my Idea, and I will gladly see your ideas in this post.
Please do not forget the ✅' like '✅ button 🙏😊 & Share it with your friends; thanks, and Trade safe.

BTC: Feb2025 UpdateCRYPTOCAP:BTC update
As long as #Bitcoin holds above $74K, the bullish outlook remains valid, and a new all-time high is expected.
However, if the price drops below $74K with high volume—without reaching a new ATH first—it could confirm the start of a bear market.
Once this potential bullish wave concludes, a critical bearish scenario could follow.

BTC CME GAP
- A new gap was created this weekend on the CME.
- BTC's price is higher there, which is typical.
- A gap isn’t always filled; while many do eventually close as prices retrace, it’s never guaranteed.
- This isn’t a price analysis, but rather an alert to monitor the gap.
- I’ll add my previous gap analysis in the comments.
Happy Tr4Ding

Bitcoin's Next Move: Accumulation or Breakdown?The Market at a Tipping Point – What's Next for Bitcoin?
Bitcoin (BTC) is currently trading at $80,594, sitting 26.7% below its all-time high of $109,951 reached just over a month ago. The market is showing signs of uncertainty—traders are caught between a potential accumulation phase and a looming correction.
The Relative Strength Index (RSI) is flashing 38.2, creeping towards oversold territory, while the Money Flow Index (MFI) at 28.2 suggests that liquidity is drying up. With MA50 at 84,015 and MA200 at 92,048, BTC remains below key moving averages, signaling bearish momentum in the short term. But is this really a time to sell—or could this be a golden accumulation zone before the next leg up?
Recent VSA Buy Patterns indicate that smart money could be positioning for an upward move. However, resistance at $84,686 looms overhead, a level that must be reclaimed before bulls can take control. On the flip side, failure to hold above $76,701 support could open the floodgates to lower levels.
So, what’s the verdict? Breakout or breakdown—who’s ready for the next move?
Bitcoin's Price Roadmap: Tracking the Smart Money Moves
The market never lies, but it sure knows how to fake out the crowd. Let's break down the most recent Bitcoin (BTC) price action through the lens of high-impact VSA patterns and volume dynamics, separating the noise from the real moves.
Phase 1: The Sell-Off – Smart Money Setting the Trap?
2025-02-26 18:00 UTC – Sell Volumes Max kicks in, sending BTC downward from $86,002 to $84,112, a clear indication that the big players were offloading before the next major move.
2025-02-28 01:00 UTC – Confirmation: Another Sell Volumes pattern emerges, pushing BTC lower to $81,613. The downward momentum is undeniable. Bears are in control.
Phase 2: A Reversal or a Trap?
2025-02-28 08:00 UTC – VSA Buy Pattern Extra 1st emerges at $79,176, signaling an accumulation phase. The structure suggests a comeback, but we need validation.
2025-02-28 06:00 UTC – VSA Buy Pattern Extra 2nd confirms the recovery as BTC moves up from $79,953 to $80,392, bouncing off key liquidity zones.
Phase 3: Where Are We Now?
Bitcoin's ability to reclaim $80K+ and sustain above the $78K liquidity zone suggests that the market might be done with the shakeout. However, true confirmation lies in breaking $84,686 resistance before bulls can run the show.
The MFI at 28.2 still signals low liquidity, meaning bulls need fresh momentum to confirm a sustainable move.
Key Takeaway: The Next Play
If BTC holds above $80K, watch for a move toward $84K+. If volume dries up, expect another flush before the real pump begins. Either way, the big money has already placed their bets—are you ready?
Technical & Price Action Analysis: Key Levels to Watch
When it comes to Bitcoin, levels are everything—play them right, and you’re in the game. Miss them, and you’re catching knives. Here’s what’s on the board:
📍 Resistance Levels – Where the Heat Is
$84,686 – First roadblock, and where sellers could step in hard.
$92,058.5 – If BTC rips past 84K, this is the next stop.
$94,036.1 – Mid-level supply zone; needs a breakout confirmation.
$96,271.2 – Psychological barrier before the big leagues.
$100,796.4 – The last line before full-on euphoria.
🛠️ Support Levels – Where the Bounces Happen
$76,701.7 – If bulls want a second chance, they gotta hold this.
$67,838.7 – Break this, and we’re talking deeper retrace.
$60,295.6 – Final line of defense before things get ugly.
$47,122.4 – Buyers better show up here.
$28,696.9 – Let’s not even talk about this one…
🚀 Powerful Levels – The True Battlegrounds
Support: $96,262.6 – Bulls want this level back, or it flips to resistance.
Resistance: $76,701.7 – If price reclaims this, expect fireworks.
⚠️ If these levels don’t hold, they flip to resistance. That’s how the market works—fail to bounce, and these same zones become walls for the next run-up. Stay sharp, play the levels, and let the market show its hand.
Trading Strategies Using Fibonacci Rays: Optimistic & Pessimistic Scenarios
The VSA Fibonacci Rays are already on your chart—your job is to watch for price interactions and react accordingly. These dynamic levels are based on the natural flow of price action, not rigid static points. When price meets a ray, it signals either a reversal or continuation, but only after confirmation from volume dynamics and moving averages.
🚀 Optimistic Scenario: Bulls Take Control
If Bitcoin reclaims key resistances and confirms strength via moving averages, we’re looking at a trend continuation.
Long Entry: $80,594 (current market level)
First Target: $84,686 (First resistance break confirms strength)
Second Target: $92,058 (MA200 alignment, momentum builds)
Final Target: $96,271 (Extended breakout zone)
Trigger: A clean bounce from Fibonacci Ray support with rising buy volume. Confirmation via RSI moving above 50 and MA50 flipping upward.
🔻 Pessimistic Scenario: Bears Keep the Pressure
If Bitcoin fails to hold above $76,701, we’re entering a corrective phase with further downside possible.
Short Entry: $76,700 (Break below key support)
First Target: $67,838 (Next liquidity grab zone)
Second Target: $60,295 (Stronger demand area)
Final Target: $47,122 (Capitulation scenario, extreme bear case)
Trigger: A rejection at $80,000–$81,000 on weak volume + failure to reclaim MA50 resistance. Confirmation via RSI below 40 and a bearish cross on MA100 & MA200.
🎯 Key Takeaways for Trade Execution
Always wait for price interaction with a Fibonacci Ray before entering.
Trades run from ray to ray—first target is always the next ray in the sequence.
A bounce from support rays = long setup. A failure to reclaim resistance rays = short setup.
MA50 & MA200 act as trend confirmations—price above is bullish, below is bearish.
Bottom line: The market won’t move in straight lines, but rays act as dynamic waypoints, guiding price through the chaos. Position accordingly.
Got questions? Want to discuss levels, setups, or how to use these insights in your trading? Drop your thoughts in the comments! I read everything and do my best to respond.
If this analysis was useful, hit Boost and save this post—check back later to see how price respects the mapped-out structure. Trading is all about understanding reaction points, and this roadmap lays them out for you.
I use a private indicator that automatically plots Fibonacci rays and key levels—if you’re interested in accessing it, shoot me a message.
Need a breakdown on a specific asset? I can chart it for you. Some analyses I share publicly, while others can be done privately depending on what you need. If you want a custom markup, let me know—we’ll figure out the best way to make it happen.
These rays work across all assets—crypto, forex, stocks, you name it. If there’s a ticker you want analyzed, hit Boost and comment below, and I’ll include it in my upcoming posts.
And if you haven’t yet—follow me on TradingView to stay ahead of the market. Let’s trade smart. 🚀

BTCUSD - Is this a bottom ?- Simple support channel trendline from sep 2023 and aug 2024
- daily rsi oversold like crazy
- 81k3 : 1 fib extension from low 2018 to high 2021 and low 2022
- 79204 : 0.5 fib retracement from low aug 2024 to ATH
- bullish div on lower timeframes
Those are strong bullish supports from high timeframes
watch out for another try from bears like 11 sep 2023 or 6 sep 2024 but I’m expecting more than a bounce from this

UNIVERSOFSIGNALS| Bitcoin Daily Analysis #19👋 Welcome to UNIVERSOFSIGNALS !
Let's dive into the analysis of Bitcoin and important crypto indices. As usual, I will review today's future triggers for the New York session. Today's analysis will be conducted in the 4-hour timeframe, as the 1-hour timeframe does not provide the clarity of price information we need, and the 4-hour timeframe is better suited for today's analysis.
⏳ 4-Hour Timeframe
As you can see, after the price broke through the $95,108 area, we witnessed a significant drop on the chart, with the first bearish leg reaching down to $87,070 and subsequent legs moving to lower areas. Currently, the price has reached the support at $78,940 and has been supported there.
🔍 As you can observe, the volume of the price candles is very high compared to the green candles, which clearly indicates that the market's control is heavily skewed towards sellers.
✨ The RSI oscillator, after forming a Double Bottom in the oversell area and returning to the normal zone, re-entered the oversell zone yesterday, which led to another bearish leg after breaking the $83,779 trigger, which I had previously identified for you, and the price then proceeded to perform its next bearish leg.
💥 Currently, we have positions open from the $95,108 and $92,433 areas, and if you have been following and looking to open more positions, you would have also opened positions upon the breaks of $87,070 and $83,779. Given the sharp market downturn, you would have made a considerable profit by now.
✅ I suggest that if you have open short positions from any of the levels that were breached, to take profits and even close the position because it seems the market has completed its downturn and might start correcting or ranging.
🧩 The range I anticipate the price might oscillate within is between $72,940 to $82,700, but keep in mind that these analyses are my personal opinion, and the price could break the $78,940 area and perform its next bearish leg at any moment. In that case, I would personally open a short position and ensure to have a short position open in case of a break below $78,940.
🔽 Today, apart from this short trigger, I cannot give you another trigger. This short trigger is very risky, and you should open this position with the minimum risk your strategy allows.
👑 BTC.D Analysis
As observed in the 4-hour timeframe, BTC.D is currently forming a smaller box between the areas of 60.48 to 60.91 and continues to fluctuate within this box, so no specific trend can be predicted.
🔑 However, if the area of 60.48 breaks, we can be more hopeful for an altcoin rally, expecting that altcoins might recover some of the ground they have lost because, along with Bitcoin's ranging, Bitcoin dominance has been increasing, and altcoins have been bearish for several months.
📅 Total2 Analysis
Moving on to Total2, as you can see, Total2 was rejected from the crucial area of 1.13, which I mentioned before, and broke the 1.07 area, currently registering a floor at 1.01. This area was not historically significant, and the price has reacted alongside Bitcoin, so we need to see how Total2 moves.
⚡️ If the 1.01 breaks, you can open a short position, which I will also be doing. However, I will open this position only if Bitcoin dominance turns bullish, expecting further declines in altcoins if that happens.
🔼 For a long position, you need to wait until the price forms a new upward structure, and if it moves sharply upwards, you can enter on a break of 1.13.
📅 USDT.D Analysis
As I mentioned yesterday, there was a significant resistance area at 5.45 in USDT.D, where Tether's dominance was rejected from slightly higher at 5.50, and we are seeing a red candle which might indicate the start of a correction and the end of this bullish leg in dominance.
⭐️ The only trigger for a bullish scenario in USDT.D dominance and a market downturn is 5.50, and for a long position and a decline in Tether's dominance, there is no trigger at this moment.
❌ Disclaimer ❌
Trading futures is highly risky and dangerous. If you're not an expert, these triggers may not be suitable for you. You should first learn risk and capital management. You can also use the educational content from this channel.
Finally, these triggers reflect my personal opinions on price action, and the market may move completely against this analysis. So, do your own research before opening any position.

BTC—Bearish Divergence Spotted BTC To Continue Fall?Bitcoin is near the $80k area. After making a high of $109,588 on 20th January, BTC has shown weaken momentum and an indication of plummeting from the peak.
Bitcoin has recently broken its support of the sideways range of $89,427.
Due to global tension and overall economic turbulence, BTC is witnessing a fall.
As per experts, this is a failure of the bull run in BTC.
Using the Relative Strength Index, we can observe the Bearish Divergence on BTC.
The next possible level for BTC to halt is near $73,690.
Let's see where BTC takes a halt.
Note: This is not a financial advice but an analysis to explain the current situation of BTC. Kindly consult your financial advisor before investing.

BTC on 6h chart Hello, my dear friends!🫶 I’m so happy to see You here again! I’m especially grateful for Your feedback—some of You mentioned, that were waiting for me and missed me.🥲 Your words truly touched my heart—thank You so much!😊 I’m thrilled to be drawing charts for You once again; every post I share here holds a piece of my soul. Thanks for Your support—it means the world to me!💋
🔴 We’re currently sitting between a major resistance level (a trendline dating all the way back to 2017) and strong support at 72,000.🔴
The price is at a fascinating crossroads: if the 96–94–93 levels hold and the price consolidates there, we could see a climb toward the significant resistance zone (marked by the pink 🟣 dot) at 107–108k. From there, it’ll be crucial to watch closely—if the price breaks through those levels with ease, a rally could be in the cards.🚀
However, if the 96–94–93–92 levels fail to hold, we’re likely in for a deeper correction. In that case, we could see the price drop to the support zones at 86k, or possibly even lower, to 77k–73k.📉
Thank You for being part of this amazing community—it’s a privilege to share ideas and grow alongside You all. No matter what the charts look like, stay focused, stay patient, and keep believing in your abilities. Success belongs to those who persevere.
Always sincerely yours, Kateryna 💙💛

Bitcoin (BTC): Bloody Monday!On smaller timeframes, we can see the true meaning of "Bloody Monday."
Sellers started to sell aggressively, liquidating a lot of buyers who were FOMO-ing near top.
Now this might be just the beginning, as we are looking for the $91K zone to be reached, which will be the next zone where major moves will happen.
So far everything seems decent so let's wait now to see if the Monday candle will close!
Swallow Team

Bitcoin (BTC/USD) Technical Analysis & Trading PlanBitcoin (BTC/USD) Technical Analysis & Trading Plan – February 28, 2025
Market Overview
The Bitcoin (BTC/USD) price is currently trading at $79,770, showing a -0.74% decline in the latest 4-hour candlestick. The chart illustrates a falling wedge trading pattern, which is considered a bullish reversal signal. The price is approaching the lower boundary of the wedge, signaling a potential breakout to the upside.
Technical Indicators & Key Observations
Falling Wedge Pattern:
The price has been making lower highs and lower lows within a falling wedge formation (red and green trendlines).
A breakout above the upper boundary of the wedge could trigger a strong bullish rally.
Support and Resistance Levels:
Immediate support: $76,665
Major support: $67,679
Key resistance levels:
$88,671
$91,271
$95,497
$108,329 (Major long-term resistance)
Momentum Indicators:
RSI (Relative Strength Index): 22.26 (oversold), indicating potential upward momentum.
Stochastic Oscillator: 16.14, also in the oversold region, confirming a possible reversal.
Money Flow Index (MFI): Showing weak inflow, but a reversal at these levels could indicate increasing buying pressure.
Cipher_B Divergences: Potential bullish divergence forming, adding confluence to the breakout scenario.
Professional Trading Plan
Entry Strategy
Aggressive Entry: If Bitcoin closes a 4-hour candle above the wedge's upper trendline (~$80,500), an early entry can be considered.
Conservative Entry: Wait for confirmation above the $82,000 level with strong volume before entering a long position.
Profit Targets
First Target: $88,671 (previous local high)
Second Target: $91,271 (psychological level)
Third Target: $95,497 (strong resistance)
Ultimate Target: $108,329 (major long-term resistance)
Stop-Loss Strategy
For aggressive traders: Below $76,500 (recent low)
For conservative traders: Below $74,000 to reduce risk exposure
Risk Management
Risk-to-reward ratio: 1:3 or higher (entry should be calculated to maintain proper risk-reward)
Position Sizing: Allocate 2-5% of capital to this trade, considering volatility.
Conclusion
Bitcoin is currently trading at a critical support level within a falling wedge. The RSI, Stochastic, and MFI indicators suggest oversold conditions, indicating a potential bullish breakout. Traders should watch for a confirmed breakout above the wedge with strong volume before entering a position. Targets remain between $88,000 and $108,000, with well-defined stop-loss levels to minimize risk.
💡 Recommendation: Monitor price action closely, especially in the next few 4-hour candles. If BTC breaks above the wedge, prepare for a bullish move towards resistance levels.

Bitcon currently filling the CME futures gapWe knew it was likely this would happen at some point in the near future from when the gap was formed and it appears like now is the time. Price action needs to dip as low as $77,920to fill the gap entirely. History tells us the correction should be over with not long after the gap is filled. The only way this isn’t the case is if the top of the bull market was indeed already in, which is a very minute probability but not impossible. *not financial advice*

(BTC) bitcoin "its nothing"People are wasting their time with bugging out about the price of BTC losing. It's nothing. The price lost like -12%. If someone bought at the peak the price is down like -25%. Compared to all the super inconsistent tokens, memes, and thought bubbles of people creating small and micro cap strategies behind cryptocurrency others. Cryptocurrency has a problem with all the ideas following the movement and price of BTC. Either the people who invest in BTC are also heavily invested in alt coins, tokens and memes, or the real truth; there is no way large institutional banks are invested in most of the tokens. Tokens should not be so easily knocked down. How many years are we going to see the inconsistency of tokens and alt coins before the world of cryptocurrency investors remove the framework where people tend to believe BTC controls the prices and movements of all cryptocurrency. BTC lost a tiny amount compared to the larger losses continually accruing by miniscule cryptocurrency market caps.

Will the bitcoin bloodbath send prices below its 200-day SMA?Currently lower for a sixth day, bitcoin futures have just tested the 200-day average for the first time this year. This clearly marks a pivotal moment for bulls and bears over the near term, but we also have to factor in the higher timeframes.
Matt Simpson, Market Analyst at City Index and Forex.com

BTC - UPDATE - new low and head to the $72 - 73k targetThis BTC move has been long in the works. See previous charts. New low today after a brief respite to $87,000 as forecasted yesterday. $72k - FWB:73K is the buy zone. Murrey Math, Elliott wave, Kumar wave in effect.

$BTC sideways for now, long-term uptrend intactI’m waiting for CRYPTOCAP:BTC to tap 102k again, or for the yearly open at 93k. Not much happening at the moment, but I see it moving higher.
Most likely, we’ll trade within January’s candle and form an inside bar. The inflection point will be at the extremes of that candle for short-term trades. If it decides to break January’s low, I’d see that as a potential re-entry point.
So, in short:
Continuation above 102k
First possible entry at the yearly open (I think many are watching that area)
Second entry at January’s low (optimal for me)
For now, it’s just consolidation.

BTC At Critical Support on 200DMA + RSI Way Oversold₿itcoin testing critical support on the 200DMA 🚨
Last time it closed under on July 4, 2024 it ranged for 101 days.
RSI hasn't been this oversold since August, 2023.
Last time BTC was at this RSI level and closed under the 200DMA it ranged for 60 days.
HOWEVER, the only time BTC has ever closed under the 200DMA on a Post-Halving year was in May 2021, where it then went on to rally to another new ATH.
I'm personally buying here 💯
