BTC touches $80,500 - and heading lowerBTC has touched $80,500 this morning. For anyone thinking its a buying opportunity, best to let the market sell off. There will be lower prices ahead. $73,500 - $72,500 is my 1st support area, but this is by no means the lowest prices possible. Not by any stretch. We have a lot of time to work off this sell off, and plenty of room for lower prices, and lots of missing support. Murrey Math, Elliotwave, and Kumarwave being used for analysis. Posts, comments, and DM's are always welcome. Good Luck.
Btc-bitcoin

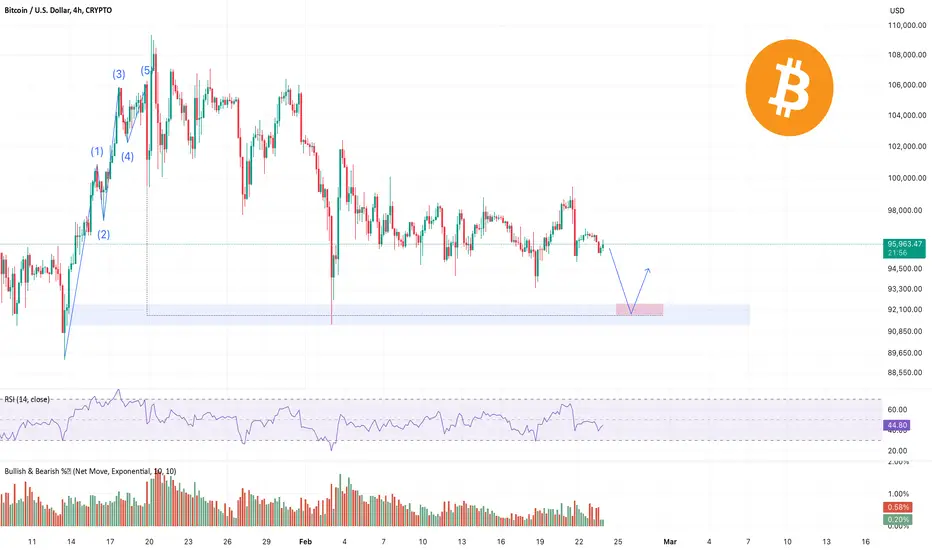
#BITCOIN #BTC 4HAccording to the chart and Elliott wave counting, wave 4 of 5 is likely to have formed as a flat, and according to Fibonacci, we are probably at the end of this correction and we can expect to move towards a new high from this point.

Bitcoin - time to take SL of sellers Bitcoin - time to take SL of sellers
Price did big SL hunt and heart trap
in most cases price fgo and take their SL

86K is holdingBitcoin (BTC) is currently trading at $87,180, hovering near a key support level at $86,050.99. The price recently broke down from a rising wedge pattern, a bearish setup that often hints at further declines. That said, if buyers defend the $86,050.99 support, we could see a bounce toward the 50-hour moving average (MA) around $88,519, with a potential stretch to the next resistance at $96,177.18. On the flip side, a break below $86,050.99 with solid volume might send BTC tumbling toward $84,000. These levels are your guideposts... support acts like a floor, while resistance is the ceiling where price often reacts.
Technical indicators are tilting bearish but leave room for a shift. The RSI sits at 39.17, below the neutral 50 mark, showing momentum is soft. The MACD has a bearish crossover in play, pointing to downside pressure. However, BTC is playing with the 50-hour MA, and a strong move above it could turn things bullish. Volume’s holding steady, watch for a spike to confirm any breakout or breakdown. A rebound with rising volume and an RSI above 50 could signal strength, while heavier selling volume would lock in the bearish vibe.
Market sentiment feels cautious, with BTC stuck in a consolidation range between $86,000 and $96,000 lately. External factors like ETF approvals or regulatory news could jolt the market either way, good news might fuel a rally, bad news could deepen the dip. Set alerts at $86,050.99 and $96,177.18 to stay on top of it, and keep an eye on volume for confirmation. Volatility’s up, so protect your trades: use stop-losses below $86,050.99 if you’re long, or above $96,177.18 if you’re short. Wait for the market to tip its hand before jumping in.

BTC Long back to the MeanBitcoin has recently broken out of its prior range, sweeping liquidity below key levels.
This setup presents a potential mean reversion opportunity, expecting price to revert back into the range. The target for this trade is around 96,785.2, aligning with the previous consolidation area.
Key Levels:
Entry: Current price region (~89,310)
Target: 96,785.2 (Mean reversion level)
Stop-Loss: 85,969.9 (Below liquidity sweep)
Trade Execution:
Entry Confirmation: Signs of rejection from the liquidity grab area / MSB on 2h
Risk/Reward: Favorable setup with a good R:R ratio.
Stop Placement: Below the liquidity sweep to prevent early invalidation.
Conclusion:
The market has grabbed liquidity and is now positioned for a move back into the range.
If bullish momentum continues, we expect price to revert toward the 96,000 level.

3 week chart forecasted the drop. Now what for Bitcoin?As per analysis:
Update on this chart that forecasted the drop. If you see my Binance BTC chart you will see both line up with each other's analysis yet they are 2 different types of TA and timeframes.
Now the drop has happened the % we forecast of the minimum 25% is not hit yet. This chart shows in yellow the current amount of % in drop BTC has made so far. The orange is the minimum as per history.
You will see on this chart there are now coloured circles around some candles. These are the times when Bitcoin was in a similar late period of a bull market and the RSI white line went under the yellow RSI line.(not the yellow trendline at 50.21 , the actual moving RSI yellow line).
The price drops are shown for these inside the circles, except for covid crash (red circle).
There are date ranges shown which are from the bottom of these price drops to the top of the bull run. I have put similar date ranges at current bottom and the larger of the 2 goes to mid November which would line up with a normal ending to bull run, making right now similar to the pink circled area.
The red circle is the covid crash and if you look at RSI this is the only time in a bull run that the yellow moving RSI line is on a downward slope. Every other time it is sloping down, we are in a bear market. Now look at the current situation, it is a downward sloping line. This is a slight concern.
Now we wait to see what unfolds on the lower timeframe analysis after this recent drop and check other indicators for a bear market confirmation. For now, we must assume we are still in a bull market, unless there are more signs of a bear market showing.
If still in bull run then these prices are a gift on altcoins. The issue is whether BTC wants to close the gap at 77k area which could potentially trigger the bear market to follow, depending on how long it is down at that price.
If this 3week RSI reclaims the yellow moving RSI line then we know the bull run will continue.

(BTC) bitcoin "head & shoulders, head & shoulders"BTC is not going to fall all the way down. The price is decreasing in price, yes.. Sentiment is not good right now from many points of view. There is more to come from BTC and there is always a strong urge to buy BTC by seekers who are only growing their wallet size holdings of BTC. 'What's in your wallet," the motto made famously by MasterCard, is befitting of BTC even if there are fewer people now that use BTC to make real transactions. The worst of cryptocurrency development over the last two years is in seeing almost no new companies offering a way to pay with BTC. Pay with BTC. Pay with Doge. Pay with XLM. Don't pay with credit cards that leak your identity and lose precious personal information in data breach hacks. The only way to reduce the dark market interests of criminals who sell hacked personal identity information is to use components of finance that resist hackers attempts to steal information from consumers. There is hardly anything that can be purchased using BTC, DOGE, XLM, et al. etc. in the real world.

Bitcoin’s Symmetrical Triangle Breakdown – How Low Can It Go?Bitcoin ( CRYPTO:BTCUSD ) started to fall, as I expected in the previous post ; the question here is whether the fall continues or not .
Today, I want to analyze Bitcoin for you in the 15-minute time frame .
Bitcoin was able to break the Support zone($93,300-$90,500) and important Support line .
Bitcoin also seems to have formed a Symmetrical Triangle Pattern and was able to break the lower line of the triangle.
Educational Tip : The Symmetrical Triangle is a continuation pattern where the price consolidates into a narrowing range with lower highs and higher lows. It indicates indecision, with a breakout in either direction confirming the next trend.
I expect Bitcoin to drop to the targets that I specified in my chart.
Note: If Bitcoin goes above $95,850, we can expect more pumps.
Please respect each other's ideas and express them politely if you agree or disagree.
Bitcoin Analyze (BTCUSDT), 15-minute time frame.
Be sure to follow the updated ideas.
Do not forget to put Stop loss for your positions (For every position you want to open).
Please follow your strategy and updates; this is just my Idea, and I will gladly see your ideas in this post.
Please do not forget the ✅' like '✅ button 🙏😊 & Share it with your friends; thanks, and Trade safe.

Strategy Hit SupportMSTR should easily hold $246 and make its way back up to $418 and form it's next support there.
Good luck!

BTC/USDT Breakdown: Bearish Momentum Ahead?📉 Bitcoin (BTC/USDT) 4H Chart Analysis
🔻 Trend Breakdown:
BTC is in a descending triangle pattern, with lower highs forming resistance.
The price has broken below the trendline, indicating bearish momentum.
📊 Key Levels:
📍 EMA 200 (Red Line): 100,411.25 USDT – Acts as major resistance.
📍 Current Price: 97,815.98 USDT – Trading below the 200 EMA, confirming bearish sentiment.
📍 Support Zone: 95,000 USDT – A retest could occur before further downside.
📍 Target: 89,351.53 USDT – The chart suggests a potential drop to this level.
⚠️ Bearish Signals:
✅ Price rejected from descending resistance.
✅ Below the 200 EMA – Bearish confirmation.
✅ Breakout from the structure, signaling further downside.
💡 Conclusion:
If BTC stays below the resistance zone, expect further decline toward 89,350 USDT.
If bulls regain control above 100,400 USDT, trend reversal could happen.
🚨 Trade Caution: Monitor volume and price action near the key support! 🧐

!!! BITCOIN !!! - Bitcoin Target !Hi,
The first recovery zone is at the MA200 line (1D)
It seems like a great opportunity to buy.
This is just an idea.
Be careful!

shortI've been cautioning about a possible downturn ever since the market hit 100k last December. The market has been in a coiling phase, trapping many traders in the process. There's a strong chance Bitcoin might close below 90k today. From here, we could either see a sharp drop to around 75k, or a brief pullback to the 93-94k range before ultimately dropping to 74k.

Bitcoin on 20weekly MAWhat ever bitcoin is doing this week should close weekly candle above 20MA which is about $92000 to stay on bull market

(BTC) bitcoin - updatepreviously, an image with the same template was shared showing a predictive point of view for the price of BTC. Now I am sharing the same template with the current price to compare how the price has changed since first posting using the same graph information.

Bitcoin's Balancing Act: Consolidation, Theft, and Market ForcesBitcoin continues to consolidate in the 90k - 106k area! Recently there was an act of theft from the ByBit cold wallet, resulting in over $1.5 billion worth of ETH being stolen. This is definitely a negative backdrop, we have seen good support from other exchanges and crypto project funders. Theoretically, it would be possible to roll the chain back as Arthur Hayes suggested, but it doesn't seem to be possible, although it would definitely play in favor of the bulls. I would expect a drop to the $91800 area for several reasons:
1. Bear dominance. This can be seen in the bullish and bearish volume indicator. Bullish volumes have fallen while strong sales volume growth is noticeable.
2. Elliott Wave Correction
3. BlackRock sold 3,283 BTC before the ByBit hack and has yet to buy more.
4. According to the smart money concept, 92400-91200 is a magnet.
5. Need to liquidate a large number of long positions that gained momentum after leaving the 99k level.
Horban Brothers.
$BTC 2016\2017 - 2024\2025CRYPTOCAP:BTC 2016\2017 - 2024\2025
The 2024/2025 local top is still unconfirmed and Bitcoin has a long journey ahead!

JUVUSDT: Descending Channel – 120%-130% Gains on Breakout!JUVUSDT is currently forming a Descending Channel pattern, and it is looking for a breakout in the near future. The Descending Channel is a bearish technical pattern where the price oscillates between parallel descending trendlines, indicating that the price is in a downtrend. However, the pattern often leads to a breakout to the upside once the price clears the upper resistance trendline. With strong volume backing the pattern, the breakout could signal the start of a major bullish move, potentially driving the price up by 120% to 130%+.
The good volume behind the Descending Channel formation shows that the market is actively watching this level. A breakout from a descending channel often leads to a sharp rally, as many traders will jump in once the price breaks through the upper resistance. The growing investor interest in JUVUSDT suggests that the market is becoming more optimistic about the potential upside. This increasing participation could fuel the breakout, pushing the price higher and leading to the anticipated 120% to 130%+ gain.
The potential for substantial gains in JUVUSDT becomes more apparent as the price nears the breakout point. The Descending Channel pattern is typically followed by a reversal, especially when the price breaks through the resistance and gains momentum. If JUVUSDT can maintain strength at these levels and break above the upper trendline of the channel, a bullish phase could begin, driving the price to new highs. With the increasing volume and investor interest, the projected 120% to 130%+ gain is within reach.
Traders should monitor the price closely as it approaches the resistance trendline, looking for confirmation of the breakout. A successful breakout above the Descending Channel could result in a swift upward movement, providing significant returns for those who position themselves ahead of the move. The combination of a clear technical setup, strong volume, and growing investor interest makes JUVUSDT a prime candidate for those seeking high-potential trades.
✅ Show your support by hitting the like button and
✅ Leaving a comment below!
Your feedback and engagement keep me inspired to share more insightful market analysis with you!

Bitcoin's Final SurgeBitcoin’s been loitering in distribution for 3 months — like a bloated whale carcass washing ashore. Altcoins? Down 50% or more in the same stretch. They’ve juiced Bitcoin’s price, gutted the alts, and pocketed the spread. Next up: BTC’s final lurch to 120k, dragging those discounted alts along for the ride. Clock’s ticking — 193 days left in this cycle, give or take. Big fish will pile in late, right before the cliff, then dump their alt bags on the crowd. Same game, different year.
Horban Brothers.

Bitcoin Breaks Uptrend line– Is a Crash Coming?As I expected in the previous post , Bitcoin ( CRYPTO:BTCUSD ) started to rise and reached the upper areas of the Resistance zone($100,520-$97,260) .
Bitcoin is moving in the Resistance zone($100,520-$97,260) and has managed to break the Uptrend line .
According to Elliott's wave theory , Bitcoin seems to have finally completed the main wave C .
I expect Bitcoin to attack the Heavy Support zone($93,300-$90,500) and Support lines once again, this is likely to be a heavy drop .
Note: If Bitcoin breaks the Resistance zone($100,520-$97,260), we expect more Pumps.
Do you think Bitcoin can break the Heavy Support zone($93,300-$90,500) or not?
Please respect each other's ideas and express them politely if you agree or disagree.
Bitcoin Analyze (BTCUSDT), 1-hour time frame.
Be sure to follow the updated ideas.
Do not forget to put Stop loss for your positions (For every position you want to open).
Please follow your strategy and updates; this is just my Idea, and I will gladly see your ideas in this post.
Please do not forget the ✅' like'✅ button 🙏😊 & Share it with your friends; thanks, and Trade safe.

BTCUSD Daily Inflection Point UpdatePreviously I mentioned the weekly was consolidating, but there is potential for this momentum consolidation to have a breakout leg as momentum shifts and the final emotional price movements are played out. I was too conservative in my price projections; a lot more than I used to be- but there wasn't a whole lot of TA involved- I figured the dollar issues would crop up earlier.
Now that the Fed had pivoted. the yields are creeping back up pushing bitcoin back down. The fed doesn't let on just how dire the situation is- and with global tensions rising, the dollar is at significant risk.
I expect a broad correction in all the markets- and cash to become very tight.
There is daily momentum consolidation- and if any other events occur that send yields upward- bitcoin is likely to suffer as a consequence. If instead we sail into the new year unscathed- then this consolidation may provide another leg up; but a break below 88k and a push towards 60k may solidify bitcoins correction.
DAILY
WEEKLY


BRAVE NEW COIN TOP (EXPERIMENTAL)BNC:BLX
It's important to note that cryptocurrency markets are highly volatile, and such forecasts are speculative. Investors should conduct thorough research and consider their risk tolerance before making investment decisions.

(BTC) bitcoinan indicator to show the price of BTC is beginning a new phase based on whatever I did with this indicator. .dev
