BITCOIN - Price can little correct and then bounce up to $102600Hi guys, this is my overview for BTCUSDT, feel free to check it and write your feedback in comments👊
A few moments ago price reached resistance area and then started to decline inside wedge, breaking $107000 level.
Price fell to support line of wedge and then traded near $94000 level until it bounced up from support line again.
BTC rose to resistance line of wedge and then dropped back to support line, after which started to grow.
After this, price rose to resistance area, breaking $94000 level and exiting from wedge, and starting to fall in reverse wedge.
In this pattern, BTC fell to support area, where it reached support line and then made an upward impulse.
Now price declining, so, I think Bitcoin can fall a little and start to grow to $102600 resistance line of reverse wedge.
If this post is useful to you, you can support me with like/boost and advice in comments❤️
Btc-bitcoin

Bitcoin (BTC) – Technical Analysis & Key LevelsCurrent Market Status:
Price: Trading near $97,000, below the $98,000–$100,000 resistance zone.
Weekend Movement: Recovered 10% of losses, but some gains have been retraced.
Directional Bias: Neutral, as BTC consolidates under key resistance.
Key Levels to Watch
Upside Targets (If BTC Reclaims $100K as Support)
$103,000–$108,000 → Next resistance zone, a breakout above this could trigger further upside.
$115,000+ → Potential medium-term target if bullish momentum strengthens.
Downside Support Levels (If BTC Fails to Hold 97K–$100K Zone)
$91,000–$95,000 → Immediate support range, likely to attract buyers.
$85,000–$87,500 → Stronger support in case of deeper correction.
Market Outlook & Trading Strategy
Bullish Scenario:
A confirmed breakout above $100,000 would shift momentum toward $103,000–$108,000.
Sustained price action above $100K would indicate strength, supporting further rally potential.
Bearish Scenario:
If BTC fails to hold current levels, expect a pullback to $91,000–$95,000.
A break below $91K could expose BTC to $85,000–$87,500 support levels.
Final Thoughts
BTC remains at a critical juncture, with $100K acting as a key decision point. Traders should monitor price action closely for confirmation of either a breakout (bullish) or a rejection leading to further downside (bearish) before positioning for the next major move.

Bitcoin Pullback or Trend Reversal? Key Levels to Watch!Bitcoin failed to Break the $107,000 Resistance as in the Previous post (the 7th attack failed ).
Bitcoin ( BINANCE:BTCUSDT )is moving in the Resistance zone($100,520-$97,200) , near the Support lines , the 50_SMA(Daily) , and Monthly Pivot Point .
This upward movement these few hours can be in the form of a pullback to 50_SMA(Daily) and Support lines (broken) . Of course, the worrisome point is the momentum of this upward movement .
According to the theory of Elliott waves , this increase of these few hours can be in the form of the main wave 4 . The main wave 4 structure so far is a Zigzag correction(ABC/5-3-5) .
I expect Bitcoin to once again attack the 100_SMA(Daily) and the Heavy Support zone($93,300-$90,500) .
Cumulative Short Liquidation Leverage: $102,926-$100,450
Cumulative Long Liquidation Leverage: $92,570-$91,249
Note: If Bitcoin goes below $97,000, we should have more confidence that this analysis is correct.
Note: If the CME Gap($102,580-$100,320) fills in this uptrend, we should expect another attack on the $107,000 resistance.
Do you think the correction of Bitcoin continues, or should we wait for Bitcoin re-pumps in the coming hours? Please share your ideas in the comments.
Please respect each other's ideas and express them politely if you agree or disagree.
Bitcoin Analyze (BTCUSDT), 1-hour time frame.
Be sure to follow the updated ideas.
Do not forget to put Stop loss for your positions (For every position you want to open).
Please follow your strategy and updates; this is just my Idea, and I will gladly see your ideas in this post.
Please do not forget the ✅' like '✅ button 🙏😊 & Share it with your friends; thanks, and Trade safe.

Gold XAUUSD Possible Move 06.02.2025Market Analysis: Incomplete Head and Shoulders Pattern with Breakout & Retest Strategy
Pattern Identified:
The chart presents an incomplete Head and Shoulders (H&S) pattern, which suggests a potential reversal or continuation depending on price action at key levels. The neckline of the pattern aligns with the green support zone.
Key Levels:
Resistance Zone (Red Area - ~2,872): Price has tested this zone multiple times, making it a key level for a breakout.
Support Zone (Green Areas - ~2,860 and ~2,844): These zones act as crucial demand areas, where price could either bounce or break lower.
Possible Trade Scenarios:
Bullish Breakout:
If price breaks above the red resistance (~2,872) and successfully retests it as support, this would confirm a bullish continuation.
Entry Signal: Buy after a confirmed retest with bullish momentum.
Target: Next resistance levels around 2,884 - 2,890.
Stop-Loss: Below the previous structure (~2,864).
Bearish Breakdown:
If price fails at resistance and breaks below the green support (~2,860), a bearish move is likely.
Entry Signal: Sell after a successful retest of the broken support (~2,860) as new resistance.
Target: Lower support zone around 2,844.
Stop-Loss: Above the broken level (~2,868).
Neutral Range-Bound Scenario:
If price remains trapped between 2,860 and 2,872, traders should wait for a breakout before entering trades.
Trade Signal (Based on Breakout Confirmation)
Buy Signal: If price breaks and retests above 2,872, enter long with a target of 2,884+.
Sell Signal: If price breaks and retests below 2,860, enter short with a target of 2,844.
This strategy ensures safe trading by waiting for confirmation before taking positions.
Kindly follow, comment, and like to show support.

Bitcoin. Eternal Channel.Bitcoin faces ambiguous resistance in the $100k region and there is a threat of deliberate price manipulation to create artificial importance at this level. Price is at a decision point. A supply crisis is coming.


BTCUSD H4 - Short SignalBTCUSD H4
Trying to play ball here on BTCUSD, we are still trading south of $100k which is important, similarly ETH is still trading south of $3000, which is equally as important.
There is scope to see some more selling pressure here on BTCUSD and ETH, which we would hope takes us down to GETTEX:92K again and then potential beyond to the next area of major support.
Lets see what unfolds! We are following along!

Shiro Neko $Shiro Big Move IncomingIf you missed the Shiba Inu run, Shiro Neko could be your next golden opportunity. The same team that propelled SHIB to mainstream adoption is behind this project, and its early performance has already caught the market's attention.
Shiro Neko hit an impressive SEED_TVCODER77_ETHBTCDATA:1B market cap on launch and, after a period of consolidation, is gearing up for its next move.
📊 Market Analysis & Potential Reversal
Strong community-driven momentum similar to early SHIB & DOGE.
High-volume accumulation zones suggest whales positioning before the next breakout.
Support forming in key price levels, indicating potential for a parabolic move.
Key Catalysts for Growth
✅ Previous ATH – $SHIRO already reached SEED_TVCODER77_ETHBTCDATA:1B market cap, and a retest could be imminent.
✅ Dev Team with Proven Success – The same minds behind SHIB’s legendary run.
✅ Expanding Ecosystem – New listings, partnerships, and real-world utility in development.
✅ Early-stage growth potential – Market cap still has significant room to expand.
BINANCE:ETHUSDT BINANCE:CHILLGUYUSDT.P BINANCE:SHIBUSDT

#BTC Maximum pain promotes the path to maximum joy!#Bitcoin halving cycle profit indicator confirms that we are far from the local peak within our expectations and have a long journey to go!

Gold XAUUSD Possible Move 05.02.2025Analysis of XAU/USD (Gold) Price Action
Market Overview
The Gold shows a bullish trend in gold prices with a recent upward move.
Key levels of interest have been marked for potential buy opportunities.
The price action suggests a retracement is expected before a continuation to the upside.
Key Levels
First Buy Zone: $2,843 - $2,845
A minor retracement into this zone could present a buying opportunity.
If price reacts strongly at this level, it could continue upward.
Second Buy Zone: $2,830 - $2,833
This is a deeper retracement zone, aligning with a strong support area.
If price fails to hold at the first buy zone, this becomes the next high-probability entry.
Resistance/Take Profit Targets:
First target near $2,859 - $2,865 (recent highs).
Trading Plan
Scenario 1: Buy from $2,843 - $2,845
Entry: $2,843 - $2,845
Stop Loss: Below $2,837
Take Profit: $2,859 - $2,865
Risk-Reward Ratio: ~1:2 or better
Scenario 2: Buy from $2,830 - $2,833
Entry: $2,830 - $2,833
Stop Loss: Below $2,822
Take Profit: $2,850 - $2,859
Risk-Reward Ratio: ~1:3
Conclusion
The overall bias remains bullish, looking at Trumps press talk yesterday.
The strategy involves waiting for pullbacks to key demand zones before entering long positions.
Price action near these levels should be monitored for confirmation signals (e.g., bullish rejection candles).
Please like, follow and share.

Hold!Bulls! My fellow warriors of the market! I see fear in your eyes... I See hesitation... But I also see fire! The Bears think they own this battlefield! They think they can drive us back, force us to surrender, and take what is ours!
But I ask you - will you run? Will you let them push us down, and break our support and trample our dreams?!
HELL NO!
Then stand up! Hold the damn line! Push through that resistance! The Bears are clawing, but they are weak! You are stronger! Your are relentless!
You are BULLS!
So I ask you one last time - WHAT ARE YOU DOING LYING THERE?
GET UP!
PUSH FORWARD BREAK THEIR SPIRIT!
TAKE BACK THIS MARKET!
DO YOU WANT TO LIVE FOREVER!
$MSTR "Buy The Dip" Value AreasHere are some value areas to grab some MSTR if you have been looking to get in or if you want to add on more. If it drops to these levels... this is the "buy the dip" or "load up more" zone. Good value down here.

$BTC Hit Our Target to Perfection!I dunno bros, maybe I was a fortune teller in my past life 🙇
Still need CRYPTOCAP:BTC price to close a few days above the 9 and 20DMAs and a crossover to happen.
Showing lotsa strength tho.

$BTC and the exit pump to new highs before new lows?Ever since November/December, BTC has largely moved sideways in a wide range from FWB:88K -$109k.
Now that we've bounced off of $91k again this morning, I think that sets BTC up for a big bull trap. I think that we're likely to go to new highs either this week or before 2/21 up to the top resistances (although we don't necessarily have to make it up there), and then everyone will buy the new highs before we go to new lows.
This is a classic distribution top here and I think we'll see new lows by March. We can go as low as the bottom supports down $65-66k and the chart can remain bullish on the high timeframes.
I'm fully out of crypto and have only been speculating directionally by buying calls/puts on COIN (which I currently have calls on). This market has been extremely hard for most investors as they've been speculating in alts and most alts have continued to bleed out while BTC has ranged. I think alts will see new lows (yes, today's move was not the bottom, and the bull market will only start once most people have given up on crypto).
I'm bullish long-term, but still bearish in the near term and plan to buy back my position sometime in March once the distribution has played out to the downside.
Good luck from here on out.

A near perfect Darvas rectangle is formingA blow out through the top boundary would set up a target of $135,000

BITCOIN: Pattern gets repeated again and again and again.Bitcoin is on the most desirable buy levels long term as apart from only being neutral on its 1D technical outlook (RSI = 47.257, MACD = 281.800, ADX = 29.399) it just validated today the enormous buying zone that was waiting on the 1D MA100. This is a level that has worked as a buy entry over and over again these 2 years of the Bull Cycle. The last time it did was exactly a year ago on January 22nd 2024. The result was a +90% rally. If this gets repeated again the exact same way, then a new ATH at 170,000 is more than plausible.
## If you like our free content follow our profile to get more daily ideas. ##
## Comments and likes are greatly appreciated. ##

Bitcoin analysis: new update...hello friends
As we told you, we have to wait for the failure of the pattern, now with the failure of the pattern, we expect to have a pullback and after that the price can move up to the specified support.
And the indicated support range is an important support for Bitcoin that we expect to react well.
*Trade safely with us*

Bitcoin - Long in 2 casesBitcoin - Long in 2 cases
i shared short plan 5 days ago
after 2 Sl i did a mistake

The Bitcoin Peak: When Will the Cycle End?Been a while since I published a TA. I’ve been digging deep trying to decipher when the cycle top will come in for Bitcoin. Some say it’s an impossible feat. Well, let’s give it a go.
There are two major dates and one minor date for a possible cycle top:
May 2025
**Volume Flow**: 1157 Days
**From June Bottom**: 1064 days
**ETH clear bottom**: June 2022
**Bar Pattern Fractal**: From 2015 bottom
**221k Price Target**: Target crosses with the model in May.
September 2025
**From November Bottom**: 1064 days
**Major Macro Time Fibonacci**
**Chainlink Fractal**
**Chainlink Time Fib**
March 2025
**Small Time Fibonacci**
**Bull Flag End**
**Average % move and time since 2019**
As you can see, there is a lot of evidence to unpack here, so it’s going to be a long one. Let’s start with the first date: May 2025.
---
May 2025
Volume Flow on Heikin Candles on the Monthly shows that from the Bearish cross to the cycle top is 1126 days, which ends up being May.
Every cycle, Bitcoin has always put in a double bottom to mark its cycle low. As you can see, in 2022 we had two major crashes, and even though it’s not 100% clear here, we got a double bottom.
The amazing thing about the first bottom in June 2022 is that it mirrored the first bottom of the cycle low of 2015. That fractal was a mirror, showing the importance of this first low in Bitcoin in June 2022.
If we overlay the 2015 fractal, we get the top coming in May.
For anyone who doesn’t know, the last two cycles, Bitcoin has taken 1064 days from Cycle Low to Cycle Top. 1064 days from the June 2022 low is May.
ETH has a much clearer bottom than Bitcoin this cycle. It also took 1064 days, which puts it in May.
So you can see, there is a lot of evidence pointing towards a May 2025 Cycle Top for Bitcoin.
---
September/October 2025
1064 days from the second bottom in November 2022 would be October 2025.
For years, I have been using this Major Macro Time Fibonacci sequence that shows me important moments in Bitcoin’s cycles. The last pointed to a move down to 48k in August 2023, which is hard to see on the 2Week chart.
As you can see, it comes close to pinpointing moves, so the next date is the end of September 2025, which lines up with the 1064 days from November 2022.
I have been following this Chainlink fractal for more than a year. We traded LINK using this fractal back in October 2023. You can check my TAs from that period. The fractal is still valid and tops in September 2025.
Chainlink Fibonacci Time Sequence has been hitting home runs time and time again, from pinpointing the top all the way down to the bottom. The next date is late August 2025, very close to September 2025.
---
March 2025
This date has far less weight for a cycle top but could be part of a major local top and correction.
A small Time Fibonacci sequence taken from this level shows that March 31st is the next date, and the one after that is late August 2025, the same as the Chainlink fractal.
240% over 162 days is the average that Bitcoin moves up since 2019. If we just overlay the average, we get 127k by mid-February 2025.
A mirror move from October 2023 to March 2024 puts us in March 2025.
---
Elliott Wave Section
I’m not an expert in this field but will throw in some takes.
Could we possibly be in Wave 4 out of 5?
Or could we be finishing Wave 3 right now and in for the first large correction of this bull market?
The fact is, the last time we hit this band on this model was January 2021. After that, there was a 31% correction lasting 31 days.
Sometimes 5 waves are very clear. Take GOLD, for example: there is a clear 5-wave pattern at max Fibonacci extension. This is a massive macro sell signal, in my opinion. Crazy how GOLD hit this level on Wave 5 as Bitcoin breaks 100k.
---
### **Price Targets
If we take the first cycle and overlay to 2015 cycle, it gave us the cycle top in 2021.
If we do the same for this cycle and overlay the 2015 cycle, we get a price target of 221k, which puts it at the top of my model in May 2025. Just discovered this—that’s one more point for May 2025.
As you can see, in the last two cycles it worked. Will it work this time? Who knows.
---
Pi Cycle Indicator
If we just run a rough projection on when the next cross will be, it crosses in April 2025, very close to May. Keep in mind this is a very rough idea of when it could cross.
---
Conclusion
We have 5 points in favor of May 2025, 4 points in favor of September 2025, and 2 points for March 2025. As always, the path is never clear for Bitcoin. Until we get much further down the road, I won’t conclusively know which date it will be.
This model I have been using has been so accurate thus far. We are so high up the last bands that we are most likely going to get some sort of long consolidation period with a correction soon, which would give the altcoin market a run.

ETH 18000 DOLLARS BY SEPTEMBER 2025 God dam what a beautiful day it is , one dreams of such a entry in a bull market.
ETH will hit 18000 dollars by september 2025 there is nothing you can about it , this is the game, leverage wiped out and reset now we enter the "only up period" from this moment .
The key to finding out the next move was the USDT DOM like always pointing the way , the lower higher on the RSI showing divergence.
The money flow on MC indicator was very clearly showing this move , private indicator cant publish it on here.
The Fractal from 2020 on ETH is playing out FORGET THIS HAMMER WICK it is happening from here ETH will close in this channel and rally to 18k!
Do not give in to fear this is where you want to stack as much as possible . Invalidation of idea would be ETH closing a weekly candle under this ascending macro channel .

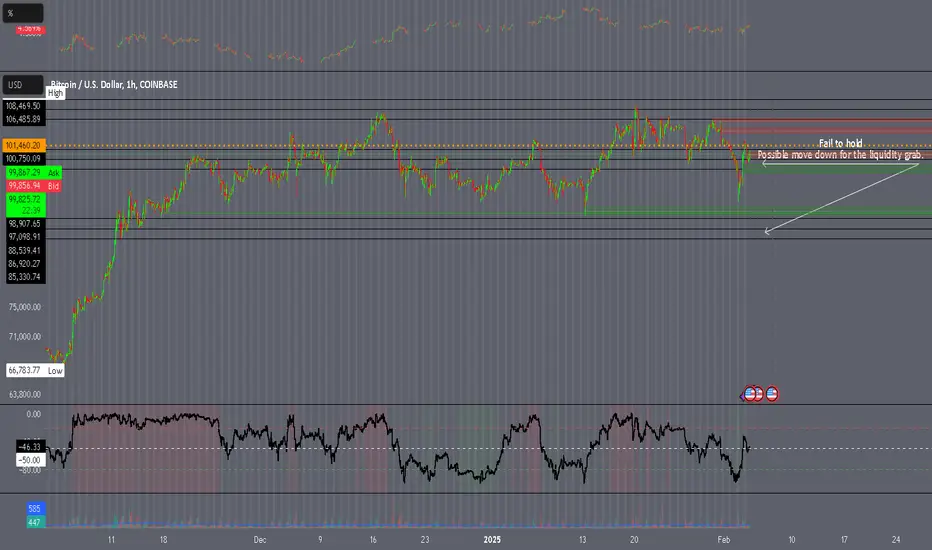
03/02/25 Weekly outlookLast weeks high: $106,485.24
Last weeks low: $100,995.99
Midpoint: $95,506.74
As the US begins a tariff trade war on the world, BTC ends the previous week with a weekend selloff back into the range low of $91,000. Despite the crypto world being everchanging this range low level has held strong for nearly 3 months now.
Because of this strong support level we have seen many weekly outlooks follow the pattern of an early break below weekly low, then reclaim and rally back up the range throughout the week. Could this be the case once again?
Currently sentiment is terrible, probably bear market levels of depression despite Bitcoin being above $100K most of the time. I think this is largely due to the state of altcoins as they are at pre-US election lows, in some cases bear market levels... This plays havoc mentally which so much was promised in terms of alt season potential now that Bitcoin is a new highs. In reality the market will do what hurts the most, max pain.
Having said that, generally a weekend dump can be misleading due to low volume and the absence
of institutional buying making any manipulated move much easier to pull off from a market makers point of view.
There are some nice 4H TF setups emerging, now the macro environment is definitely calling the shots in the Tradfi world but as long as the $91,000 holds the rangebound move is still in play.

Bitcoin - Bitcoin lost $100,000?!Bitcoin is trading below the EMA50 and EMA200 on the four-hour timeframe and is trading in its descending channel. Bitcoin’s upward correction and its placement in the supply zone will allow us to resell it. It should be noted that there is a possibility of heavy fluctuations and shadows due to the movement of whales in the market and capital management in the cryptocurrency market will be more important. If the downward trend continues, we can buy in the demand range.
In the past trading week, spot Bitcoin ETFs saw an inflow of $560 million, though this represents a significant decline compared to the previous two weeks. Meanwhile, as of January 31, 2025, U.S. spot Ethereum ETFs recorded a minor outflow of $45 million, though this decline was not particularly drastic.
At the same time, Standard Chartered Bank has advised investors in a new research note to view Bitcoin’s drop below $100,000 and the over 6% single-day decline in the crypto market as a buying opportunity. Jeff Kendrick, Head of Digital Asset Research at Standard Chartered, stated: “Hope is not a strategy.” He further explained: “When hope disappears, digital asset prices tend to fall by 10% to 20%.”
Despite recent market volatility, Standard Chartered remains optimistic about Bitcoin’s price trajectory in 2025. The bank’s research suggests that growing institutional interest could accelerate Bitcoin’s potential surge to $200,000 by the end of the year.
Last week, Donald Trump fulfilled two key promises to the crypto industry:
1. Granting clemency to Ross Ulbricht, the founder of Silk Road, who is regarded as a symbolic figure among Bitcoin and libertarian communities.
2.Signing an executive order on cryptocurrencies, which aims to enhance regulatory transparency for digital assets, promote stablecoins, prevent the debanking of the crypto sector, and ban the creation of a Central Bank Digital Currency (CBDC).
In parallel, Jeff Kendrick of Standard Chartered also warned investors to pay close attention to altcoins, referring to cryptocurrencies other than Bitcoin that are expected to experience significant growth in the coming year. He stated: “As soon as we enter the second phase, in my view, the altcoin season will begin.” Kendrick further noted that institutional flows will primarily drive Bitcoin and Ethereum investments, partially offsetting the rotation into altcoins.
Responding to the growing interest in Bitcoin and Solana, MetaMask is planning to expand beyond Ethereum. The company is currently working on integrating Bitcoin functionality while simultaneously exploring decentralized finance (DeFi) opportunities across multiple blockchain ecosystems.
Meanwhile, Texas Lieutenant Governor Dan Patrick has identified the establishment of a state Bitcoin reserve as a top priority for 2025. Texas, already a pioneer in adopting Bitcoin at the state level, continues on this path despite challenges at the national level.
If the proposal is approved, Texas will become the first U.S. state to hold Bitcoin as a financial reserve on its balance sheet, a move that could accelerate Bitcoin adoption within the U.S. financial system.

Bitcoin Plunges to $91K Amid Market TurmoilThe cryptocurrency market has been rattled as Bitcoin ( CRYPTOCAP:BTC ) nosedived 16% to $91,000, triggering concerns among investors. This steep drop comes amid broader market sell-offs, with Ethereum ( CRYPTOCAP:ETH ) and leading meme coins shedding nearly 20% of their value. The primary catalyst? Speculations of a trade war fueled by U.S. President Donald Trump's latest tariffs.
Technical Analysis
Bitcoin's price plummeted to an intraday low of $91,242, marking one of its most significant drops in recent months. Despite rebounding slightly to $94K, BTC’s movement reflects extreme volatility. Key technical indicators suggest:
- Support Levels: The next critical support zone lies near $90K, a psychological level that, if broken, could lead to further declines.
- Resistance Levels: BTC faces immediate resistance at $100K, with further upside contingent on market recovery.
- Liquidations: Over $397 million worth of CRYPTOCAP:BTC long positions were liquidated in the past 24 hours, amplifying selling pressure.
- Bitcoin Dominance: BTC dominance surged 2.76% to 61.38%, indicating that altcoins are suffering heavier losses compared to Bitcoin.
Additionally, the 9.5% drop in the total crypto market cap to $3.04 trillion, alongside a 182% increase in trading volume to $286.91 billion**, signals panic-driven trading behavior.
Trade War Fears & Market Uncertainty
The backdrop for this crypto crash is rooted in macroeconomic developments, particularly **Donald Trump’s new tariffs on Canada, Mexico, and China**. The prospect of escalating trade tensions has spooked global investors, leading to a risk-off sentiment across financial markets.
Key fundamental factors contributing to Bitcoin’s decline:
1. Global Trade War Speculations – Trump's tariff policy has sparked fears of retaliatory measures, which could weaken global economic stability and reduce institutional appetite for risk assets like cryptocurrencies.
2. Market Liquidations – Over $2 billion worth of crypto liquidations occurred in the past 24 hours, intensifying downward momentum.
3. Investor Sentiment Shift – Uncertainty prevails as market participants remain divided, with some anticipating a rebound while others brace for further declines.
4. Macroeconomic Headwinds – Broader economic factors, including inflation concerns and regulatory uncertainties, add pressure to BTC's price action.
What’s Next for Bitcoin?
While the current downturn is causing fear, Bitcoin has historically demonstrated resilience in the face of macroeconomic turmoil. The coming days will be critical, with key factors to watch including:
- $90K Support Test – If Bitcoin holds this level, a relief rally could follow, potentially targeting $100K resistance.
- Macroeconomic Developments – Any updates on the global trade situation or Federal Reserve monetary policy could influence BTC’s trajectory.
- Institutional Interest – Large players may use this dip as a buying opportunity, injecting fresh liquidity into the market.
Conclusion
Bitcoin's 16% crash to $91K reflects a combination of technical breakdowns and macroeconomic pressures. While uncertainty looms, BTC remains a key asset in the crypto ecosystem, with historical recoveries following major dips. As the market navigates trade war fears, investors should remain cautious, keeping an eye on support levels and potential rebounds.
