Geopolitical Tensions & Technical Pattern Point to BTC Decline!Bitcoin ( BINANCE:BTCUSDT ) fell about -5% after tensions between Israel and Iran escalated. Unfortunately , these tensions are still escalating, but Bitcoin has managed to recover about +3% so far.
Bitcoin is moving near the Resistance zone($107,120-$105,330) and Cumulative Short Liquidation Leverage .
In terms of Elliott Wave theory , it seems that Bitcoin is completing a corrective wave . The corrective wave structure could be Contracting Triangle . In case of a sharp decline in Bitcoin again, we can consider these waves as five descending waves (if Bitcoin does NOT touch $106,600 ).
I expect Bitcoin to start declining again and at least drop to the Support zone($107,120-$105,330 ). The second Target could be the Support line and Cumulative Long Liquidation Leverage .
Note: If Bitcoin can break the Resistance zone($107,120-$105,330), we can expect further increases in Bitcoin.
Please respect each other's ideas and express them politely if you agree or disagree.
Bitcoin Analyze (BTCUSDT), 1-hour time frame.
Be sure to follow the updated ideas.
Do not forget to put a Stop loss for your positions (For every position you want to open).
Please follow your strategy and updates; this is just my Idea, and I will gladly see your ideas in this post.
Please do not forget the ✅' like '✅ button 🙏😊 & Share it with your friends; thanks, and Trade safe.
Btc-bitcoin

Bitcoin - Will Bitcoin Reach Previous ATH?!Bitcoin is above EMA50 and EMA200 on the four-hour timeframe and is in its short-term descending channel. We can look for Bitcoin short positions from the specified supply range. If this range is broken, the path to the rise and a new ATH for Bitcoin will be presented.
It should be noted that there is a possibility of heavy fluctuations and shadows due to the movement of whales in the market and capital management in the cryptocurrency market is required, more than we would like. If the downtrend continues, I can buy in the desired range.
Bitcoin is now approaching its all-time high, yet unlike previous bullish cycles, we have not seen widespread profit-taking so far. The market’s whales currently seem uninterested in large-scale selling at these levels and appear to be waiting for higher price targets.
Since the start of January 2024, cumulative inflows of over $60 billion have poured into crypto-related investment products in the U.S., including ETPs and ETFs. In addition, retail investor futures trading volumes have recently surpassed their one-year average. Indicators of retail activity suggest that a significant number of smaller investors have become active in the futures markets.
The total assets under management by crypto investment funds surged to an unprecedented $167 billion in May. This impressive growth was fueled by net inflows of more than $7 billion into these funds. Meanwhile, global equity funds recorded $5.9 billion in outflows, and gold funds, for the first time in 15 months, also saw capital leaving.
The year 2025 could turn out to be the most dangerous year yet for cryptocurrency holders. Already, more than 25 incidents involving physical attacks on crypto owners have been reported, and the year isn’t even over. These attacks have targeted individuals whose digital asset information or identities were compromised, leading to thefts, kidnappings, physical threats, or assaults.
On another front, the total value of circulating stablecoins has surpassed $250 billion, more than doubling from its mid-2023 low of $123 billion. USDT remains the market leader with a 62% share, followed by USDC at 24%, while other stablecoins such as USDe, DAI, and BUIDL are also expanding their presence.
It is worth noting that average spot trading volumes on centralized exchanges have dropped to their lowest levels since October 2020.This kind of pattern typically precedes a significant price move—whether that’s a sharp rally or a deep correction. It’s also possible that this phase of uncertainty could persist for several more weeks.

BITCOIN - Price can fall a little and start to move upHi guys, this is my overview for BTCUSDT, feel free to check it and write your feedback in comments👊
Price entered to rising channel, where at once bounced from support line and rose a little, and then corrected.
Next, price continued to move up and soon reached $100500 level, after which broke it and rose to resistance line.
After this movement, BTC corrected and continued to grow in rising channel and later reached $110500 level.
Bitcoin exited from rising channel, made a fake breakout of resistance level, and started to trades inside flat.
In flat, price tried to grow but failed and fell to support level and then grew back again, after which started to decline.
Now, I expect that BTC can repeat as move before, it falls a little and then grows to $110500 resistance level.
If this post is useful to you, you can support me with like/boost and advice in comments❤️

Sell Bitcoin and buy Altcoins!🚨 Controversial Take Ahead – Packed With High-Value Insights 🚨
Let’s dive deep.
👨💻 A bit about me:
I’ve been riding the tech wave since the beginning:
Programmed video games in the 80s and 90s
Built VSTi plugins in the early 2000s
Started creating websites when Internet Explorer 1.0 launched
Sold 3D assets when Unity 2.5 (first PC version) dropped
Launched my own blockchain in 2016
Deployed smart contracts on TRON in 2018
I don’t follow trends—I predict them. My instincts are backed by decades of hands-on experience.
Now, here’s what I see coming:
⚠️ 1. Sell Your Bitcoins
Yes, Bitcoin is obsolete. It’s a technology—not a precious metal—and like all tech, it must evolve or die.
Ask yourself:
Do you use a Blackberry today?
Still flying in 1930s planes?
Gaming on an Atari or Commodore 64?
Surfing the web with Lycos or Altavista?
No? Then why are you betting on a 2009 technology?
Most people don’t even understand how Bitcoin works—ask around what SHA256 or RSA means.
Crypto is misunderstood, and that’s dangerous.
Back in 1998, I created the UPL library, which handled data compression & encryption using all major algorithms—Huffman, LZSS, DES, RSA, etc. I’m not just throwing words around—I’ve built this stuff.
Politicians and financial institutions (yes, even Saylor) are 15 years late to Bitcoin. They're missing the truth: BTC’s upgrades failed (Ordinals, Runes, etc). Its value holds due to FOMO from the uninformed, not innovation.
One day, your Bitcoins will be as worthless as mp3.com stock. That’s not opinion—that’s technological reality.
🪙 2. Buy Altcoins
Not every altcoin is a winner—but that’s where the real opportunity is.
Remember:
Nokia and Blackberry ruled before Samsung and Xiaomi.
The next Amazon, Google, or Nvidia already exists—and it's trading for pennies.
When people laugh at altcoins, that’s the time to buy low.
Altcoins like CRYPTOCAP:SOL , CRYPTOCAP:SUI , MIL:UNI could 100x… even 100,000x.
Bitcoin might double—and then crash.
Smart traders buy when everyone else is mocking.
🌍 3. Consequences of the BTC Collapse
This collapse will come at a turning point in global power.
Wall Street and U.S. states are heavily exposed to BTC. If it crashes, the Western financial system could implode—a dot-com-level disaster.
China, on the other hand, is stable, adaptive, and tech-forward.
Crypto without staking, DeFi, NFTs, GameFi, smart contracts? That’s not the future—that’s Bitcoin. Altcoins are the future.
Bookmark this post. Re-read it in 10 years.
You’ll remember I said it first: Innovation is unstoppable.
Enjoy the last Bitcoin pump. Then watch what comes next.
DYOR.
#CryptoRevolution #AltcoinSeason #BitcoinCollapse #Web3Future #BlockchainInnovation #SellBitcoin #BuyAltcoins #CryptoTruth #DeFi #GameFi #SmartContracts #CryptoShift #UnstoppableInnovation
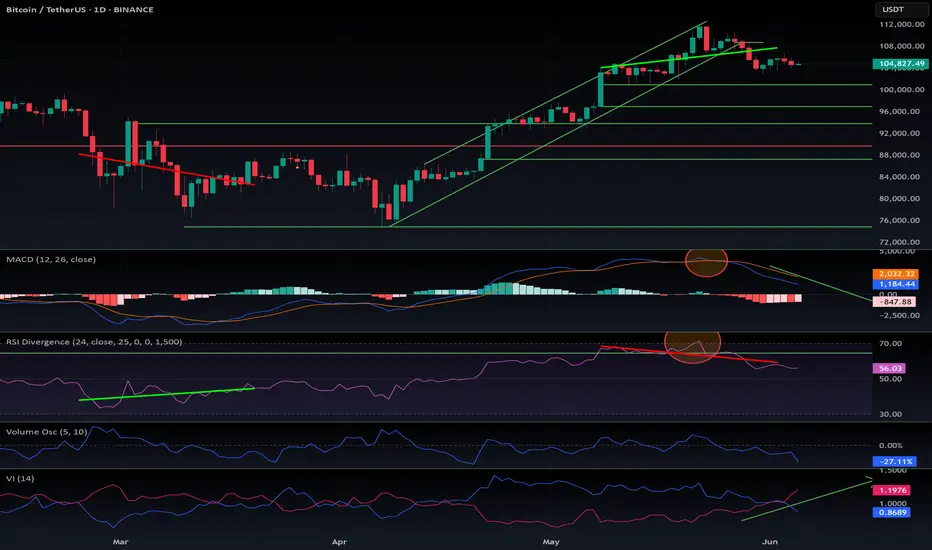
$BTC correction has just started. What is coming next?As I previously stated in my CRYPTOCAP:OTHERS , CRYPTOCAP:BTC.D , and CRYPTOCAP:TOTAL2 analysis — this move was expected. Check out my other ideas for more detailed breakdowns.
So, what’s happening?
Bitcoin maximalists have been buying heavily at the top, right when RSI and MACD were in overbought territory, creating a clear bearish divergence.
Something Saylor and others seem to ignore: you can't defy mathematics — what needs a correction will correct.
CRYPTOCAP:BTC still looks bullish on the weekly timeframe, so we’re not entering a bear market. However, the pump is over, key supports have broken, and altcoins are correcting — some by -25% in a single day.
Purely from a charting perspective, we can identify multiple potential support levels for CRYPTOCAP:BTC :
$101K, $94K, $89K, $87K, with a lower-probability retest down to $75K.
We’re likely entering a 2-week correction, after which CRYPTOCAP:BTC could resume its uptrend — potentially closing June at a new all-time high.
DYOR.
#Bitcoin #BTC #Altcoins #CryptoCrash #TechnicalAnalysis #BTCdominance #TOTAL2 #BearishDivergence #Saylor #RSI #MACD #ATH #DYOR

Bitcoin Prediction Update - BTC Crashed as expected! What’s nextBitcoin Crashed as Predicted! I am updating the current price action of CRYPTOCAP:BTC , and if we can reach our main target of $93K! Smash the Rocket Button if you did not completely hate this update! See you very soon again!

HolderStat┆BTCUSD local correctionBINANCE:BTCUSDT
→ Price coils between rising-channel mid-line & descending cap
↳ 108 k lid: clear it to unlock 112–117 k upper rail
⇢ Hold 105 k mid-rail to keep staircase intact
⤴ Drop < 104 k flips bias to 102 k base

BTC - No champange toast Well, that was unfortunate. BTC too the very beating that was forecasted. Demonstrating the power of the combined methods that I use. Murrey Math, Elliot Wave, and K wave ( Kumar Wave ) We have a small chance, in the low single digits to recover from this. But the Lions share of probability remains with the Re test down toward $84k. I will update more later. That chart is in my profile. Good luck.

BTC losing momentum but support needs to holdBTC is showing some bearish signs. However, as long as the price can stay above $101k, the bias is still up.
Full TA: Link in the BIO

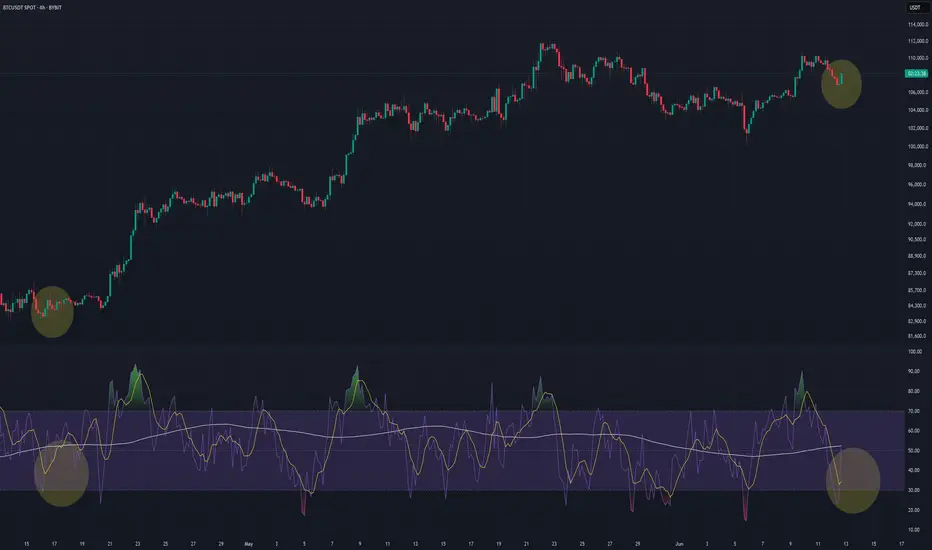
BTC Triple JumpRSI Fired ✔ Breakout Above $110,200 Next ➜ Targeting 140K
BTC is entering a critical phase on the 4H chart, and this setup looks remarkably similar to previous moments that led to sharp bullish continuation. Price is steadily forming higher lows and now pressing right up against the key resistance at $110,200 — the last confirmed swing high. 🧱
What makes this moment particularly interesting is what’s happening beneath the price: momentum is quietly shifting. Using a custom triple RSI setup — with short, medium, and long lengths — I’m seeing a familiar pattern unfold. The white line (longer-term RSI) has already crossed above the 50 level ✅, a strong signal of building trend strength. Meanwhile, both the short and medium RSIs are deep in the oversold zone 🔻 — a dynamic that, in the past, has front-run explosive rallies.
This exact structure has preceded multiple breakout moves over the past months. The RSI alignment acts as an initiative confirmation, and now price is approaching the final confirmation level: a break and 4H close above $110,200. If that happens, I expect a swift push toward $112,500–$114,000, with potential for much more.
🔥 This aligns perfectly with my previous idea, where I laid out a case for a major breakout in June that could drive BTC toward $140K. That outlook was based on higher-timeframe expansion patterns and macro structure — and what we’re seeing now could be the moment where it all starts.
As of now, it’s too early to talk about invalidation. The structure remains intact. Momentum is shifting. All that’s left is the breakout.
If you haven’t seen my 140K projection yet, check it out — this could be the first real ignition point. 🚀
BTC - UH OH ? - RE CORK THE CHAMPAGNE ? Last night the momentum was so strong , and resistance levels where being taken out one after another. Today when we should have been making new highs, instead we hit a wall. Not good. That wall in yellow is the 7/8ths reflection line. The bounce backward from here could pick up massive steam downward. The 1st stop loss has already been hit, #2 and #3 look to be tested today, and from the way things look now, they look to yield. I am stopped out, and will not reenter long until a new high is made. Good Luck!

The Charts Never Lie [Well, almost never]So many reasons to be Bullish on Alts right now.
Historically, BTC will peak first, and then ALTS will have their turn. It looks like they are prime for a run at least to the middle of the range, although why stop there?

Bitcoin Near Breakout – CPI Miss Could Be the Catalyst?Just Released: Key U.S. Inflation Data:
Core CPI m/m: 0.1% (vs. 0.3% forecast)
CPI m/m: 0.1% (vs. 0.2% forecast)
CPI y/y: 2.4% (vs. 2.5% forecast)
Market Reaction & Outlook:
The softer-than-expected inflation figures suggest easing price pressures in the U.S. economy — a potential bullish signal for risk assets, such as Bitcoin ( BINANCE:BTCUSDT ).
-----------------------------
Now let's take a look at the Bitcoin chart on the 1-hour time frame .
Bitcoin is trading in the upper part of a Heavy Resistance zone($104,380-$103,670) and is trying to break through this zone. The announcement of US indexes could be a trigger for a breakout of this zone .
In terms of Elliott Wave theory , Bitcoin appears to be completing microwave 4 of the main wave 3 . The structure of microwave 4 is a Double Three Correction(WXY) .
I expect Bitcoin to start rising from the Potential Reversal Zone(PRZ) and near the Support line again and rise to at least $110,670 and if the Heavy Resistance zone($104,380-$103,670) is broken we should expect new ATHs in the coming days .
Cumulative Long Liquidation Leverage: $108,791-$107,887
Cumulative Long Liquidation Leverage: $106,840-$105,457
Cumulative Short Liquidation Leverage: $111,381-$110,568
Note: If Bitcoin falls below $105,700(Worst Stop Loss(SL)), we should expect further declines.
If you want to know my weekly analysis about BTC , I suggest you check out the following idea:
Please respect each other's ideas and express them politely if you agree or disagree.
Bitcoin Analyze (BTCUSDT), 1-hour time frame.
Be sure to follow the updated ideas.
Do not forget to put a Stop loss for your positions (For every position you want to open).
Please follow your strategy and updates; this is just my Idea, and I will gladly see your ideas in this post.
Please do not forget the ✅' like '✅ button 🙏😊 & Share it with your friends; thanks, and Trade safe.

HolderStat┆BTCUSD preparing to test 110kYesterday's rise in CRYPTOCAP:BTC puts the immediate target at testing 110,000 and 112,000 and after that opening a new ATH. Local resistance has been broken.

BTC - NEXT LEG COMING NOW - $132- $137KI was wrong about sideways action, then rally. BTC moved immeditely higher and looks to be picking up steam. I see a new high to $125 area, and then perhaps consolidation. But eventually to $132- $137 is in the next 2-3 months. Things are really looking bullish now. I was expecting it to take more time to develop, but that is not happening.

BTC target months ago has been on point, "NEW" TargetsSo far our CRYPTOCAP:BTC 109 - 111k target has been MONEY!
Bitcoin hasn't been able to close above it all!!!
Showing Negative divergence on RSI & $ Flow on WEEKLY charts.
"New" CRYPTOCAP:BTC prediction?
Will stand by what we said previously. IMO there's good possibility we could see BTC going to the 170k area, extreme = 226K.
Monthly RSI doesn't peak until it hits 90's BUT there's Negative Divergence forming.
$ FLOW slowly diverging as well.
VOLUME DYING on SPOT. Not so bad on Futures.

BTCUSD: weekly overview for trading!Hello Traders, I'm mostly an investor for this instrument.
for this week we are struggling hard in middle of a long-term channel and also the effect of halving cycles could move the instrument more and more down.
But I'm waiting for good news form USD weakness. I'm still more bullish for Bitcoin.
****************
The indicated levels are determined based on the most reaction points and the assumption of approximately equal distance between the zones.
Some of these points can also be confirmed by the mathematical intervals of Murray.
You can enter with/without confirmation. IF you want to take confirmation you can use LTF analysis, Spike move confirmation, Trend Strength confirmation and ETC.
SL could be placed below the zone or regarding the LTF swings.
TP is the next zone or the nearest moving S&R, which are median and borders of the drawn channels.
*******************************************************************
Role of different zones:
GREEN: Just long trades allowed on them.
RED: Just Short trades allowed on them.
BLUE: both long and short trades allowed on them.
WHITE: No trades allowed on them! just use them as TP points

BTC Dominance looking real heavy up hereWouldn't be surprised in the least if we see a freefall on BTC Dominance over the next few months.
Of course there is no guarantee, and things may look different in a month, however as it stands, I think there is a potential ALT cycle on the cards for 2025.
RSI needs a reset, amongst other things.

Bitcoin’s Final Wave & Time Reversal Zone _ New ATH Loading?Today, I want to analyze Bitcoin ( BINANCE:BTCUSDT ) on the weekly time frame and answer these questions :
Can Bitcoin create a new All-time High(ATH) or not!?
At what price range can Bitcoin's uptrend end!?
When can we expect the uptrend to end!?
Please stay with me.
Bitcoin appears to have managed to break the Resistance lines , although we saw a fake break a few months ago , and it also appears to have a Hammer Candlestick Pattern in the previous weekly candle , which could signal the completion of Bitcoin's pullback to the Resistance lines(broken).
In terms of time , if we want to analyze the Bitcoin chart and look at Bitcoin's past, in general, the months of June(Average=-0.13%/Median=+2.20%) and especially July(Average=+7.56%/Median=+8.90%) have been among the most productive months for Bitcoin , and the months of August(Average=+1.75%/Median=-8.04%) and September(Average=-3.77%/Median=-4.35%) were the months when Bitcoin had a correction . Technical analysis tools show the end of the upward trend and the beginning of Bitcoin's correction at the Time Reversal Zone(TRZ=June 23 to August 4) .
In terms of Elliott Wave theory , Bitcoin appears to be completing the main wave 5 , as the main wave 3 was extended .
I expect Bitcoin to trend higher(+10%) in the coming weeks and create a new ATH . New ATH could be created in the Potential Reversal Zone(PRZ) and TRZ , and then we can wait for the start of the main correction .
What do you think about Bitcoin’s future movement? Can Bitcoin create a new ATH? When and at what price?
Note: If Bitcoin falls below $100,000, we should expect further declines.
Please respect each other's ideas and express them politely if you agree or disagree.
Bitcoin Analyze (BTCUSDT), weekly time frame.
Be sure to follow the updated ideas.
Do not forget to put a Stop loss for your positions (For every position you want to open).
Please follow your strategy and updates; this is just my Idea, and I will gladly see your ideas in this post.
Please do not forget the ✅' like '✅ button 🙏😊 & Share it with your friends; thanks, and Trade safe.

BTCUSD – continuing to buy as breakout confirms bullish setupBTCUSD is forming a classic “cup and handle” pattern, now breaking above key resistance. Price is holding within an upward channel, and if momentum stays strong, the next target could reach 160,000 and beyond.
It might seem hard to believe, but the structure points to continued bullish momentum. I’m not missing this opportunity and continue to build long positions as this breakout develops.

$BTC Extremely Bullish Daily Close - Parabola Underway?Hawt diggity dayumm 🥵
CRYPTOCAP:BTC really going for it following my original idea behind the parabola formation 🤯
Reclaiming ATH high at $112k will confirm the move 🤞

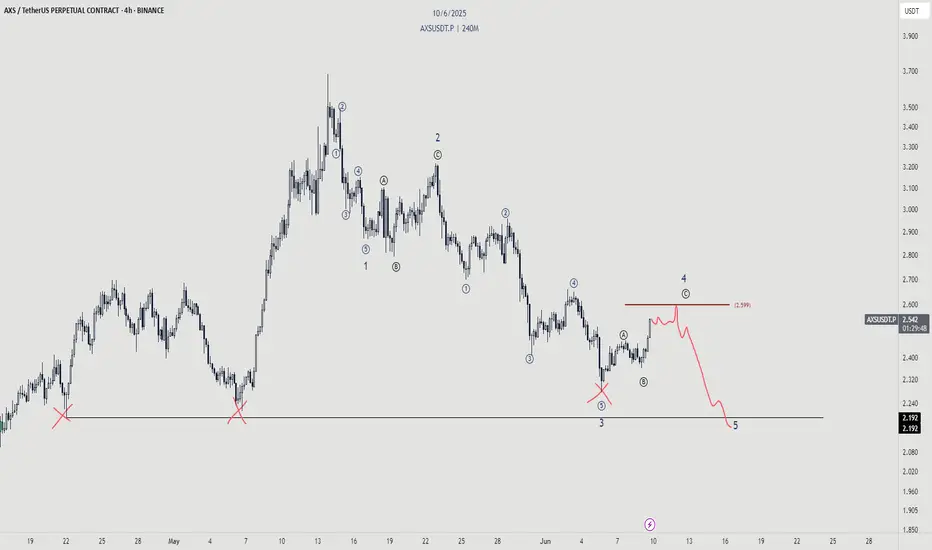
AXS - Dont be faked outWhile the bounce is nice, we should not forget about the real trend here.
We're still bearish overall and there is a shit ton of liquidity to be taken out. Don't be blinded
Bitcoin - Showing strength as it breaks key resistance levels!Bitcoin (BTC) recently demonstrated impressive strength by bouncing off a well-known confluence zone consisting of the golden pocket and a 4-hour fair value gap (FVG) around the $100,000 level. This technical area has historically acted as a reliable support and once again proved its significance, offering a solid foundation for the current rally.
Following this bounce, BTC surged to $108,000, decisively breaking above the 4-hour FVG near $107,000. With this breakout, the previously resistant zone is now expected to flip into support, adding further confidence to the bullish outlook. This type of price action is often seen in strong uptrends, where key resistance levels are reclaimed and converted into support, providing a base for further upside.
Importantly, BTC has also managed to push through the golden pocket resistance, a critical Fibonacci retracement area closely watched by traders. This breakout, in conjunction with the 4H FVG clearance, clears the path for a potential continuation toward Bitcoin’s all-time high.
Momentum is clearly building. Buying pressure is strong, and retracements have been shallow, indicating a market dominated by demand. While this is a bullish sign, a brief pullback or bounce off the newly formed support (the 4H FVG zone) would be healthy. Such a move would allow BTC to consolidate and build strength before potentially pushing toward new highs.
Overall, the technical landscape looks increasingly favorable for BTC. As long as it holds above the reclaimed support zones, the path to retesting, and possibly surpassing, the all-time high appears wide open.
Thanks for your support.
- Make sure to follow me so you don't miss out on the next analysis!
- Drop a like and leave a comment!
