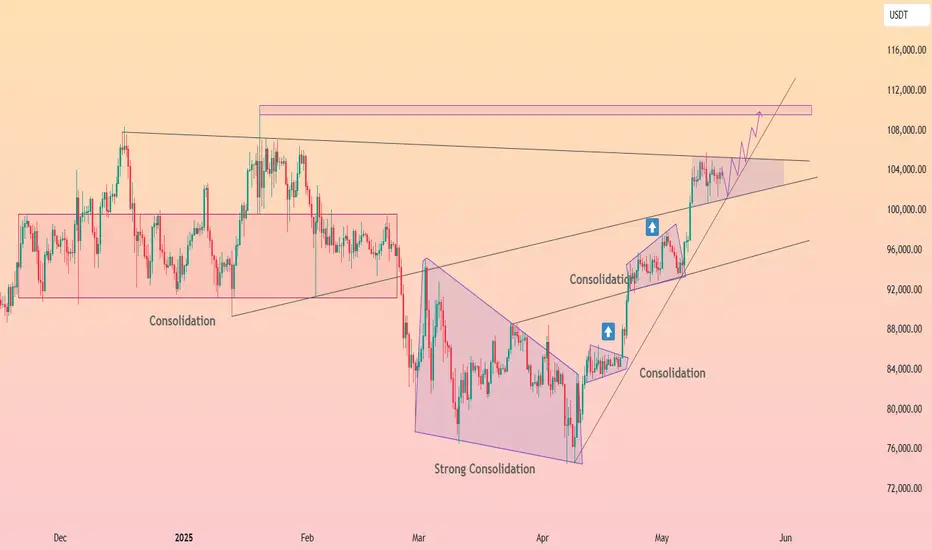
HolderStat┆BTCUSD came out from the triangleCRYPTOCAP:BTC price has advanced in neat stair-steps from March’s strong consolidation wedge, hugging an internal up-trend. The latest flag is coiling on the mid-channel near 103 k; defend it and the route toward the 113-115 k supply box stays active. A daily close below the inner rail would merely usher a glide to the outer channel near 97 k—momentum remains north-bound while that area is respected.
Btc-bitcoin
EURGBP BULLISH OR BEARISH DETAILED ANALYSISEURGBP is currently respecting a well-defined rising channel structure on the daily timeframe, and the pair has just delivered a strong bounce off the lower trendline support. This fresh reaction suggests renewed bullish momentum from the bulls stepping in at a key zone. The current price is hovering around 0.84–0.8450, and I’m targeting a move towards the 0.87 area, aligning perfectly with the upper boundary of the channel and a clean resistance level from previous market structure.
From a fundamental standpoint, euro sentiment is being supported by sticky inflation across the Eurozone. The ECB remains cautious with any premature easing, with policymakers signaling a data-dependent approach to rate cuts. Meanwhile, the UK economy is under pressure after the latest GDP figures confirmed weak growth, adding weight to the Bank of England’s dovish leanings. Traders are now increasingly pricing in rate cuts from the BOE in the coming quarter, creating a clear divergence in monetary policy outlooks — a bullish driver for EURGBP.
This technical setup is further reinforced by bullish candlestick formations on the daily chart, signaling a potential reversal from recent weakness. RSI is bouncing off mid-levels, and there's early crossover potential in MACD favoring upward momentum. Price has also reclaimed key support near 0.8400, now likely to act as a floor going forward. As long as price remains above this zone, the path of least resistance remains to the upside.
With this combination of a rising channel pattern, supportive euro fundamentals, and GBP macro weakness, EURGBP presents a high-probability long opportunity. I remain bullish on this pair with a clean 0.87 target in view. Momentum is building, and this setup fits perfectly into a swing trading model with trend continuation potential.

ULTIMA SHOWS SAME PATTERN AS BTC BEFORE EXPLOAD TO THE 100K🔥 Ultima has formed a bullish descending flag pattern on the daily chart. The same pattern led BTC to an explosive rise to $100,000 at the end of the previous year.
This pattern is historically a correction in a bullish trend and breaks to the upside, continuing the rise.
Ultima has been one of the strongest technologically backed tokens this cycle . The token has risen in value by over 1000% from its low in the summer and now, having set a new atx, is consolidating under it, gaining strength for the next momentum.
Last weekend was a strong shakeout for leveraged traders and the price corrected to key support at $15,000. And on top of that, a FVG (Fair Value Gap) formed above, which 99% of the time closes sooner or later.
⚙️ Metrics and indicators:
RSI - hit 16.9, which historically signifies an oversold zone and leads to at least a short-term bounce. The last time the RSI reached these levels, Ultima's price rose 469% in 2 months.
MACD - after a prolonged decline, is now approaching to converge and give a bullish cross section, historically signifying a return to an uptrend.
EMA - price has reached the 200 EMA level on the daily chart and is trying to consolidate above, as we all know, the first test of the 200 EMA in a bull market usually leads to explosive buy impulses.
Volume - the entire correction took place over the weekend on lower volumes, dropping gamblers with shoulders. Major buying followed as early as the weekdays with many times the volume.
🌐 Fundamental:
Ultima is a strong project with a good background in the form of a strong dev and marketing team. The token made it to the top 200 CMC in no time. Holds events all over the world and participates itself, presenting really good products like cryptocard.
And the freshly launched in April, trading bot has increased the trading volume of the token many times, which is perfectly visible on the chart. I think many traders were actively shorting at this time, because despite the huge volumes of buyers, there were no strong upward impulses, so now there is a lot of liquidity at the top. And as we know, the price of an asset moves from liquidity to liquidity, it is its fuel.
📌 Conclusion:
The token is now clearly undervalued by the market by all metrics and technical analysis. So it is expected at least a technical bounce, which it has already started by the way, to close the GAP in the range of $15,357 - $20,240.
I have gained a spot position in the support zone of $13,100 - $14,814, with an average entry price of $13,560 and expect at least a return to the listing peak level, at about $18,959, a consolidation above which would probably mean a new ATH.

BTCUSD: Going for the decisive breakout that opens path to 155,0Bitcoin is almost overbought on its 1D technical outlook (RSI = 69.391, MACD = 3884.400, ADX = 20.801), which during rallies is the starting condition that fuels bullish breakouts and continuations. Such a breakout is about to take place right now as the price is on the LH trendline coming from the ATH. As this chart shows, once Bitcoin breaks over a LH trendline on this Cycle, it has always delivered (much) more upside. Assuming we are currently on the 0.5 Fibonacci level of that breakout, the pattern gives a TP = 155,000.
## If you like our free content follow our profile to get more daily ideas. ##
## Comments and likes are greatly appreciated. ##

4H Bitcoin Chart - What's Next?Bitcoin is currently trading near $105,000, fresh off a historic milestone where it crossed $100,000 for the first time last Wednesday, peaking at an all-time high of $104,000. This breakthrough past the six-figure mark is a big deal, it’s a psychological level that many traders have been watching for years.
Since hitting $104,000, Bitcoin’s price hasn’t just kept climbing, it’s taken a breather. On the 4H timeframe, we’ve seen some back-and-forth action, with the price pulling back from its peak to test lower levels before stabilizing around $105,000. This pullback isn’t unusual after a big breakout; it’s Bitcoin’s way of catching its breath. The chart shows a pattern of higher highs and higher lows over recent weeks, which keeps the uptrend intact, but the latest consolidation hints that the market is deciding its next move.
Key Levels:
The $104,000 mark, the recent all-time high, is now a resistance level (Bitcoin will need some serious buying power to push past it again). On the flip side, $78,000 is a major support level; if the price drops that far, it could signal trouble for the bulls. Closer in, $100,000 might hold as support now that it’s been conquered, while $90,000 and $94,000 could act as stepping stones for any dips or bounces in the near term.
Bitcoin’s price is dancing around its 50, 100, and 200-period moving averages. This clustering suggests a tug-of-war between buyers and sellers, with no clear winner yet. The Relative Strength Index (RSI) has cooled off, dropping to levels we last saw when Bitcoin dipped below $78,000. This could mean the market’s a bit oversold, setting the stage for a bounce if buying picks up. For now, the price ranging near these moving averages might be building a foundation for the next big push.
Market Sentiment:
The vibe around Bitcoin is a mixed bag right now. On one hand, there’s optimism, big inflows into BTC ETFs since the U.S. election and talk of a new SEC chief have people feeling bullish. On the other hand, some traders are cautious, pointing to a bearish RSI divergence on the 4H chart and warning of a possible correction if support levels crack. It’s a classic case of hope versus hesitation, and the chart reflects that uncertainty as Bitcoin hovers in this consolidation zone.
Wrapping it up, Bitcoin at $105,000 is in an interesting spot on the chart. The uptrend is still alive with those higher highs and lows, but this consolidation phase could go either way. If the RSI and moving averages hint at a reversal, we might see a run toward $104,000 or beyond. But if $78,000 gives way, a deeper pullback could be on the cards, keep $90,000 and $94,000 in sight as potential pit stops. Stay sharp and watch these levels, because Bitcoin’s next move could be a big one.

Bitcoin vs Resistance Zones | Fake Breakdown Below the Channel!Bitcoin ( BINANCE:BTCUSDT ) has been moving up and down with high momentum over the past 24 hours and finally fell below the lower line of the ascending channel . Is this break of the lower line of the ascending channel valid?
Bitcoin is trading near the Resistance zone($105,100-$104,140) , Cumulative Short Liquidation Leverage($104,478-$103,941) . Since the volume of breaking of the lower line of the ascending channel is NOT high, the probability of a fake break is very high (in my opinion).
In terms of Elliott Wave theory , the structure of the main wave 4 seems to be an Expanding Flat(ABC/3-3-5) . The main wave 5 could lead to the formation of a new All-Time High(ATH ).
One of the reasons why I think we saw a Fake Break below the lower line of the ascending channel is that I think the S&P500 Index ( SP:SPX ) will trend upward , and given the high correlation between Bitcoin and S&P500 Index these days, we can expect Bitcoin to increase .
I expect Bitcoin to start rising again AFTER breaking the Resistance zone($105,100-$104,140) and touch the targets I have indicated on the chart.
Note: If Bitcoin touches $101,800, we can expect more dumps.
Please respect each other's ideas and express them politely if you agree or disagree.
Bitcoin Analyze (BTCUSDT), 1-hour time frame.
Be sure to follow the updated ideas.
Do not forget to put a Stop loss for your positions (For every position you want to open).
Please follow your strategy and updates; this is just my Idea, and I will gladly see your ideas in this post.
Please do not forget the ✅' like '✅ button 🙏😊 & Share it with your friends; thanks, and Trade safe.

That's where the $BTC 2017 vibes are felt!As we mentioned before, the current cycle that Bitcoin is in is exact

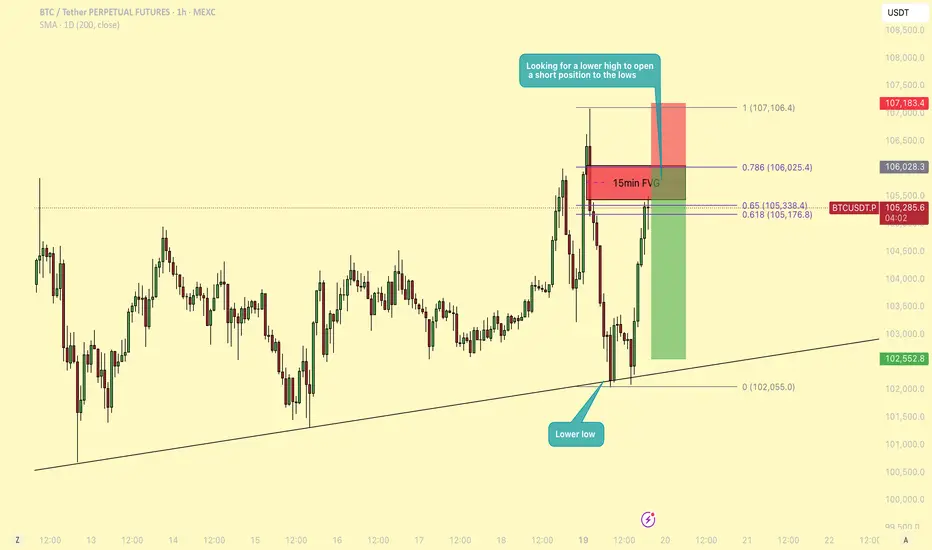
BTC - Will BTC revisit $102k or is a pump imminent?Bitcoin (BTC) has been in a consolidation phase for an extended period, marked by a lack of strong directional momentum and characterized by ranging price action. This type of market environment often leads to both liquidity grabs and choppy movement, and traders need to remain especially vigilant about key levels and structure shifts.
Liquidity grab
Yesterday, BTC managed to sweep the recent highs, grabbing liquidity above a short-term resistance zone before reversing and moving lower. This move appears to have been a classic stop-hunt or liquidity sweep, which was followed by a strong rejection. As price moved down from those highs, it left behind an unfilled gap on the 15-minute chart, what many refer to as a Fair Value Gap (FVG). This gap now acts as a magnet for price and is a key area to watch as we approach it again.
Market structure
On the 1-hour timeframe, BTC has now printed a lower low, suggesting a short-term shift in market structure to the downside. This structural break opens up the possibility for a lower high to form, setting up a classic trend continuation scenario. From a technical standpoint, the expectation would be for BTC to now create a lower high and then push lower, potentially targeting the range lows from yesterday and today. This provides an opportunity for a short setup with a favorable risk-to-reward (RR) ratio, estimated to be around 3:1, if the entry and stop are managed around the key resistance and structural levels.
Fibonaccy that aligns with the FVG
Currently, BTC is sitting at the Golden Pocket, the region between the 0.618 and 0.65 Fibonacci retracement levels. This area often serves as a reaction zone for price, and we are seeing some hesitation here. Interestingly, this Golden Pocket sits just below the aforementioned 15-minute FVG, and price appears to be gravitating toward this inefficiency, potentially looking to fill it before making a more decisive move.
What adds to the confluence at this level is the 0.786 Fibonacci retracement, which aligns almost perfectly with the top boundary of the Fair Value Gap. While many traders look to enter short positions at the 50% mark of the FVG, this added confluence makes the 0.786 + FVG top zone a more compelling entry point. This would allow for a tighter stop just above the gap or structure high, and thus improves the risk-to-reward ratio slightly compared to a more conservative FVG entry.
Conclusion
In summary, the plan would be to wait for BTC to either fill the FVG and reach the 0.786 level or show strong rejection signs there. A rejection from this zone would confirm the lower high thesis and offer a solid short setup aiming for a move back to the range low. With the current setup, market structure, and confluence levels lining up, this trade idea presents a tactical opportunity with clear invalidation and high RR potential.
Fancy a cup of tea luv?This is the story of how Susan convinced her husband Frank to buy 3 Bitcoins at 105k..
Plus the story of Bitcoin going to a minimum of 126k before the end of May!
A giant Cup & Holder beginning way back in 2021 is a 75% sure prove of that!
What more do you need Frank!?
That's good odds right there for ya!

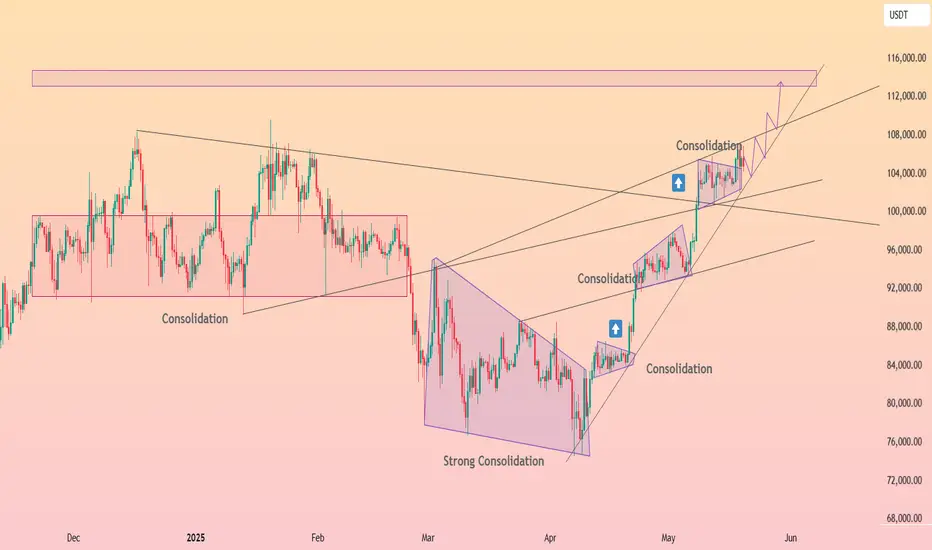
HolderStat┆BTCUSD channel grind toward 110 kCRYPTOCAP:BTC price has stair-stepped out of March’s strong consolidation triangle and is now travelling inside a neat rising channel. Each mini flag has resolved higher, with the latest squeeze holding the mid-line near 102 k. As long as that trend-line underbelly and the diagonal support from April lows remain intact, bulls retain control and can probe the 108-110 k supply zone highlighted on the chart. Only a daily close back inside the lower rail would threaten the current bullish momentum.
btc . w4 . may . wOpen . LONGto catch everyone of guard, whom thinks we're crashing today:
. LONG: look for good tpo at nyOpen, of running aLow and pump to liquidate and grab liquidity
. SHORT: still on the table - but the LONG could be a runner

btc . w4 . may . wOpen . SHORTideally :
. good tpo and price not finding a floor during ny
SHORT
. ladder limits
. start pw.0.5
. end pwVAH - pdEQ
. withhold 30% of total order to add upon trade confirmation
. tp1 +1.5%
. tp 2 . mOpen . 94133.6 + 9%
- ride the momentum shift downwards

Bitcoin Not Looking Good At AllSome degree of 5 waves completed yesterday and reversal signs are there. Now, this 5 waves up could be just 1st leg of larger 5th or the 5th itself since this leg was 2.6 times of leg 1. Either way, we are heading towards 90K and if this was larger 5th that got complete then it's time for "serious worry", specially if you are a HODLer.

$BTC - Lower Timeframe OutlookCRYPTOCAP:BTC | 1h
Didn't expect such a strong rejection, another push back to 107k now seems unlikely
If we get a reaction at 102k to 101.5k ( val) , we might see a complacency bounce into 104.5k–105.3k to fill some inefficiencies.
That'd be a solid short, targeting 95k–94k

Bitcoin Retests Ascending Trendline After BreakoutBTCUSD daily chart shows price action respecting a rising trendline, following a successful breakout from previous pattern. This ascending trendline now acts as a key dynamic support and serves as a central guide for the medium-term bullish structure.
Currently, price is consolidating just below the $107,000 resistance area. There are two primary scenarios to consider:
Bullish Scenario:
A confirmed breakout and daily close above the $107,000 resistance could trigger another bullish leg, targeting the next level near $120,000.
Mild Bearish / Pullback Scenario:
If the price gets rejected again, it may retrace towards the ascending trendline around $95,000, which aligns with previous horizontal support and could serve as a solid buy-the-dip zone.
Trade Plan:
Buy Entry Option 1: On a breakout above $107,000 → Target: $120,000
Buy Entry Option 2: On a bounce from the trendline near $95,000

$BTC up to $107-108k?While I do think CRYPTOCAP:BTC will ultimately still see a larger correction, I can't deny that the chart looks bullish here.
I think we're likely to see a final move over the next week or two up to $107k-108k to retest the prior highs. I think the middle resistance at $108,183 is the most likely target for the move.
After we hit that, that's where I'll start to position short on BTC.
Let's see how it plays out over the next week or two.

btc . recap . w3 . maymon to eager . wait mon to show its hand - cw!
. early LONG compound because of the bullish outlook
- tp2 108462
tue didn't ride momentum - blind bullish
. tp1 HIT
. missed SHORT at 10pm (UTC+2)
- should have traded the momentum of mon looking to form support during the week later . for more compound LONG
wed mid of range . cw
. no trade zone
thu
. waiting for run of aLow during ny
. compound LONG - 101485
. tp1 HIT
fri didnt catch enough upward momentum
. tp1 HIT
. last limit order for bullish continuation . tpo - 102862.5
wknd
. tp1 for weekly LONG idea finally hit
. duration 5d 22h
. +4.33%
conclusion :
trade what you see, go with momentum, but have a narrative.
outlook :
america downgraded from AAA to AA+ . People will turn hardcore bearish, once the price starts falling. this could be the trigger to find the long awaited drop - while having retail call out a bearmarket . massive potential here, to both sides. wOpen and monday full data (while keeping an close eye on tpo and footprint charts), are key .

BTC - Will the trend continue?Since the beginning of April, BTC has been on a notable upward trajectory, showing impressive strength with minimal retracements. This sustained momentum has captivated market participants and built a narrative of continued bullish pressure. Along this journey, BTC has carved out two distinct consolidation zones, periods of relative price stability, characterized by equal highs and lows. Each time, these consolidations were followed by a decisive breakout to the upside, reinforcing the prevailing bullish sentiment in the market.
Another consolidation phase
At the present moment, BTC appears to be entering yet another consolidation phase. The price is coiling, showing signs of compression that often precede significant moves. This naturally leads to the question: are we about to witness another breakout to the topside, continuing the pattern established over the past several weeks?
Bullish scenario
In a bullish scenario, a breakout to the upside would likely see BTC pushing towards the 106,000 level. This zone is a key target for traders watching in this consolidation. Should momentum carry the price beyond this threshold, Bitcoin would be well-positioned to challenge its all-time high near 109,000. A clean move through these resistance levels could spark a new wave of optimism, potentially attracting fresh capital into the market and confirming the strength of the current uptrend.
Bearish scenario
However, it’s important not to ignore the risks. The bearish scenario involves BTC breaking down below the current support zone, which sits around the 101,000 mark. A decisive move beneath this level would undermine the bullish structure and signal a shift in market sentiment. In this case, Bitcoin might find itself revisiting the 97,000 to 98,000 range, an area that previously acted as resistance during the last consolidation phase and may now serve as a potential support zone if tested from above.
Conclusion
In essence, the market is at a critical juncture. BTC’s recent behavior suggests a buildup toward a significant move, but the direction remains uncertain. Whether it continues its march toward new highs or corrects to retest lower levels, this period of consolidation is likely to define the next phase of Bitcoin’s trend. Traders and investors alike are watching closely, as the next breakout, up or down, could set the tone for the weeks to come.
Thanks for your support.
- Make sure to follow me so you don't miss out on the next analysis!
- Drop a like and leave a comment!

BTC road to $28k BTC finished it is upwave move from 15k to 110k
Next is the flush crash. The first zone is 66k then bounce then flush crash to $28-27k then the road to the $1M start and market bull-run that many have been waiting for in altcoins while altcoins been bleeding hard since December many traders avg wallets are -70% while even BTC at 100k zone.

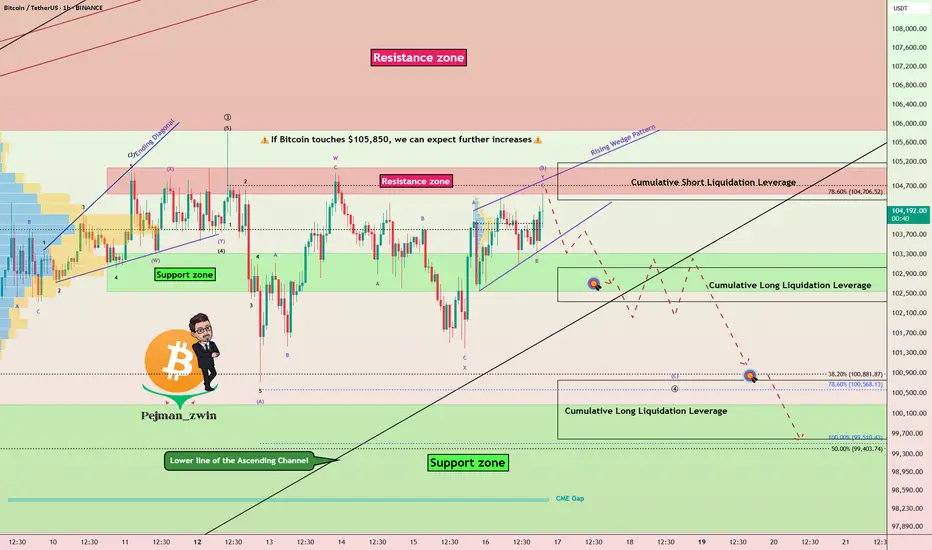
Bitcoin at Resistance With Weak Momentum-Bearish SetupBitcoin ( BINANCE:BTCUSDT ) finally reached the Resistance zone($105,100-$104,520) as I expected yesterday. Of course, the way Bitcoin reached the resistance zone was NOT with high momentum , so I decided to share this analysis with you.
In terms of Classic Technical Analysis , Bitcoin appears to have formed a Rising Wedge Reversal Pattern between Support zone($103,320-$102,600) and Resistance zone($105,100-$104,520) over the past few hours .
In terms of Elliott Wave theory , given Bitcoin’s low momentum and the Heavy Cumulative Short Liquidation Leverage($105,180-$104,412) ahead of Bitcoin, it appears that Bitcoin has completed microwave B of the main wave 4 with a Double Three Correction(WXY) .
I expect Bitcoin to decline to at least $102,800 at the first target AFTER breaking the lower line of the Rising Wedge Pattern, and if the Support zone($103,320-$102,600) and lower line of the ascending channel(Major) are broken, we should expect a drop to Cumulative Short Liquidation Leverage($100,763-$99,600) .
Note: If Bitcoin touches $105,850, we can expect further increases.
Please respect each other's ideas and express them politely if you agree or disagree.
Bitcoin Analyze (BTCUSDT), 1-hour time frame.
Be sure to follow the updated ideas.
Do not forget to put a Stop loss for your positions (For every position you want to open).
Please follow your strategy and updates; this is just my Idea, and I will gladly see your ideas in this post.
Please do not forget the ✅' like '✅ button 🙏😊 & Share it with your friends; thanks, and Trade safe.
BTC - Poised for Breakout or Pullback at $103,000Bitcoin's price action shows a pattern of higher lows, hinting at underlying bullish pressure, though it has struggled to break through the $105,000 resistance level, a key ceiling that has rejected price advances before. Support is holding firm at $100,000, a psychologically significant level, with another layer of support near $95,000 if selling pressure increases. The candlesticks on this timeframe display some indecision, with dojis appearing alongside modest bullish candles, suggesting traders are still weighing their next move.
Technical Analysis:
The 50-period moving average (MA) sits around $102,500 and is sloping upward, acting as a dynamic support that the price is currently testing. The 200-period MA, positioned near $98,000, offers a deeper safety net and reinforces the longer-term bullish trend. The Relative Strength Index (RSI) is at 60, showing decent momentum without entering overbought territory (above 70), which leaves room for potential upside. However, the Moving Average Convergence Divergence (MACD) tells a slightly different story, with a recent bearish crossover where the MACD line dips below the signal line, hinting at fading momentum. Keep an eye on whether the MACD flips bullish again or if the price breaks $105,000 to signal a stronger trend.
Many traders are encouraged by Bitcoin’s resilience and recent whale accumulation, where large holders have been scooping up BTC, suggesting confidence in future gains. News of institutional buying and favorable macroeconomic shifts (like potential easing of global monetary policies) adds to the bullish case. That said, there’s some caution in the air, with concerns about high U.S. interest rates and economic uncertainty possibly curbing Bitcoin’s momentum. The balance of these factors keeps sentiment positive but tempered, with traders watching for catalysts that could spark the next big move.
So, a clean break above $105,000 could ignite a rally toward the all-time high of $109,000, with some even eyeing $120,000 if momentum builds. On the flip side, a drop below $100,000 might see prices slide to $95,000, where buyers could step in to defend the trend.

Monitoring USDT- Absolutely not a prediction.
- Just doing this chart to observe 1D (smaller timeframe) on USDT Dominance & Sharing.
- I usually like to use larger TF to reduce the noise on charts ( 1W, 2W, 1M, 3M ).
- USDT.D have to break out 8.4% before 13th December.
- if it does, could mean BTC more downward pressure.
- if it fails, BTC could rally up.
- Patience is the key.
Happy Tr4Ding !

Bitcoin Warning - Breakout or Fakeout?BTC has been resilient and trying to establish a 100K base.
I think BTC is going to perform a liquidity sweep by briefly breaching ATH's before it has a correction / sell wave back down to $75-$78K level.
I'd be cautious trying to buy the breakout if we try for it in the next couple weeks.
After this correction BTC will likely pursue New all time highs in 2026.
$120K -$130K should be very easy to obtain in 2026 with possibility of a far greater overshoot.
