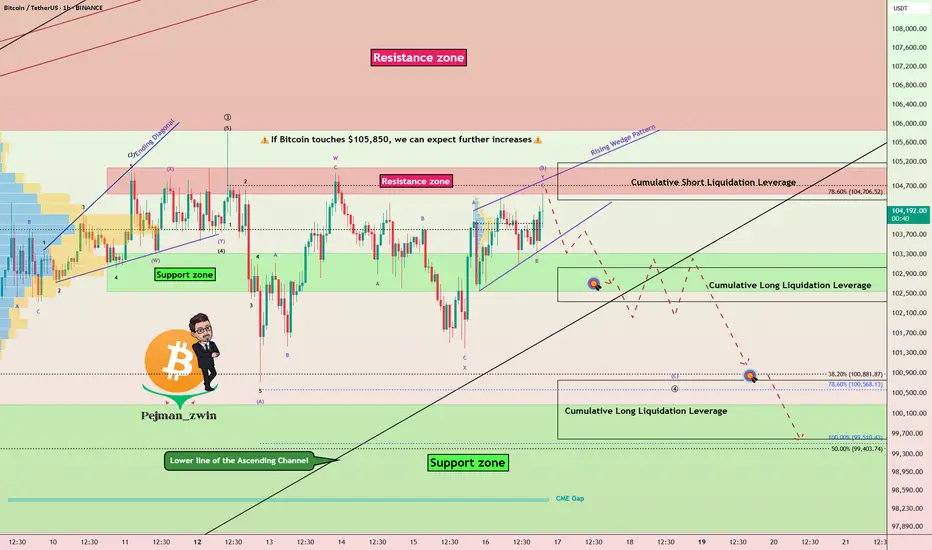
Bitcoin at Resistance With Weak Momentum-Bearish SetupBitcoin ( BINANCE:BTCUSDT ) finally reached the Resistance zone($105,100-$104,520) as I expected yesterday. Of course, the way Bitcoin reached the resistance zone was NOT with high momentum , so I decided to share this analysis with you.
In terms of Classic Technical Analysis , Bitcoin appears to have formed a Rising Wedge Reversal Pattern between Support zone($103,320-$102,600) and Resistance zone($105,100-$104,520) over the past few hours .
In terms of Elliott Wave theory , given Bitcoin’s low momentum and the Heavy Cumulative Short Liquidation Leverage($105,180-$104,412) ahead of Bitcoin, it appears that Bitcoin has completed microwave B of the main wave 4 with a Double Three Correction(WXY) .
I expect Bitcoin to decline to at least $102,800 at the first target AFTER breaking the lower line of the Rising Wedge Pattern, and if the Support zone($103,320-$102,600) and lower line of the ascending channel(Major) are broken, we should expect a drop to Cumulative Short Liquidation Leverage($100,763-$99,600) .
Note: If Bitcoin touches $105,850, we can expect further increases.
Please respect each other's ideas and express them politely if you agree or disagree.
Bitcoin Analyze (BTCUSDT), 1-hour time frame.
Be sure to follow the updated ideas.
Do not forget to put a Stop loss for your positions (For every position you want to open).
Please follow your strategy and updates; this is just my Idea, and I will gladly see your ideas in this post.
Please do not forget the ✅' like '✅ button 🙏😊 & Share it with your friends; thanks, and Trade safe.
Btc-bitcoin
BTC - Poised for Breakout or Pullback at $103,000Bitcoin's price action shows a pattern of higher lows, hinting at underlying bullish pressure, though it has struggled to break through the $105,000 resistance level, a key ceiling that has rejected price advances before. Support is holding firm at $100,000, a psychologically significant level, with another layer of support near $95,000 if selling pressure increases. The candlesticks on this timeframe display some indecision, with dojis appearing alongside modest bullish candles, suggesting traders are still weighing their next move.
Technical Analysis:
The 50-period moving average (MA) sits around $102,500 and is sloping upward, acting as a dynamic support that the price is currently testing. The 200-period MA, positioned near $98,000, offers a deeper safety net and reinforces the longer-term bullish trend. The Relative Strength Index (RSI) is at 60, showing decent momentum without entering overbought territory (above 70), which leaves room for potential upside. However, the Moving Average Convergence Divergence (MACD) tells a slightly different story, with a recent bearish crossover where the MACD line dips below the signal line, hinting at fading momentum. Keep an eye on whether the MACD flips bullish again or if the price breaks $105,000 to signal a stronger trend.
Many traders are encouraged by Bitcoin’s resilience and recent whale accumulation, where large holders have been scooping up BTC, suggesting confidence in future gains. News of institutional buying and favorable macroeconomic shifts (like potential easing of global monetary policies) adds to the bullish case. That said, there’s some caution in the air, with concerns about high U.S. interest rates and economic uncertainty possibly curbing Bitcoin’s momentum. The balance of these factors keeps sentiment positive but tempered, with traders watching for catalysts that could spark the next big move.
So, a clean break above $105,000 could ignite a rally toward the all-time high of $109,000, with some even eyeing $120,000 if momentum builds. On the flip side, a drop below $100,000 might see prices slide to $95,000, where buyers could step in to defend the trend.

Monitoring USDT- Absolutely not a prediction.
- Just doing this chart to observe 1D (smaller timeframe) on USDT Dominance & Sharing.
- I usually like to use larger TF to reduce the noise on charts ( 1W, 2W, 1M, 3M ).
- USDT.D have to break out 8.4% before 13th December.
- if it does, could mean BTC more downward pressure.
- if it fails, BTC could rally up.
- Patience is the key.
Happy Tr4Ding !

Bitcoin Warning - Breakout or Fakeout?BTC has been resilient and trying to establish a 100K base.
I think BTC is going to perform a liquidity sweep by briefly breaching ATH's before it has a correction / sell wave back down to $75-$78K level.
I'd be cautious trying to buy the breakout if we try for it in the next couple weeks.
After this correction BTC will likely pursue New all time highs in 2026.
$120K -$130K should be very easy to obtain in 2026 with possibility of a far greater overshoot.

Avax Buy IdeaTo a Classical Chart trader this has flash a buy signal.
I add candlestick to my trading plan, so, today candle closing will finish the whole story for me.

BTCUSDT: The ‘Parabolic Channel’ Play – $250 K to $500 K … then?⚙️ Chart Specs
Ticker / Pair: BTCUSDT
Time-Frame: 1W (log scale)
Indicators: Ichimoku Cloud (default), 7-year logarithmic channel, long-term trend-lines & Fib extensions
Date of publish: 17 May 2025
1️⃣ Macro Context
Bitcoin just printed a decisive weekly close above the mid-line of its 2017-2025 log channel while the Ichimoku Cloud has flipped full-bull (span A > span B). Post-2024 halving supply shock + macro liquidity rotation = strong tail-wind.
2️⃣ Projected Path
Phase Target zone % from breakout Key confluence
Break & sprint $255-270 K ~+140 % Vacuum above former ATH; minimal supply
Euphoria stretch $375 K ~+250 % Channel ceiling + 2.0 Fib
Blow-off wick $500-520 K ~+380 % 2.618 Fib extension + typical overshoot
Dashed white arrows on the chart sketch the base-case impulse and an optional “melt-up” extension.
3️⃣ Post-parabola Retrace
Historical cycles point to a -50 ~ -60 % draw-down once the upper red rail is tagged. I’m watching:
$255-250 K → first liquidity pocket / mid-channel
$215-210 K → 0.5 Fib retrace of the entire move
Either zone could reset weekly momentum while preserving the uptrend.
4️⃣ Invalidation Levels
Weekly close < $92 K → breakout failure → bias flips neutral, potential slide to red mid-line ~$75 K.
Close below channel base $60 K → macro thesis void, shift to bear bias.
5️⃣ Illustrative Trade Plan (not financial advice)
Leg Entry TP(s) Stop
Impulse swing Weekly close > $120 K $255 K / $375 K Weekly close < $92 K
Blow-off punt Break > $375 K on volume Trail toward $500 K 2-week trailing low
Retrace reload Bullish SFP at $255-210 K Ride next cycle Close < $200 K
📝 Take-aways
Base target sits in the $250 K region; exuberant extension eyes $500 K.
Expect aggressive mean reversion once the upper rail is hit.
Clear invalidations help keep emotions in check amid extreme volatility.
⚠️ This is an educational study,

Bitcoin Daily BullflagA bullflag on the daily chart for BTCUSD suggesting price will move higher in which a bullflag is a bullish pattern indicated by the name
I think Bitcoin will still move up but alts will outperform with this next move
Daily chart

Does bitcoin want to take liquidity at lower levels before moon?BTC is ranging with a volume gap below. The volume gap below suggests that there is no liquidity until 98k. If the market wants to hunt for liquidity before going to the moon, that is where it will go.
Full TA: Link in the BIO

BTCUSD Can it do this one more time?Bitcoin / BTCUSD is on a strong 1week MA50 rebound, while staying inside the Channel Up from the Cycle bottom and holding the 1week RSI Support.
Last time it did that was during the 2015-2017 Bull Cycle.
In fact it was May 2017 when the price started rising aggressively and eventually broke above the Channel Up into a relentless parabolic rally until the end of the year.
With the Cycle seemingly identical, do you think Bitcoin can do this one more time?
Follow us, like the idea and leave a comment below!!

btc + $200kBitcoin's absolute focus is +$200k and beyond.
I think the 2024\2025 local peak has not been seen yet and we may see a peak around + $200k .

btc . may . w3 . friyesterdays LONG was beautiful. ny ran aLow, and never looked back pushing higher.
. new aver entry . 102353
i'm right now scalling into new limit LONGs
. aLow . wVWAP . cw0.5 . liquidity grad - in this BULLISH environment
a last limit order is placed at pdTPO
. 102862.5
SL has been lifted to give new trade breathing room
i see us go to cwHigh . 105871, to which tp1 has been changed.
cheers

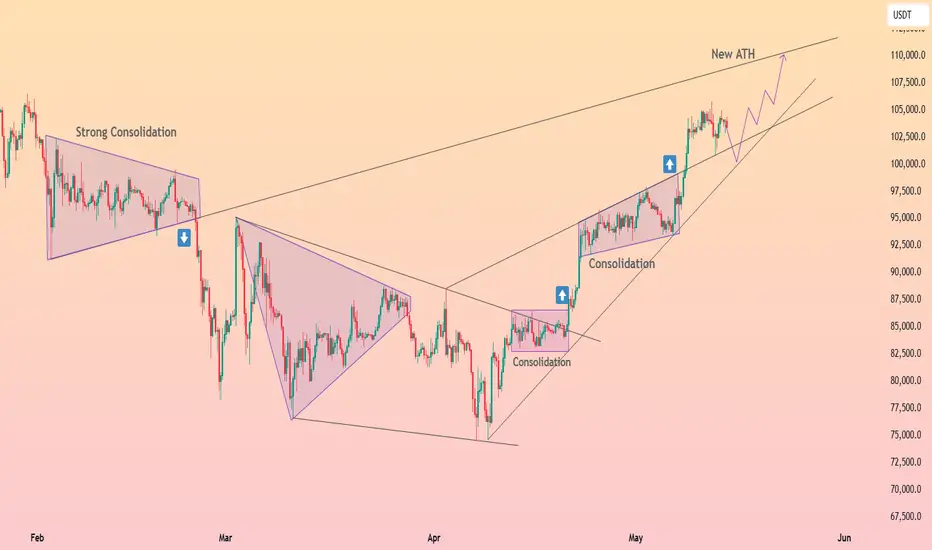
BITCOIN Stairway to 134k.Bitcoin (BTCUSD) is unfolding a very interesting pattern since its April 07 bottom. That was at $74500 and since that level, it has been consistently targeting all 10k intervals above it: From 74k to 84k, 94k and is now on 104k.
Once it hit all those levels, the price consolidated, forming a very structured Channel Up. Now, the Channel Up may not hold forever but this consistency gives us the idea that it can continue targeting all those levels above it: 114k, 124k, 134k. If this pattern continues to hold for as much time as it has since the bottom, then we may see $134k by late June/ early July.
Do you think it is possible to stay this consistent for that long? Feel free to let us know in the comments section below!
-------------------------------------------------------------------------------
** Please LIKE 👍, FOLLOW ✅, SHARE 🙌 and COMMENT ✍ if you enjoy this idea! Also share your ideas and charts in the comments section below! This is best way to keep it relevant, support us, keep the content here free and allow the idea to reach as many people as possible. **
-------------------------------------------------------------------------------
💸💸💸💸💸💸
👇 👇 👇 👇 👇 👇

Bitcoin Ascending Triangle (4H)BINANCE:BTCUSDT might be forming an ascending triangle on the 4H chart, with a horizontal resistance at $105k and support being the resistance of the broadening wedge we identified last week: Bitcoin Ascending Broadening Wedge (4H)
A sustained break above $105k would set the target at $109k, very close to ATH.

BTCUSD: This is a one way trip to $150k.Bitcoin is rising towards the overbought barrier on its 1D technical outlook (RSI = 68.126, MACD = 4169.000, ADX = 23.891) and that has rearely been a problem in the past as the market tends to thrive on overbought conditions. The minimum rally it delivered after a 1W MA50 rebound (like the one it is on now) has been +100%. TP = 150,000 by the end of summer.
## If you like our free content follow our profile to get more daily ideas. ##
## Comments and likes are greatly appreciated. ##

Bitcoin at PRZ! Is This the Calm Before a Drop?As I expected in yesterday's idea , Bitcoin ( BINANCE:BTCUSDT ) started to rise from near the Support line and hit the Target .
Bitcoin is trading near the Potential Reversal Zone(PRZ) , the upper line of the ascending channel(minor) , and the Resistance line .
In terms of Elliott Wave theory , it seems that Bitcoin has successfully completed the microwave B of the main wave 4 in the ascending channel(minor). A break of the lower line of the ascending channel(minor) could be a sign of the completion of this wave. The corrective structure of the main wave 4 so far could be a Zigzag(ABC/5-3-5) .
I expect Bitcoin to drop to at least $100,923 AFTER breaking the lower line of the ascending channel(minor) and breaking the Support line, the next target could be the lower line of the ascending channel(major) .
Cumulative Short Liquidation Leverage: $106,943-$105,913
Cumulative Short Liquidation Leverage: $105,525-$104,500
Cumulative Long Liquidation Leverage: $100,763-$99,774
Note: If Bitcoin goes above $105,300, we can expect more pumps.
Note: If Bitcoin touches $99,400, we should expect further declines.
Please respect each other's ideas and express them politely if you agree or disagree.
Bitcoin Analyze (BTCUSDT), 1-hour time frame.
Be sure to follow the updated ideas.
Do not forget to put a Stop loss for your positions (For every position you want to open).
Please follow your strategy and updates; this is just my Idea, and I will gladly see your ideas in this post.
Please do not forget the ✅' like'✅ button 🙏😊 & Share it with your friends; thanks, and Trade safe.

HolderStat┆BTCUSD channel run to 115kAfter February’s strong consolidation wedge cracked, Bitcoin price rebounded, carving a fresh ascending channel that sits snug on wedge support above 100 k. Each mini‑consolidation has resolved higher, and the current leg projects into the 112‑115 k new‑ATH rail drawn on the chart. Pullbacks toward 100‑102 k are structurally healthy so long as the lower trend‑line stays intact, keeping the broader BTC breakout narrative alive.
btc . may . w3 . thuin retrospect
- SHORT towards 2pm (UTC+2) . into wOpen + fib resis - was the TOD
- compounding LONG gave a new avg LONG
entry . 102586
sl . 100017
tp1 . 104576
tp2 . 105871
for bullish continuation, price around 2pm needs to be a support zone.
if we see it the other way around, we could rotate to lower prices.
if price breaks out above 102586, we TRAP NEW SHORTS - which came in at 102100 . 20mil vol . push price back into 0.75% weekly range for tp1

Bitcoin Will Like Decline: Institutional Traders are SellingFenzoFx—Bitcoin is overbought, as indicated by the Stochastic Oscillator. Meanwhile, 52 percent of institutional traders are holding sell positions.
If resistance between $106,000 and $109,000 holds, the price may drop toward $96,000.

BTC (Y25.P2.E2). Ideal scenarioHi Traders,
As per the chart, the VAH is the main resistance so another dip might be the catalyst required to break through it.
Difficult to say if we sweep the highs first at 106k range for liquidity for a nice short or sweep the lows first.
All the Best
SSari
SMALLER TIME FRAME
in a range to trade

btc . wednesday . may . w3yesterday
. no LONG - only at bigger retracement - didnt come
. no SHORT - as 10pm (UTC+2) has recently been a little unpredictable
today - wednesday - LIQUIDITY + VOLATILITY ?!
. no SHORT - as we are nowhere price opportunity wise + BULLISH outlook
. yes COMPOUND LONG . I had wanted to see the drop towards 2pm (UTC+2) - run yesterdays NewYork low and push up . didnt happen, but as I was waiting for the level, I had limit orders prepared of which 4 triggered during LondonSession
. additional little compound now prepared at 103622 - LPOC + VWAP
- bullish continuation . price is consolidating and momentum of this week is turning to the upside
- bearish continuation . see a rejection here at dOpen + wOpen . have price loose its cwLow . catch everyone of guard (unlikely by the outlook, but neverless)
Just get the crypto $total to 10T alreadybig grid shows massive upside inbound, cryptoad says we just had nearly all of 2025 to accumulate before a massive liquidity injection that will push the entire crypto market towards 10T mcap!

btc vs. ethBitcoin vs. Ethereum 🔃
It is obvious that Ethereum has not yet made a real run compared to other cycles compared to Bitcoin, and I think that the current correlation gap will close in the coming period.

Bearish sign but we think it pushes to MAJOR RESISTANCEYesterday CRYPTOCAP:BTC formed a BEARISH ENGULFING. We've spoken on this pattern countless times.
However, we didn't bring it up because we didn't/don't think it's relevant.
WHY? Look at the paltry volume. Bitcoin volume is SUPER LOW.
BTC is still in Bullish mode from Late 2022.
---
We turned Bullish again on CRYPTOCAP:BTC around early April:
A) We saw that huge Bitcoin selloff 4/7
2) Which reversed that same day
3) Followed by some buying a couple days later
4) More BTC accumulation 4/21 when it was under 88k
Major resistance coming up soon.
Pause HIGHLY LIKELY.
