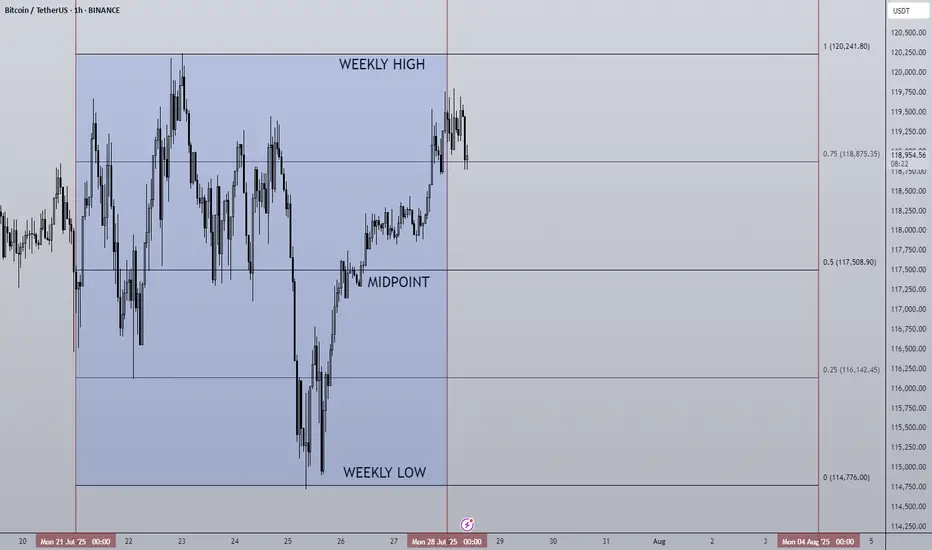
28/07/25 Weekly OutlookLast weeks high: $120,241.80
Last weeks low: $114,776.00
Midpoint: $117,508.90
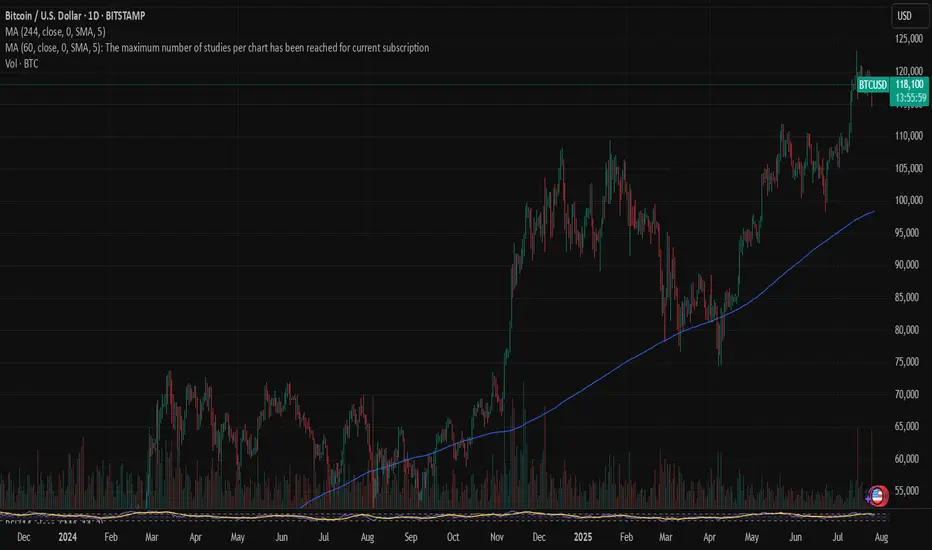
As we approach the end of the month BTC continues to trade sideways during a cooling off period as altcoins finally take the stage. Last week Bitcoin saw a relatively flat net inflow via ETFs of $72m, ETH on the other hand posted the second largest net inflow week ever at $1.85B! The concentration has certainly shifted...
This IMO is still a very bullish structure for BTC, very shallow pullbacks being bought up/absorbed by still happy to purchase at these levels. As long as this continues altcoins have a strong base to continue growing on, if BTC breaks structure and price accepts below ~$110,000 then the altcoin rally will be over for now I believe.
This week some major altcoins are set to reach HTF resistance areas, ETH has already tagged $4,000 which looks to be a battleground level of major importance.
TOTAL2 which is the combined market cap of all altcoins is currently ~8% from the highs, keeping this in mind for where altcoins may run out of steam...
Good luck this week everybody!
BTC-D
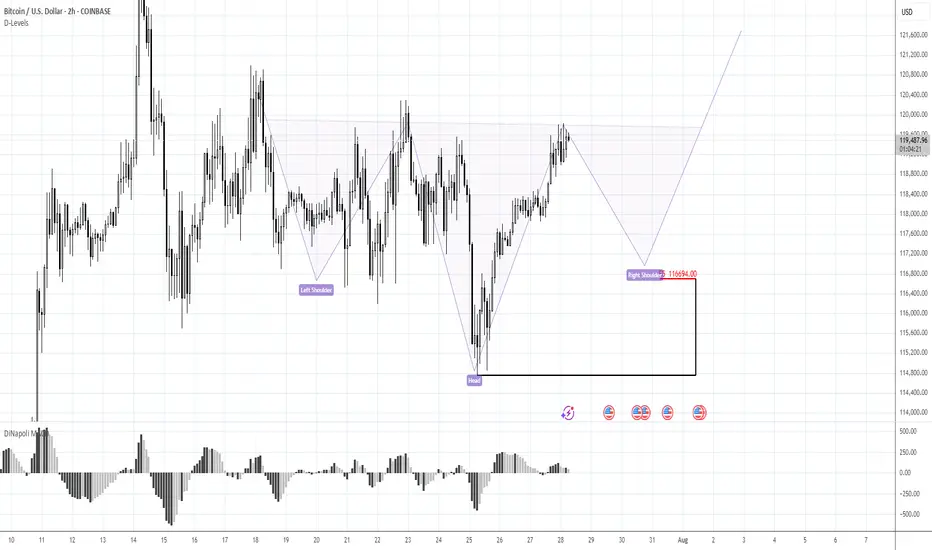
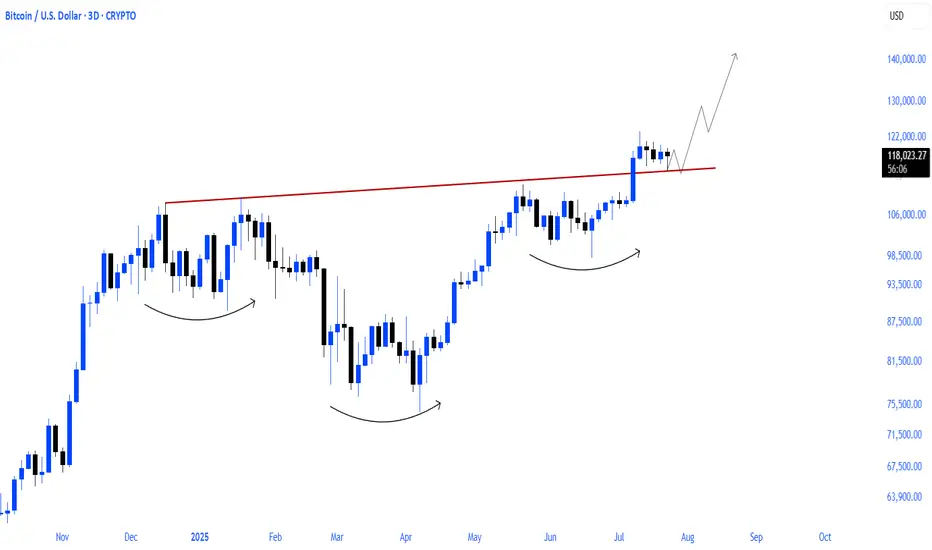
BTC 116.70K stands in focusMorning folks,
Once we've prepared the analysis, we've got upsetting squeeze down, thanks to Galaxy massive sell-off. I don't know what they were trying to do - either hunted for stops under 116K, or just sold in most unwelcome moment... but unfortunately such an issues are out of our control.
For now - BTC totally reversed this sell-off and once again shows positive sentiment. Now we consider same reverse H&S pattern, but this time of a bigger scale. 116.70K support area, where, the right arm should be formed now stands in our focus for long entry. We consider no shorts by far. Hopefully no more tricks will follow from old Donny or somebody else...
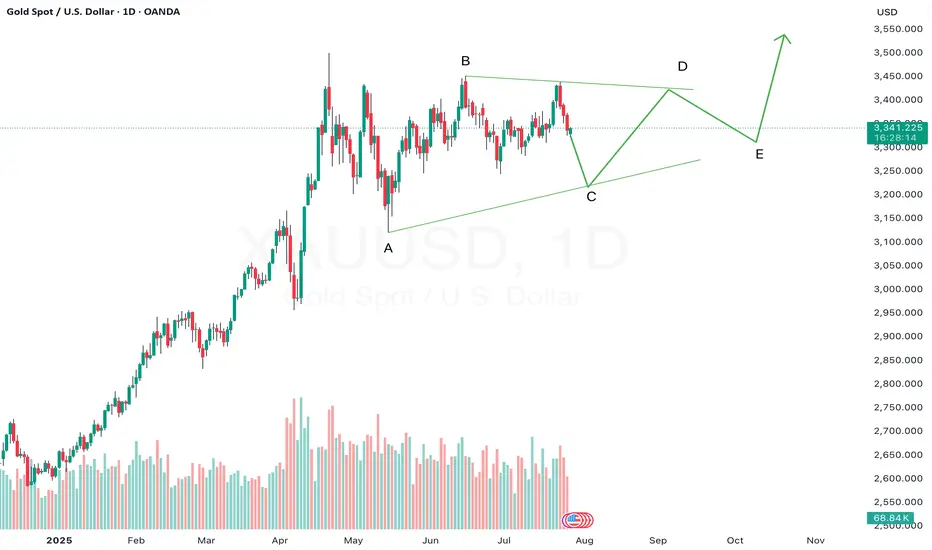
Gold may still be unfolding Wave C of a triangle — don’t rushGold appears to be forming a contracting triangle pattern, and we could currently be in the midst of Wave C. In a triangle structure (A-B-C-D-E), Wave C typically unfolds as a corrective move and is often mistaken for a potential breakout phase.
However, triangles are continuation patterns, and premature entries can lead to whipsaws or false breakouts. If Gold is indeed still in Wave C, we can expect further choppy, sideways movement before the pattern completes with Waves D and E.
Patience is key — let the structure mature. A more reliable opportunity may emerge after the triangle resolves and the larger trend resumes.
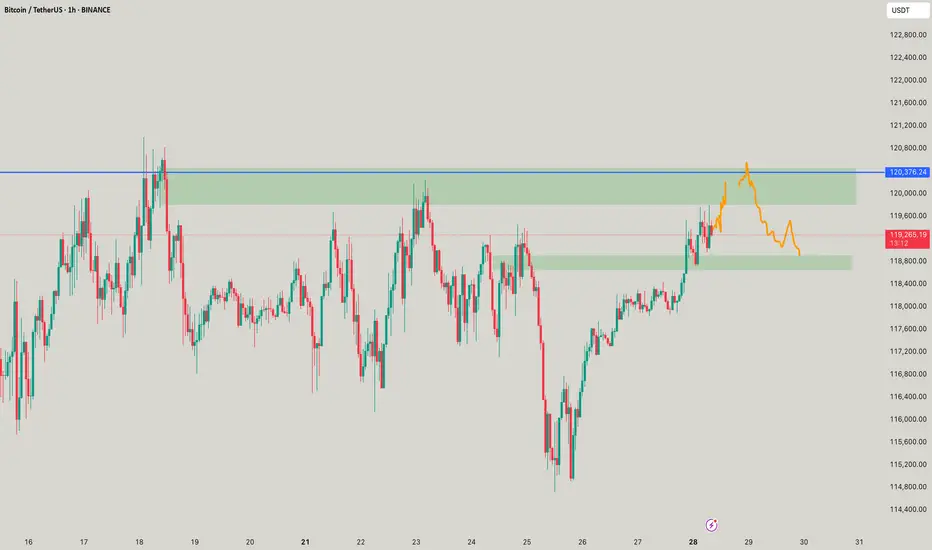
BTC - When 130k?This is BTC, As mentioned, has hit 119,540 and above, will make moves like this till 120,376 to max 120,578 and there if it breaks 120,578 in 1H and close above, then we see good move or we see a fountain which I call as waterfall.
THE TRUTH ABOUT DOGECOINDogecoin is looking really toppy. As you can see the RSI has peaked out early before a new high which is alarming. I think Doge is in serious trouble here as the meme craze starts to shift into newer memes. If the head and shoulders pattern plays out you're looking at a catastrophic drop down to 2 tenths of a penny. Doge is EXTREMELY overvalued and needs to come back down to earth. Don't forget there is close to 15 million Doge mined per day forever. It appears with the way the RSI peaked and price didn't break the high that Doge has reached a plateau in price even if the market cap continues to go up.
Not financial advice just my opinion.

Bullish continuation?The Bitcoin (BTC/USD) has bounced off the pivot and could rise to the 1st resistance.
Pivot: 116,724.27
1st Support: 111,336.90
1st Resistance: 123,341.37
Risk Warning:
Trading Forex and CFDs carries a high level of risk to your capital and you should only trade with money you can afford to lose. Trading Forex and CFDs may not be suitable for all investors, so please ensure that you fully understand the risks involved and seek independent advice if necessary.
Disclaimer:
The above opinions given constitute general market commentary, and do not constitute the opinion or advice of IC Markets or any form of personal or investment advice.
Any opinions, news, research, analyses, prices, other information, or links to third-party sites contained on this website are provided on an "as-is" basis, are intended only to be informative, is not an advice nor a recommendation, nor research, or a record of our trading prices, or an offer of, or solicitation for a transaction in any financial instrument and thus should not be treated as such. The information provided does not involve any specific investment objectives, financial situation and needs of any specific person who may receive it. Please be aware, that past performance is not a reliable indicator of future performance and/or results. Past Performance or Forward-looking scenarios based upon the reasonable beliefs of the third-party provider are not a guarantee of future performance. Actual results may differ materially from those anticipated in forward-looking or past performance statements. IC Markets makes no representation or warranty and assumes no liability as to the accuracy or completeness of the information provided, nor any loss arising from any investment based on a recommendation, forecast or any information supplied by any third-party.

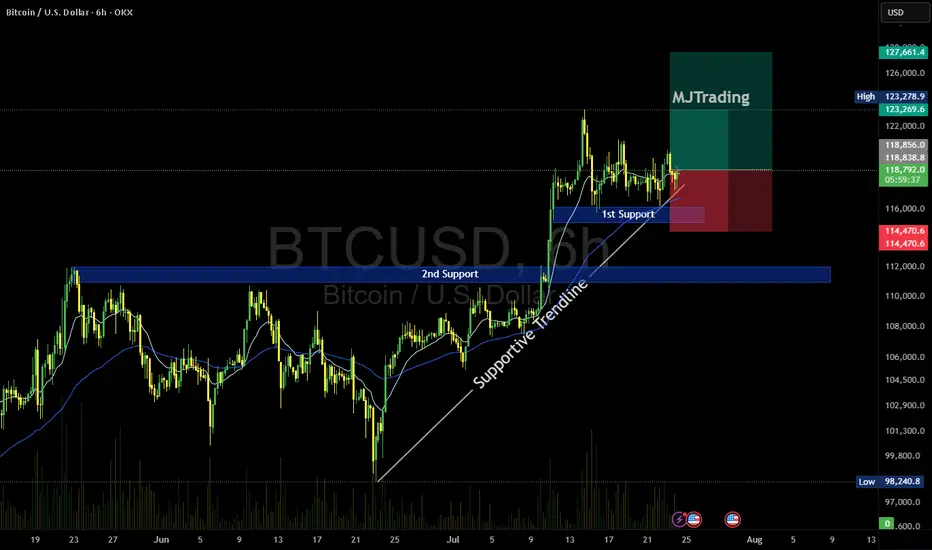
BTC/USD Buy Setup (6H Chart)📈 BTC/USD Buy Setup (6H Chart)
Strategy: Trendline Support Bounce
🔹 Entry
Price: $118,674.3
Reason: Price is bouncing off a supportive trendline and holding above the 1st Support zone.
🔻 Stop Loss (SL)
Price: $114,470.6
Reason: Below the 1st Support zone to protect against breakdown.
🎯 Take Profit Targets
TP1: $123,269.6
Reason: Near recent swing high, good for partial profit.
TP2: $127,661.4
Reason: Next resistance zone, ideal for full exit or trailing stop.
#MJTrading
#Bitcoin
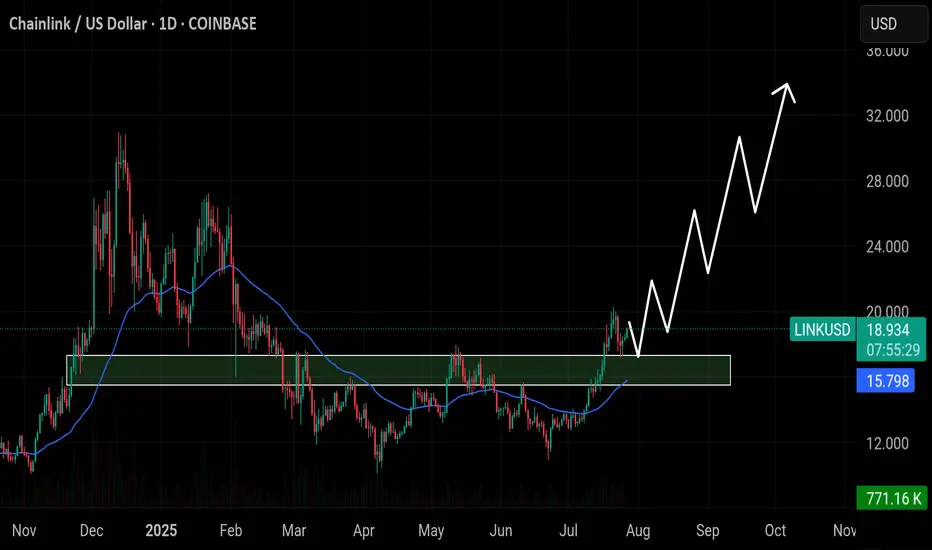
Chainlink ($LINK) has flipped the $15.80 zone into strong supporChainlink ( CRYPTOCAP:LINK ) has flipped the $15.80 zone into strong support — as long as it holds, bullish momentum could push toward $24, $28, and possibly $32 in the coming weeks.
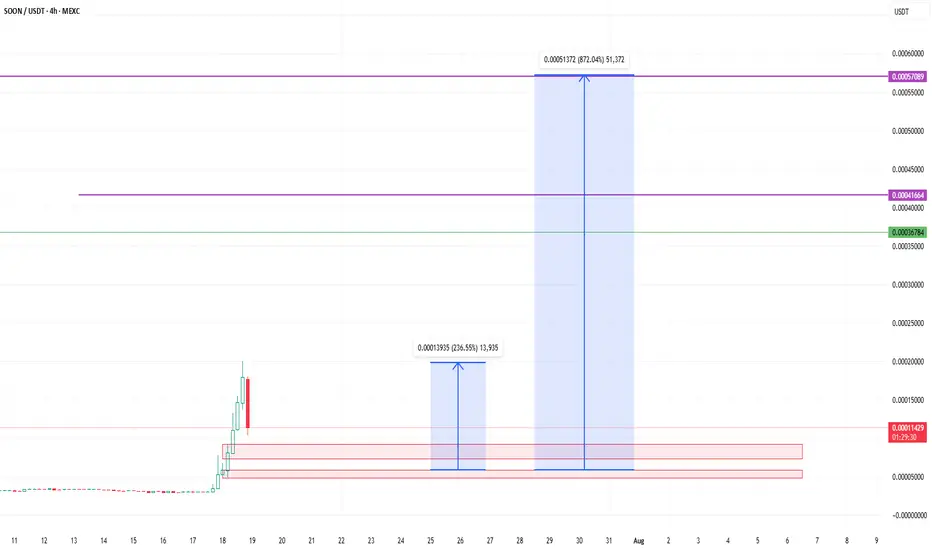
MR SOON GO TO THE MOON with huge commiunity and holder MR soon token is the Best meme for buy noow and a few wait foor a BIG pump so just buy and wait for pump and dont wory be happpy !
MR SOON GO TO THE MOON with huge commiunity and holder
now i am waiting for a very very very BIG PUMP my freind
Bitcoin: Spiked liquidations The optimism that held the market sentiment after the adoption of the Genius Act on July 17th, slowly faded during the previous week. As it was expected, traders were closing their positions in order to book profits, spiking the liquidations of positions. The price of BTC reached the lowest weekly level at $114,8K at Friday's trading session, however, it was only during the short period of time. The BTC swiftly recovered, turning back toward levels above the $118K. The highest weekly level reached was $120K.
The RSI is still holding high, around the level of 60, but went out from the overbought market side. This increases potential for a further move toward the oversold market side, however, it might take more than a week in order for the market to actually turn their course toward the downside. The MA50 is still diverging from MA200, indicating that the potential cross is still not in the store.
BTC continues to hold higher grounds, which indicates that investors are still eager to hold and buy this coin, especially on a dip, like it happened at Friday's trading session. Indications over potential short reversal of BTC are emerging on charts, however, the timing of it is unclear at this moment. In the week ahead there are several quite important US macro data scheduled for a release (NFP, PCE, Unemployment, JOLTs) as well as the FOMC meeting, which all might bring some higher volatility back on markets. BTC might also react, as a part of mainstream markets. At this moment on charts, there is indication that BTC might shortly test lower grounds, probably around the $116K level. If this level sustains the selling pressure, then BTC will revert back, most probably toward the $120K for one more time. Still, there are small odds that the $116K might be breached toward the lower grounds, in which sense, $112K will be level to watch. However, odds for this level are quite low at this moment.
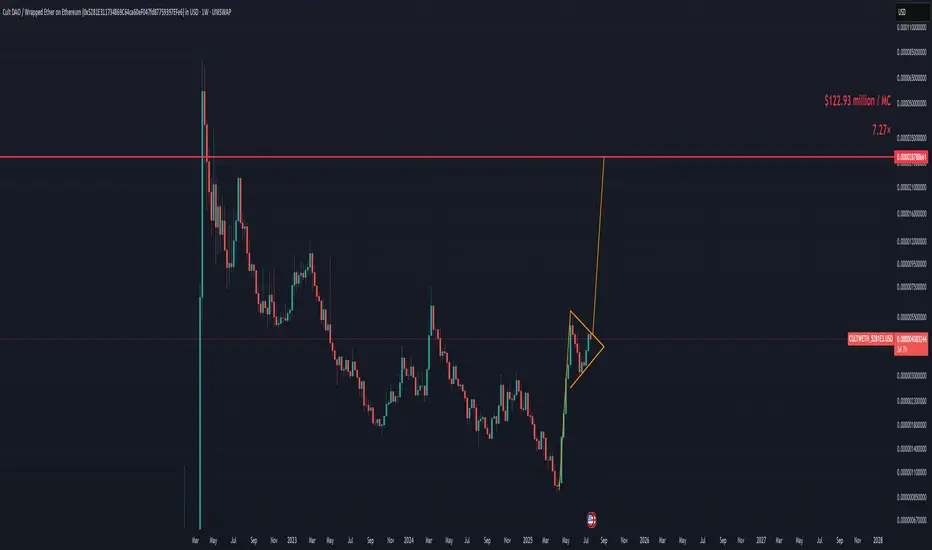
Brace for Impact: CULT DAO’s Bull Flag Points to Violent Upside!If you missed the last 500% wave from CULT DAO, fear not you’re just in time if you’re reading this.
My bottom call was slightly off, but since the lows, it's up 500% and it's just getting warmed up.
We are now forming a giant bull flag that will take CULT DAO straight to $122 million a 7.27x from this price.
I will be publishing CULT DAO TA’s until we hit a one billion dollar market cap, which we should reach sometime in Q4 2025.
Seeing a giant bull flag forming as we enter the final phase of the bull market is beautiful.
Prepare accordingly. Time is limited. We will blast off in under 30 days.
#BTC Update #10 – July 27, 2025#BTC Update #10 – July 27, 2025
Bitcoin continues to move between $116,400 and $118,900, and staying within this range is actually a positive sign, even in bearish scenarios. A decisive close below $114,000, however, could open the door for a deeper and more prolonged correction.
Although BTC hasn’t broken to new highs yet, its ability to hold here means the trend isn’t broken. A strong breakout above $118,900 could lead to a rally toward $123,300 and possibly even $128,000.
🔹 On the 4H chart, BTC seems to have completed its minor correction.
🔹 On the daily chart, the correction remains incomplete – despite dipping to $114,700, the key $112,900 zone hasn’t been tested.
In lower timeframes, BTC remains squeezed within a symmetrical triangle. While it occasionally pokes out, it quickly returns inside — showing indecision.
📌 Direction is unclear at the moment. There’s no strong signal for Long or Short. Waiting for confirmation with volume and a clear breakout is the safer play.

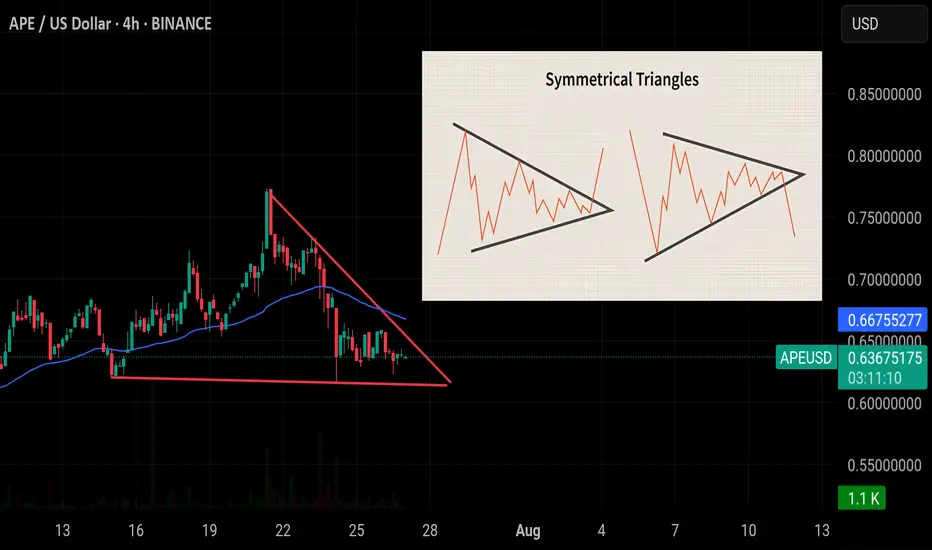
Symmetrical Triangle – Quick Guide 🕯A symmetrical triangle forms as price consolidates between two converging trendlines—one sloping up, the other down. It’s a neutral pattern, showing indecision.
📈 Breakout Direction Matters
Above = Bullish
Below = Bearish
🔍 Watch Volume:
It typically drops during formation and spikes on breakout—confirming the move.
✅ How to Trade:
Wait for a candle close outside the triangle on high volume
Enter in breakout direction
Stop-loss: just inside the triangle
⚠️ Pro Tip: Context matters—trend before the triangle often hints at breakout direction.
#Educational #btc #btcoin #eth
$BTC NEXT WAVE PROGRAMMED!bitcoin will load the next wave after the accumulation process it is in after the parabolic run
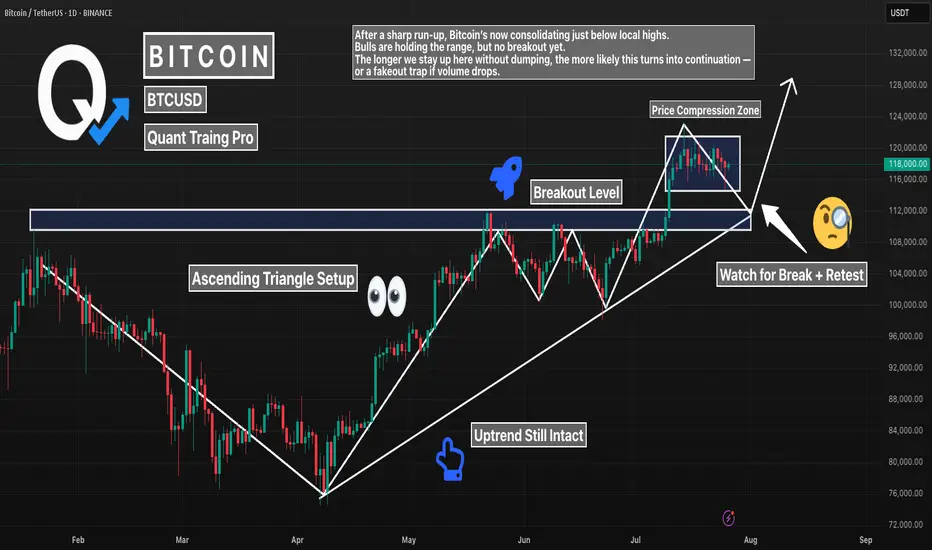
BTC 1D – Major Break of Structure. Now What?Bitcoin just broke major structure — flipping a key resistance level into support. After months of building higher lows, we finally saw price close above the previous swing high, confirming a bullish break of structure (BOS).
Now, BTC is coiling above that zone, forming an ascending triangle and refusing to give up ground. That’s a strong sign — but confirmation still matters.
What to watch:
– Break + retest of current range for continuation
– Or false breakout if volume fades and price sweeps below the level
Structure has shifted bullish. Now it’s all about follow-through.
#BTC #Bitcoin #BreakOfStructure #BOS #CryptoTrading #PriceAction #TechnicalAnalysis #QuantTradingPro
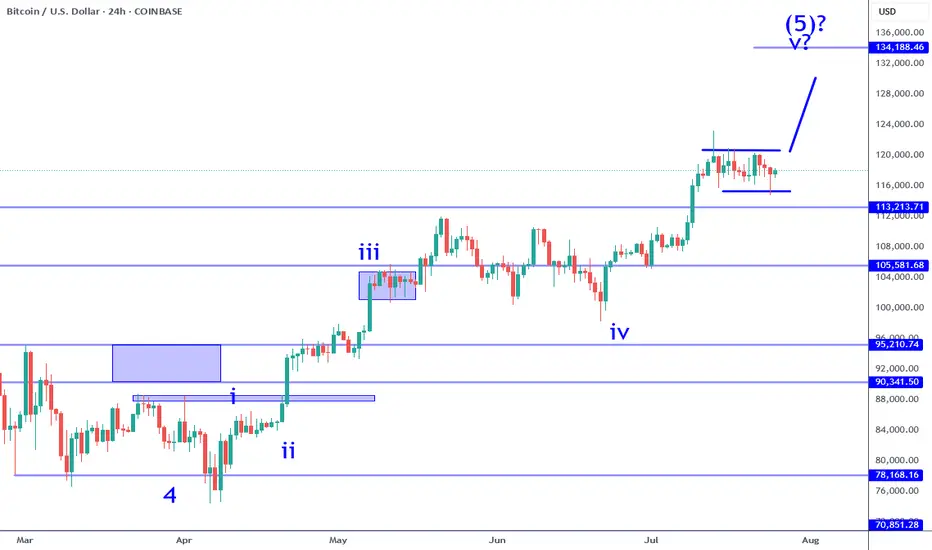
Bitcoin Still Consolidating For Wave 5 RallyBitcoin sub wave 4 consolidation continues to persist. While there was a failed break out over the previous week, it has not changed the bullish impulse at all. The current structure implies that there is a higher probability that one more leg higher (sub wave 5) is likely. It could be the coming week or next, it is all a function of catalyst. Keep in mind this consolidation can test as low at 113K and still be within the criteria of a wave 4. There are numerous opportunities in this situation when it comes to day trade and swing trade longs.
The break out: IF price pushes beyond 120K with conviction (large sustained candle on this time frame) that would be a swing trade long signal. IF there is no instant pullback (fake out), this can be the momentum required to test the 130Ks. Keep in mind, there is an inflection point in the 133K area which serves as a profit objective to measure from. Price can potentially go beyond that point, but participating in that is all about waiting and watching how price behaves. There is NO way to know how this will play out in advance. You have to adjust as new information becomes available.
The retest: if price pulls back into the 116K to 113K area and establishes a reversal on this time frame (or on adjacent time frames like 4H). This can appear in numerous ways: pin bar, engulfing candle, inverse head and shoulders, etc. This scenario would offer greater potential especially if the break out occurred soon after (high probability). IF the 113K level breaks instead, it will put the impulse structure into question. Meaning the probability of a wave 5 to follow will become lower.
This environment in my opinion is not easy to navigate for traders. People who bought into the alt coin weakness months ago are now getting paid and enjoying "alt season", which is great but not good if you are looking to buy something now with a longer time horizon in mind. Wave 5's often signal a corrective move is likely to follow and Bitcoin is potentially completing a very large magnitude Wave 5. I have been pointing this out for months. Most investors will ignore this because they will be biased by greed. The wise this to do is lock in profits along the way at inflection points such as whole numbers, price proportions (like 133K) and/or clear candle reversal signals after significant moves.
Thank you for considering my analysis and perspective.
Long term Bitcoin view: the path to $100kI think Bitcoin will make a correction in the short run. The next target price can be $42k.
However I predict further gains in price in the mid run. The target of $100k may be achieved then. Though it is a far stretched number, I still expect a price move to that level.
If fail, we can expect a complex correction for the next 2-3 years. Final long term target will be above $100k.
#BTCUSDTP

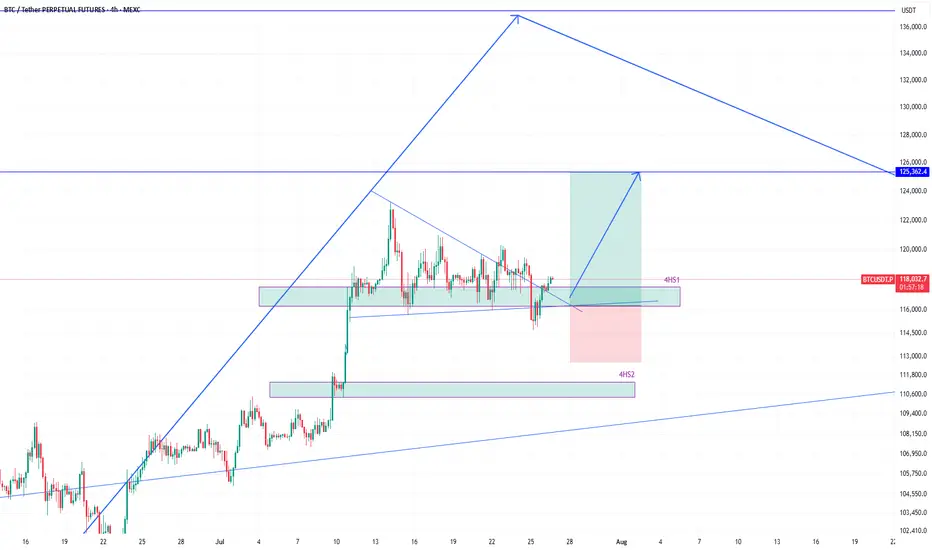
BTCUSDT eyeing 125k next after bounce from 116k zoneEarlier I shared the high time frame view of #BTCUSDT. We know that its heading higher and that helps in holding spot positions.
However, the move to the high frame target will not happen in a straight line, instead with various push to the upside and then subsequent corrections to the down side.
Therefore, as a trader, we must profit from those movements as we see some good high probability setups.
And there is one right now which is a long position.
The price broke 4h support 4HS1, but quickly reclaimed it. That is a sign of demand and strength required to move higher.
Therefore, this presents a long opportunity where the target of this long position should be 125k.
As the price enters into 4HS1 zone, I will scale into long position.
It is quite likely that the price will bounce hard once it taps into 4HS1 zone.
I am talking this long position targeting 125k. What about you? Share with me what you think.

BITCOIN Wait For Breakout!
HI,Traders !
#BITCOIN has formed a Bullish Wedge pattern
While trading in an uptrend As
we mentioned in a previous analysis
So we are bullish biased and
IF we see a bullish breakout
We will be expecting a
Further bullish move up !
Comment and subscribe to help us grow !

4:1 R:R for BTCBulls are likely to send it higher before the 120K breakout. This early setup is worth a try.
Entry: 118,200
Stop-loss: 115,000
Target: 135,000
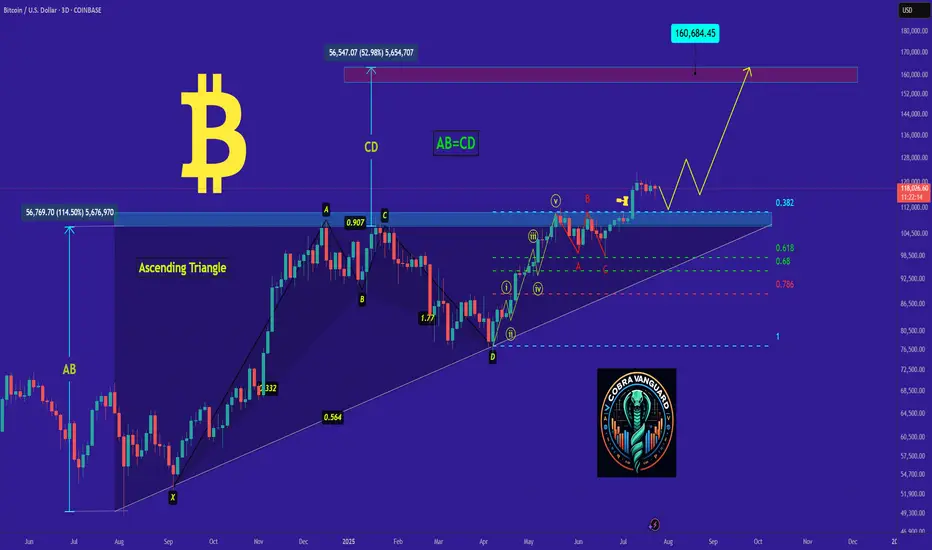
BITCOIN's Situation (12h) !!!So if you pay attention to the TON chart you can see that the price has formed a Ascending wedge which means it is expected to price move as equal as the measured price movement.( AB=CD )
NOTE: wait for break of the WEDGE .
Best regards CobraVanguard.💚

bitcoin- Time to buy again! (Update)As I said, Bitcoin broke the triangle, and now with a slight price correction, it could surge to $160,000, and you still think I'm joking!!
Previous analysis