BTC 1H Analysis – Key Triggers Ahead | Day 5💀 Hey , how's it going ? Come over here — Satoshi got something for you !
⏰ We’re analyzing BTC on the 1-hour timeframe .
👀 After triggering its long signals, Bitcoin moved upward and hit the seller zone at 117,500, then reversed from that level.
🎮 A Fibonacci retracement has been drawn from $ 114,200 to $ 117,560. The price entered the zone between the 0.37 and 0.61 levels, and we need to see whether it reacts to 0.61 with selling pressure or pulls back to 0.37. Understanding market behavior in this area can guide us.
✏️ A curve line has been drawn from the first touch of the maker-buyer zone to the first touch of the maker-seller zone. This line intersects well with the 0.37 Fibonacci level, which has now been broken in current conditions.
🔽 With the increase in short positions and selling volume for Bitcoin, the price experienced a decline and correction. If selling pressure continues, Bitcoin could start a short-term correction.
⚙️ Our RSI oscillator is below the 50 level, with a support zone at 41.22. If this zone is lost, market momentum will lean more towards selling and further correction.
💸 BTC.D , if it breaks 60.72 %, could drop to lower levels, making Bitcoin lighter relative to the market.
💵 USDT.D , if it breaks 4.28 %, could also drop to lower levels, reducing Tether’s share in the market and shifting more capital into Bitcoin and altcoins.
🖥 Summary: Bitcoin was rejected from the 117,560 level and, along with selling pressure, dropped below the 0.37 Fibonacci zone. There is a support level at $ 115,530 — as long as the price stays above this zone, Bitcoin can maintain its upward trend with short-term multi-timeframe corrections.
❤️ Disclaimer : This analysis is purely based on my personal opinion and I only trade if the stated triggers are activated .
BTC-D

BTC levels for August 2025Simple channel on BINANCE:BTCUSDT.P
retest of equilibrium with main liquidations of 20x - 40x leverages around 113600
this weekend or if we will see some bad macro news drop by end of 12-15 august
109900
keep charts simple

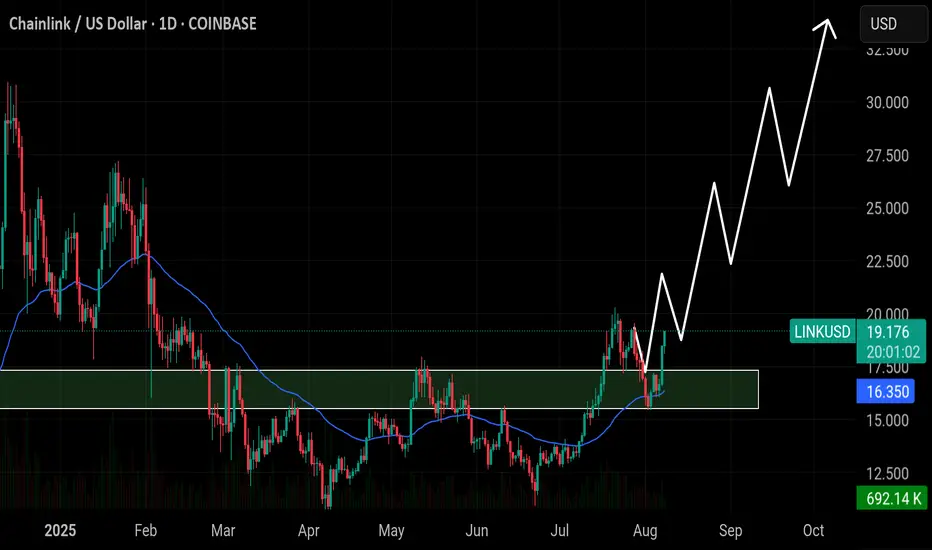
$LINK has retested the $15.80 breakout zone and bounced stronglyBIST:LINK has retested the $15.80 breakout zone and bounced strongly. Price is now gaining momentum and holding above the 50EMA. As long as this zone holds, LINK is likely to push toward $24, $28, and $32 in the coming weeks. A break below $15.0 would invalidate this bullish setup.
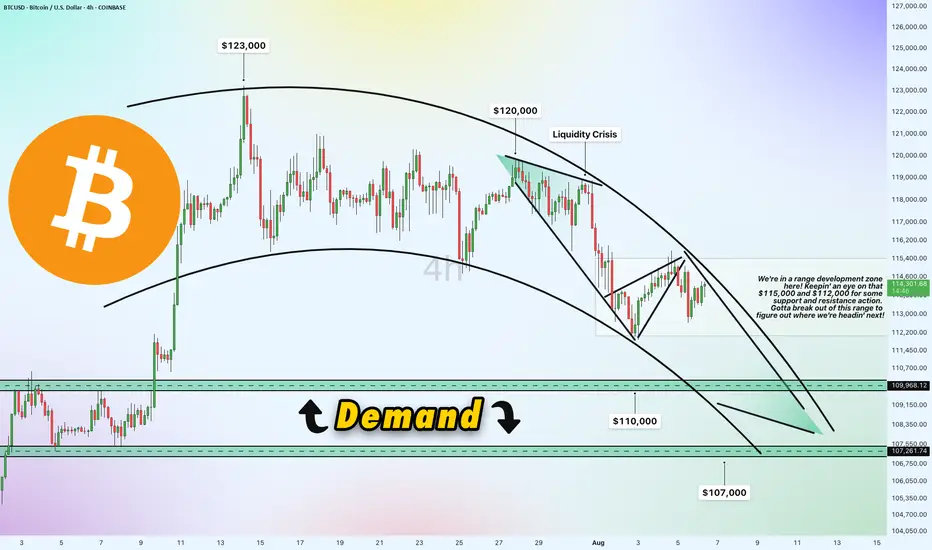
Bitcoin 4h Chart Update [Tight Range / Breakout Opportunities]Breakout Opportunities
We're in a range development zone here! The chart shows Bitcoin (BTC/USD) trading within a tight range, with key levels at $115,000 and $112,000 acting as critical support and resistance zones. The price recently peaked near $123,000 but has since pulled back, forming a liquidity crisis zone around $120,000 where selling pressure kicked in. A breakout above $115,000 could signal a move toward $120,000 or higher, while a drop below $112,000 might push it toward the demand zone. Gotta break out of this range to figure out where we're headin' next!
Demand Zone
$110,000 & $107,000
Price slipped down from $120,000 due to a lack of buying liquidity, potentially it will land into a demand zone between $110,000 and $107,000. This area could act as a strong support level where buyers might step in. If the price holds here, it could bounce back toward the $112,000-$115,000 range. However, a failure to hold this zone might see it test lower support around $107,000 or even $105,000.
Direction and Possible Ranges
Upward Potential: If Bitcoin breaks above $115,000 with strong volume, the next targets could be $120,000 (liquidity crisis zone) and potentially $123,000, aligning with recent highs. A sustained move above $120,000 might open the door to $125,000 or beyond.
Downward Risk: Should the price fail to hold above $112,000 and break below, it could slide into the demand zone ($110,000-$107,000). Further weakness might push it toward $105,000, a psychological and technical support level.
Current Trend: The chart shows a descending trendline from the $123,000 peak, suggesting bearish pressure unless a decisive breakout occurs. The 4-hour timeframe indicates indecision, with the range-bound action hinting at a potential volatile move once direction is confirmed.
Keep an eye on these levels for the next big move!
Bitcoin Bounces Back — Is $120K the Next Stop?!Bitcoin ( BINANCE:BTCUSDT ) reacted well to the 50_SMA(Daily) and the Heavy Support zone($112,000-$105,800 and started to rise again.
The question is, can Bitcoin reach $120,000 again and even create a new All-Time High(ATH)!?
In terms of Elliott Wave theory , it seems that Bitcoin has managed to complete the main wave 4 in the descending channel . To confirm the end of the main wave 4 , we must wait for the upper line of the descending channel to break. The structure of the main wave 4 is a Zigzag Correction(ABC/5-3-5) .
I expect Bitcoin to trend higher in the coming hours and attack the resistance area and the upper line of the descending channel(First Target: $117,490) .
Do you think Bitcoin's main correction has begun, or does Bitcoin still have a chance to create a new ATH?
Second target: $119,991
Cumulative Long Liquidation Leverage: $113,526-$112,591
Note: Stop Loss: $111,070
Please respect each other's ideas and express them politely if you agree or disagree.
Bitcoin Analyze (BTCUSDT), 2-hour time frame.
Be sure to follow the updated ideas.
Do not forget to put a Stop loss for your positions (For every position you want to open).
Please follow your strategy and updates; this is just my Idea, and I will gladly see your ideas in this post.
Please do not forget the ✅' like '✅ button 🙏😊 & Share it with your friends; thanks, and Trade safe.

BTC Bleeding, Scalpel Please💣 Price just nuked back to our OG S1 zone and buyers are throwing hands at $113k 🥊
This is a quick scalp play while the dust settles
🎯 Entry: 113,159
🛡 Stop: 113,111 (just below S2's base. you can tighten this up, to the base if desired.)
📈 Scalp Target 1: 114,444
🚀 (Swing Trade) Target 2: 116,588
🧠 Setup: Reclaim after wick trap
📐 Structure: Bullish continuation off demand
📍 Zone: Micro-range base + sweep low trap
Scalpel sharp ✂️
Clean. Tight. Ruthless.
⚠️ Heads up — 30m still trending down
So lock those stops and stay nimble 🔪
⚠️If $113k fails, watch for a flush to S2 or even S3.
This bounce is a scalp — not a trend shift (yet) 🚨
$BTC - LTF OutlookCRYPTOCAP:BTC | 1h
On lower timeframe, we want 115.6k (monthly open) to hold.
If you're currently short, might take partial profit if we bounce and break above 116.8k
Short remains safe below 116.8k. If 115.6k (monthly open) breaks, eyeing for 114.2k-113.3k (mondayLow) for long re-entry.

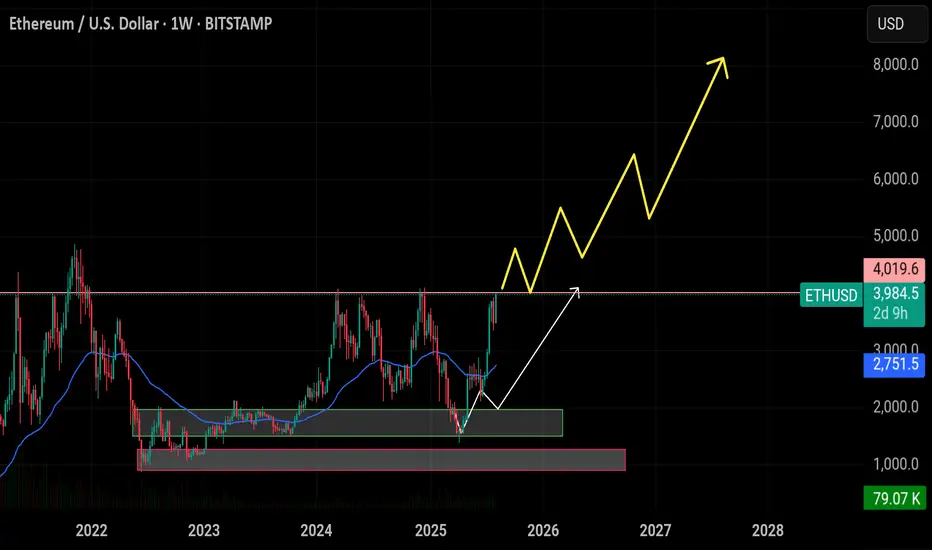
$ETH \ $BTC GONNA SEND INCOMING!The Ethereum-Bitcoin parity saw a local bottom after a long-term correction phase and began to move upward. The upcoming process will continue with a sharp upward trend.

$ETH/USDT Breakout Analysis 1W Chart: Ethereum $ETH/USDT Breakout Analysis 1W Chart:
ETH has successfully reached the $4,000 breakout level, completing our first major target from the accumulation zone ($1,500–$1,900). Price is currently testing the critical $4,000 resistance. If ETH can close a weekly candle above this level and hold, it will confirm a strong continuation structure — potentially targeting $5,000, $7,000, and up to $8,000 in the coming months.
🔸 Support LEVEL: $3,500 is now the key weekly support zone. This level aligns with previous resistance and structure, offering a strong base for bullish continuation. If ETH holds $4,000+ weekly, $3,500 becomes a high-conviction re-entry zone.
🔸 Upside Target: Upon confirmation above $4,000, ETH could rally toward $5,000 short-term, with extended targets at $7,000 and $8,000 if momentum continues.
🔸 Risk Level at $3,500: A weekly close below $4,000 followed by a drop under $3,500 would invalidate the breakout. This could signal a failed breakout and return to range. High risk zone opens below $3,200.
🔸 Watch for Retest ZONE: Look for a healthy retest of the $3,900–$4,000 zone. If ETH pulls back and holds this zone on weekly, it offers a strong entry with targets toward $5,000 and above.
$BTC Eliot Wave last step + Golden cross.The entire crypto market is on fire — Golden Crosses everywhere across altcoins. 🔥
BTC looks to be in the 5th wave of an Elliott Wave pattern and has just printed its own Golden Cross. Bullish momentum is clear in the price action.
But how long can this run last?
We may be in a parabolic phase, yet there’s heavy liquidity sitting around $115k.
The logical play: a drop to grab that liquidity, then a push to $120k+.
In the end… only the market makers know. 🎯
DYOR

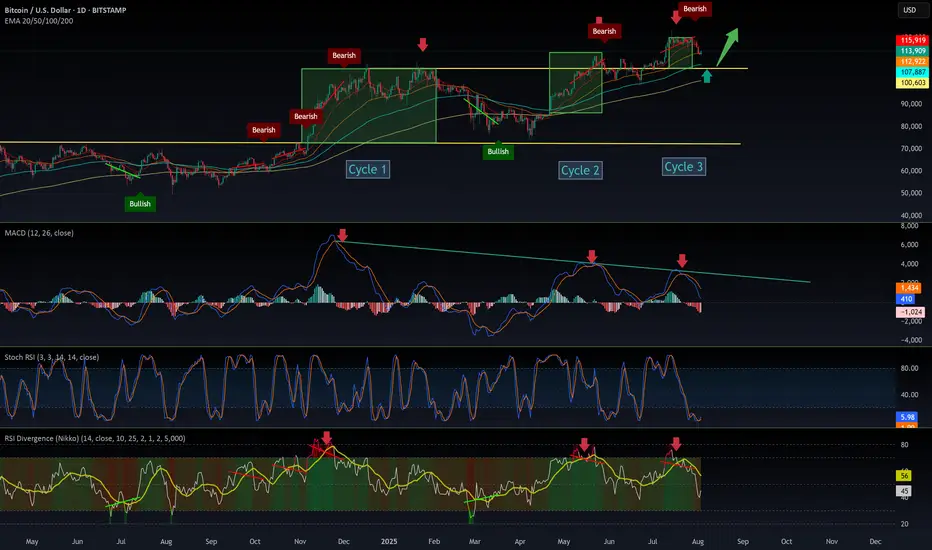
$BTC New Cycle: It’s Hard Not to Notice the ShiftSince December 2024, CRYPTOCAP:BTC has been closely following the SPX500, forming three similar cycles—each decreasing in intensity and shorter in duration.
The similarities are striking, especially when analyzing the MACD and RSI.
Each cycle ends with a bearish divergence.
Each cycle sees a rebound or bottom during consolidation, often touching the top of the previous cycle.
Most importantly, the cycles are accelerating.
However, it’s difficult to draw a definitive conclusion. These patterns are new in Bitcoin’s history, and there's no past reference for such institutional-driven behavior.
I believe the entry of institutions is reshaping Bitcoin’s rhythm. Their strategy is accumulation, not speculation, which brings more stability but also alters traditional crypto cycles.
What do you think will be the consequences of this shift?
Drop your thoughts in the comments👇
BTC 1H Analysis – Key Triggers Ahead | Day 6💀 Hey , how's it going ? Come over here — Satoshi got something for you !
⏰ We’re analyzing BTC on the 1-hour timeframe .
👀 On the 1-hour timeframe, Bitcoin rebounded from $114,200 after heavy whale buying. It broke through the $115,530 zone and moved toward its resistance at $117,600, but was rejected twice by strong seller tickers in that area. It is now moving toward its current support levels .
🎮 Key Fibonacci zones to watch are the 0.5 and 0 levels. A breakout of these areas can trigger potential long or short entries, making them valuable as breakout triggers .
⚙️ The important RSI pivot level is 44.87; losing this level could lead to a further correction .
🕯 Trading volume and transaction count are rising, suggesting the possibility of another “Bitcoin season.” Large institutions have been buying at the lows, increasing their positions each time. ETF data has turned highly positive, indicating strong recovery potential and attracting more risk capital .
🔔 There are two alert zones: one at $117,500 and another at $116,000. Setting alerts here can help you better track price behavior .
📊 USDT.D has broken above its range box , A break of the current zone could allow Bitcoin to push higher .
🖥 Summary : After its recent pump, Bitcoin is facing resistance from seller tickers and is trying to break through this zone. As long as BTC stays above $116,000, there is potential for another attempt to set a new high .
❤️ Disclaimer : This analysis is purely based on my personal opinion and I only trade if the stated triggers are activated .

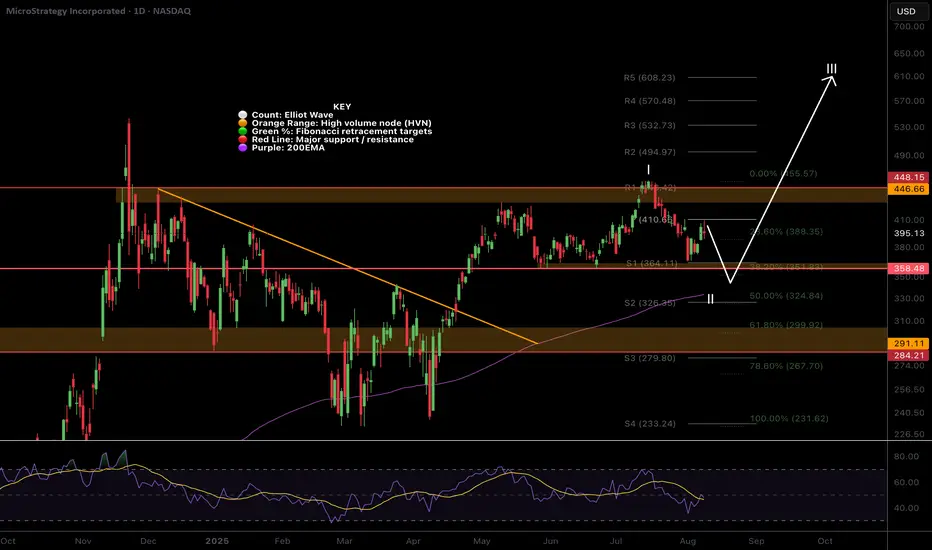
$MSTR shallow wave 2 underway before explosive move ?MicroStrategy has been caught in a range since Nov 2024 possibly building momentum for a large breakout into price discovery, continuing its huge rally from 2024.
Price appears to ave completed an Elliot wave 1 with wave 2 now underway with a target of the ascending daily 200EMA $340, the 0.382 Fibonacci retracement.
Weekly RSI is currently showing bullish divergence but daily suggests we have one push lower to get to oversold!
Bitcoin stocks have all had a decent retracement causing me to upgrade my Elliot Wave count to a completed macro wave 1 with wave 2 now underway, suggesting the best returns are still to come over the next months for this category asset class in wave 3!
Analysis is invalidated if we go to new highs above $457 or lose $229
New long signals are certainly building in the DEMA PBR and Price Action strategies so keep an eye out on the Trade Signals Substack as we have made very food profits lately in these markets!
Safe trading
$IREN wave B complete?After its mammoth rally NASDAQ:IREN appears to have completed a wave 1 of 3 with wave 2 underway. The recent push up into the previous all time high resistance appears to be wave b of c in a corrective wave 2.
My initial target for wave 2 is the ascending daily 200EMA and .5 Fibonacci retracement at $10.44. This is also just above the weekly pivot and major High Volume Node support which remains untested.
Weekly RSI has reached oversold, not significantly, but price did have decent retracement the last few times it was reached.
Bitcoin stocks have all had a decent retracement causing me to upgrade my Elliot Wave count to a completed macro wave 1 with wave 2 now underway, suggesting the best returns are still to come over the next months for this category asset class in wave 3!
Analysis is invalidated if we go to new highs above $21.7 or lose $5.08
New long signals are certainly building in the DEMA PBR and Price Action strategies so keep an eye out on the Trade Signals Substack as we have made very food profits lately in these markets!
Safe trading

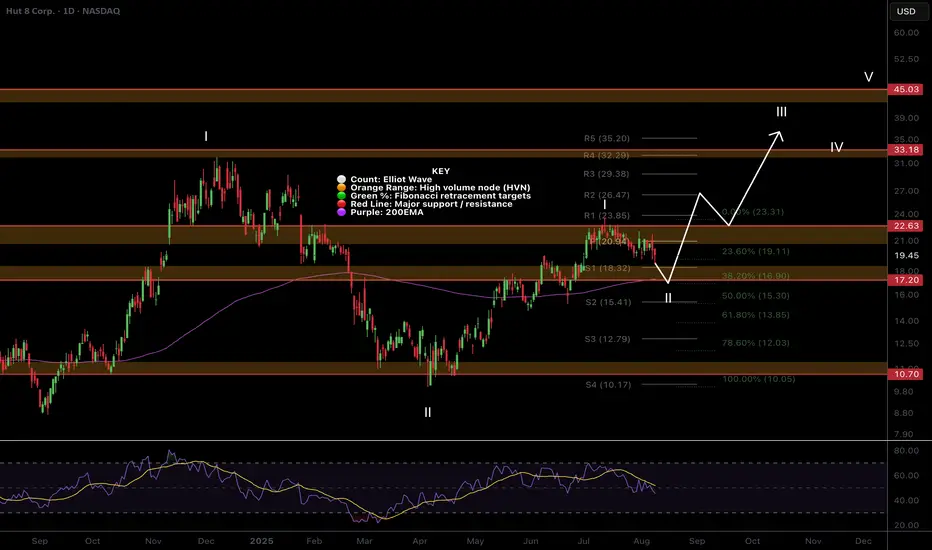
$HUT Pulling back to daily 200EMANASDAQ:HUT appears to have complete a larger degree wave 1 of 3 with wave 2 underway.
Looking at the support below we may have a shallow wave 2 targeting the daily 200EMA, major support High Volume Node at the .382 Fibonacci retracement, $17. A shallow wave 2 often happens in strong trending markets as participants are excited and can't wait to buy!
Daily RSI has plenty of room to fall. $19.5 is also the weekly pivot point where price is also expected to find strong support so we may see a reversal from here at the start of next week but these assets are volatile so i would lean towards lower first.
Bitcoin stocks have all had a decent retracement causing me to upgrade my Elliot Wave count to a completed macro wave 1 with wave 2 now underway, suggesting the best returns are still to come over the next months for this category asset class in wave 3!
Analysis is invalidated if we go to new local highs above $23.46 or lose $9.98.
New long signals are certainly building in the DEMA PBR and Price Action strategies so keep an eye out on the Trade Signals Substack as we have made very food profits lately in these markets!
Safe trading
$COIN Price Action playing out exactly as expected!NASDAQ:COIN price action is following the plan laid out a few weeks ago.
After the momentous rally into all time high I was expecting price to have a deep retracement to the weekly pivot point also the golden pocket Fibonacci retracement $240. That is what we got! This values would correspond with a swing below the major High Volume Node support resetting daily and weekly RSI. Daily RSI is already oversold so I am expecting a bounce for wave B of this wave 2 corrective wave with a target of the $350 High Volume Node major resistance.
The weekly 200EMA is ascending and may meet us in the same area adding confluence but this would take a lot longer to play out.
Alternatively, there is also a gap at $215-230 that never got filled at the larger degree golden pocket which would have me upgrade this pullback to wave 2 instead of wave 4.
Bitcoin stocks have all had a decent retracement causing me to upgrade my Elliot Wave count to a completed macro wave 1 with wave 2 now underway, suggesting the best returns are still to come over the next months for this category asset class in wave 3!
Analysis is invalidated if we go to new highs or lose $140. New long signals are certainly building in the DEMA PBR and Price Action strategies so keep an eye out on the Trade Signals Substack as we have made very food profits lately in these markets!
Safe trading

lohceeto 2022 2022 locheeto we finna live the dream in 2025 on 40's on smoke fo . sheeeyt rayquanda finna get a new fade too after that watermelon challenge.

ENA Breakout Alert – Red Resistance Cleared! 🚨 MIL:ENA Breakout Alert – Red Resistance Cleared! 🔴✅
MIL:ENA has finally broken out of the red resistance zone.
📊 This breakout signals bullish momentum with potential for further upside.
🔥 Buyers stepping in strong —

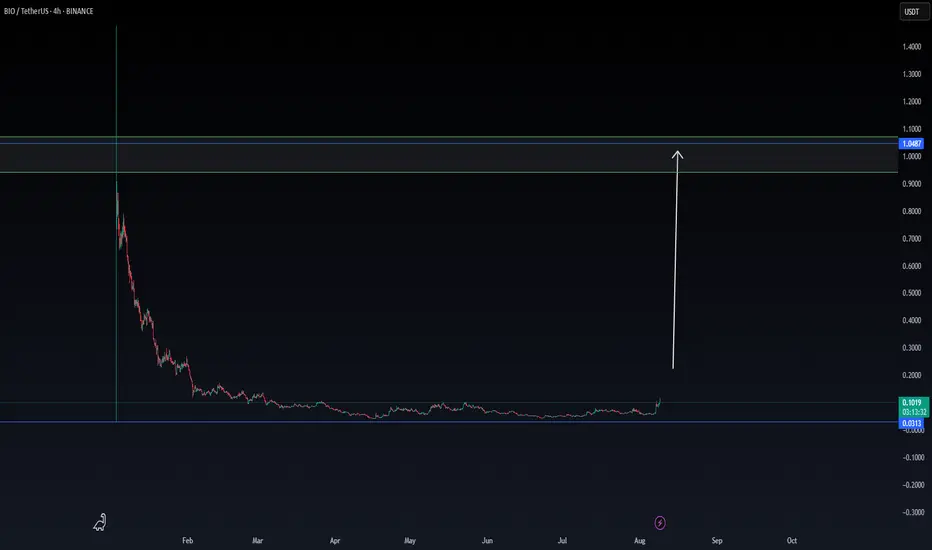
BIO THE next hype coin that can return up $1There is a high chance BIO is going to return up $1
We will follow to see if this is going, depending Data
The coin is now moving between $0,09 and $0,10
Data shows that this coin has the volume power to break back to $1 , next targets could be $0,25 and $0,43
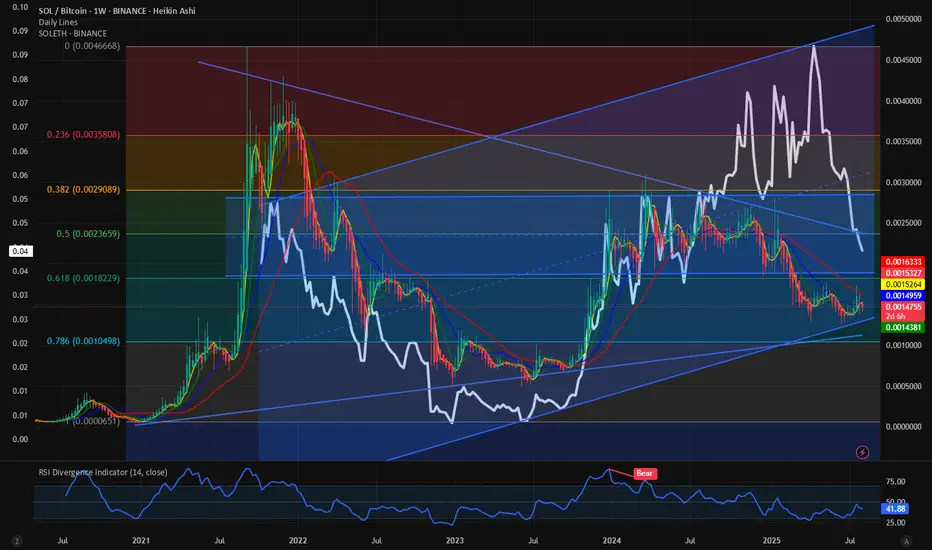
$SOLBTC Broke down. Same with $SOLETH. Will it rebound? We peaked in CRYPTOCAP:BTC.D chart as we predicted here.
CRYPTOCAP:BTC weathering the storm: CRYPTOCAP:BTC.D close to 66%. CRYPTOCAP:BTC to 160K. for BITSTAMP:BTCUSD by RabishankarBiswal — TradingView
Since then, Altcoins have shown signs of strength and CRYPTOCAP:ETH.D is bouncing back with BITSTAMP:ETHUSD at 4000 $. Please check my CRYPTOCAP:ETH.D blog here.
CRYPTOCAP:BTC.D : Cycle tops are in. CRYPTOCAP:ETH.D : Bounce form the all-time lows for CRYPTOCAP:BTC.D by RabishankarBiswal — TradingView
CRYPTOCAP:SOL being one of the large caps within the Altcoin must participate for the Altcoin summer to happen. But when we plot the BINANCE:SOLBTC and BINANCE:SOLETH then we see a broken chart with a fall from the cliff. On July 6th I wrote theta §SOLBTC looks bearish and we might find it difficult to break out of the range 0.0025 to 0.00125.
BINANCE:SOLBTC : Little strength to show for. for BINANCE:SOLBTC by RabishankarBiswal — TradingView
I put the BINANCE:SOLETH on the same chart and I was surprised how perfectly fit between the Fib retracement level. 😊 Now we would like to see where this chart goes and where does it bounce back. We see that the favorite range where BINANCE:SOLETH spends most of the time is between 0.053 to 0.04. Currently the ratio is at 0.044. My estimate is that the ratio will bounce back from the psychological level of 0.04 and then bounce atleast to 0.06 which is the mid-point of the upward slopping channel on $SOLETH.
Verdict: Altcoin summer is on. BINANCE:SOLETH is short term bearish but medium term bullish with 0.06 as target.
$BTC Daily Update - Short TermCRYPTOCAP:BTC $118,168 test, $116,908 support testing with weak chances of holding as previous 4H closed with bearish engulfing, expect $115,753 test if followed thru. Current support at $115,753. $118,168 resistance holding. Watch Given S/R
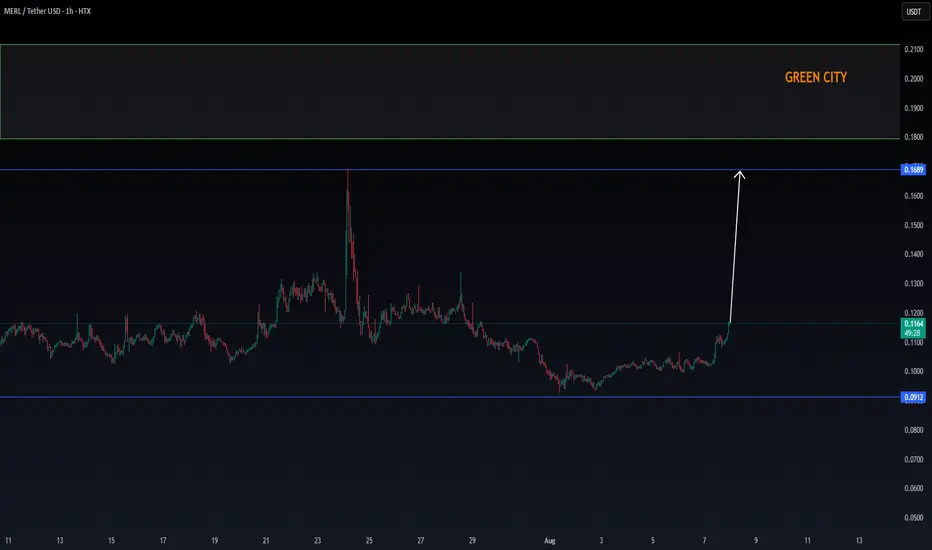
MERL/USDT UPCOMING VOLUME + BREAK effectMERL is coming with a new volume, which can be confirmed in the coming time frames with a break.
BTC Breaks 116k!We did break the 116k level. But it is not clear yet whether the breakout is bullish or not.
Plotted range extremes let's see
