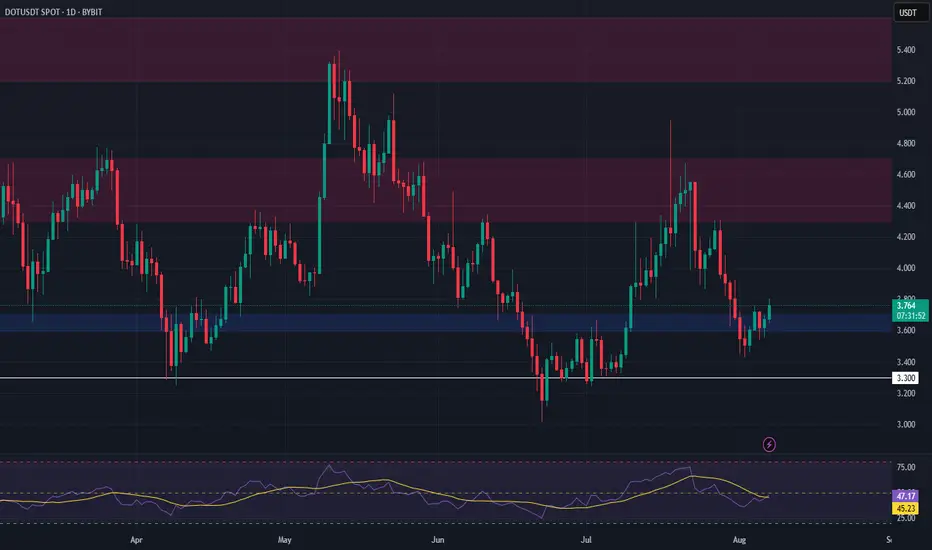
DOT | Bounce Setup from Major Support ZonePolkadot (DOT) has dropped sharply in recent weeks and is now testing a significant support zone between $3.60 – $3.70. This level has historically provided strong demand, making it a potential launch point for a bounce toward higher resistance levels.
Trade Setup:
🔹 Entry Zone: $3.60 – $3.70
🔹 Take Profit Zones:
• TP1: $4.30 – $4.70
• TP2: $5.20 – $5.60
🔹 Stop Loss: Below $3.30
BTC-D
TradeCityPro | Bitcoin Daily Analysis #147👋 Welcome to TradeCity Pro!
Let’s dive into Bitcoin. Today, Bitcoin has made an upward move and is triggering our setups.
⏳ 4-Hour Timeframe
In the 4-hour timeframe, Bitcoin made a bullish move today and activated the trigger I had previously shared with you in the 1-hour timeframe analysis. It has now reached the 116000 zone.
✔️ After breaking above the SMA25, the price has now reached the SMA99, which is forming a PRZ with the 116000 area. At the same time, RSI has reached its resistance zone, and rejection from here could work against this bullish leg.
⭐ On the other hand, the bullish momentum and buyer strength are very strong. The volume of the last two candles strongly favors the buyers, and considering the upward trend in the higher cycles, the probability of breaking the 116000 zone has increased.
📊 If this zone is broken, we can open a long position. The next resistances are 120000 and 122000. I’ll open this position with a wide stop so that it averages with our previous entry. If the market moves up, the position will carry more volume.
✨ In case of rejection from this 116000 zone, the main support trigger we have is 112233. As long as the price doesn’t fall below this area, we can still consider Bitcoin in an uptrend.
⏳ 1-Hour Timeframe
The trigger we had in the 1-hour timeframe was the 115327 zone. I mentioned that if the price touches it once, forms a higher low, and then breaks it, we can open a position on the next breakout.
🔍 That’s exactly what happened. Yesterday, the price hit it once and registered a higher low, but the candle that broke 115327 wasn’t ideal for entry — it was better suited for a stop-buy strategy.
📈 I didn’t open this position myself because I had mentioned that I wasn't actively trading in the 110000-116000 range, so I didn’t place a stop-buy.
💥 Now the price has entered the zone. If we get a pullback, we can open a long position in the next upward wave, which I think is a very good trigger.
🥸 However, since the RSI has entered the Overbuy zone, there's also a chance that this leg may continue without a pullback. In that case, we can use other strategies like candle setups to enter the market.
❌ Disclaimer ❌
Trading futures is highly risky and dangerous. If you're not an expert, these triggers may not be suitable for you. You should first learn risk and capital management. You can also use the educational content from this channel.
Finally, these triggers reflect my personal opinions on price action, and the market may move completely against this analysis. So, do your own research before opening any position.

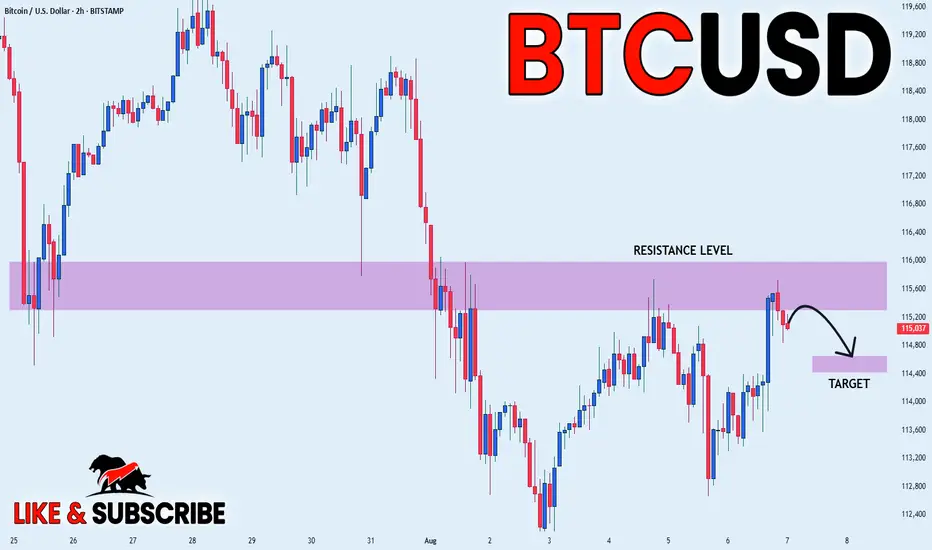
BITCOIN Bullish Breakout! Buy!
Hello,Traders!
BITCOIN made a bullish
Breakout of the key horizontal
Level of 115,5k$ and the
Breakout is confirmed so
We are bullish biased and
We will be expecting a
Further bullish move up
Buy!
Comment and subscribe to help us grow!
Check out other forecasts below too!
Disclosure: I am part of Trade Nation's Influencer program and receive a monthly fee for using their TradingView charts in my analysis.

Bitcoin is forming a double bottom ┆ HolderStatKUCOIN:BTCUSDT is bouncing from 112,000 support, forming a potential double bottom. The setup aligns with prior bullish continuations from similar consolidation zones. A push toward the ATH region could follow if buyers remain in control.

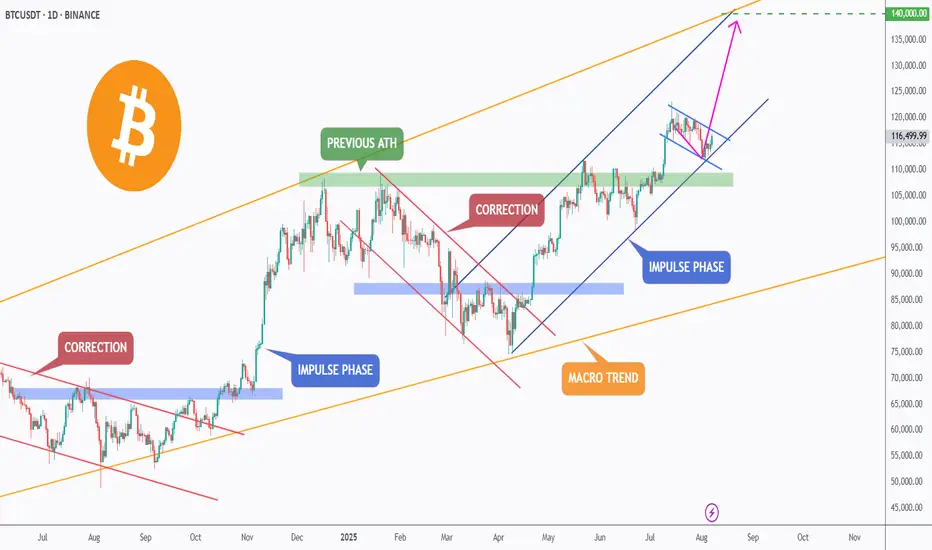
BTC – Breakout Loading?Bitcoin continues to respect its macro bullish trend (🟠), trading within a large ascending channel that has guided price action for over a year.
After breaking above the previous ATH 🟢, BTC entered a correction phase 🔻, retesting the green zone — a key structure now acting as support.
The bulls stepped back in, initiating a new impulse phase 🔵. Currently, BTC is consolidating within a small blue descending channel — forming a classic bullish flag 🏁 pattern.
⚠️ For the bulls to take over and trigger the next impulsive wave toward $140,000 🎯, we need to see a confirmed break above this small blue channel. This would signal trend continuation and open the door to the upper boundary of the macro channel.
✅ Key levels to watch:
- Support: ~$110,000 (green demand zone) 🟩
- Resistance: Top of the blue flag 🟦
- Target: $140,000 💰
A breakout from here could fuel the next major rally — stay sharp and follow the trend!
💬 What’s your bias here? Are you bullish or waiting for a deeper pullback?
📚 Always follow your trading plan regarding entry, risk management, and trade management.
Good luck!
All Strategies Are Good; If Managed Properly!
~Richard Nasr
BTC to 119k
Bitcoin has already managed a small breakout, retest, and now off to the races again. Back up to previous levels.
Look for what happens at the 119k level. If BTC gets rejected we'll be back down to these levels.
If BTC can break through the 120k level, look for a small leg up, before a retest to 120k (now as support) then off to test the all time high.

Bitcoin bullish momentum ending very soon...Past Cycle Behavior:
Bitcoin showed strong bullish momentum in the past.
Many positive news updates came for Bitcoin and blockchain.
Despite this, Bitcoin completed its cycle and dumped for 13 months.
Current Market Situation (2025):
Bitcoin is now completing a 33-month bullish cycle in October 2025 (similar to past trends).
RSI divergence is forming, which often signals a trend reversal.
Again, positive news is coming for Bitcoin, just like before.
Time Cycle Theory in Trading:
Time cycles often work in financial markets, repeating past patterns.
However, this does not guarantee future price movements.
Risk Management (Important for Beginners):
Always set a Stop Loss (SL) to protect your capital.
Never risk more than 2% of your total trading balance on a single trade.
Even if the analysis is strong, market conditions can change anytime.

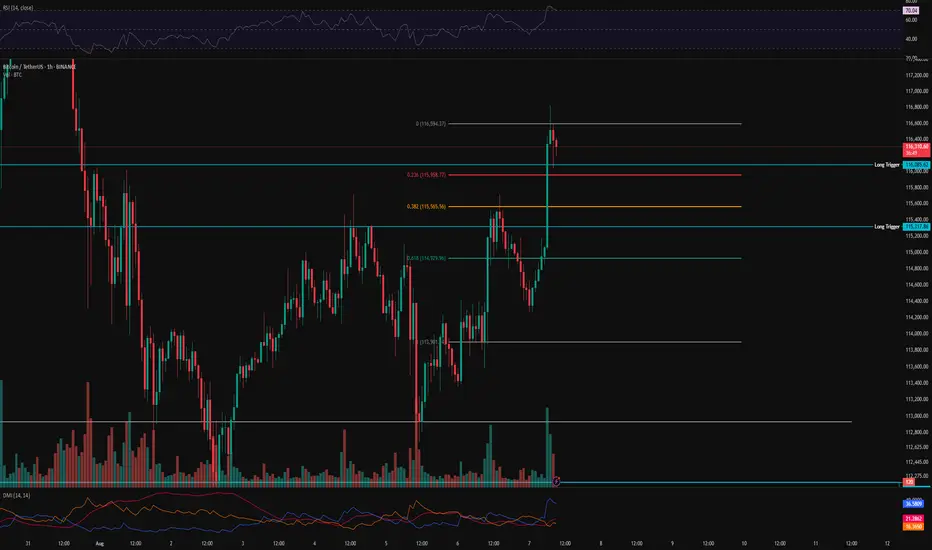
BTC 1H Analysis – Key Triggers Ahead | Day 4💀 Hey , how's it going ? Come over here — Satoshi got something for you !
⏰ We’re analyzing BTC on the 1-hour timeframe .
👀 After triggering our long entry levels , Bitcoin faced increased buying volume , and the U.S . unemployment claims came in higher than expected, which was interpreted positively for the crypto market .
🔼 With rising buying volume, Bitcoin may continue moving toward higher levels and could even aim for a new local high. Our key support zones are the same trigger levels we've been watching—these are also our ideal long entry points .
⚡️ There is a strong resistance around $117,000, where taker sellers are actively selling their Bitcoin at premium prices. In order to break through this area, we’ll need solid volume inflow from both market makers and retail buyers .
⚙️ There’s no clear RSI support zone at the moment, since on the 1-hour chart RSI is already in the Overbought area and oscillating there .
📈 Long position : Be a bit patient here . Wait for Bitcoin to pull back to key Fibonacci levels , preferably around 0.236 and 0.382, and then bounce back up . Once we break above the pullback, you can consider entering a long trade .
📉 Short position : A short setup could form only if both of our marked trigger levels get stop -hunted, combined with increased selling pressure , support breakouts , and confirmation from bearish candlestick patterns.
That said — we are not looking to short right now, as there are better opportunities to catch strong long entries .
❤️ Disclaimer : This analysis is purely based on my personal opinion and I only trade if the stated triggers are activated .
Bitcoin (BTC): Buyers Are Accumulating | Going For Breakout Bitcoin looks good; after some struggle, the price is now pressuring the local resistance area. What we are looking for here is the breakout from the $116K zone, which then would open for us an opportunity to long the coin until the ATH zone of $123K.
Swallow Academy

Why BTC Remains Bullish and Its Next Potential Move !bitcoin has completed and broken the ascending triangle in the daily timeframe, The price is currently supported well, which can increase the price. I expect the price to rise to around 119k .
Stay Awesome , CobraVanguard
The Big Btc Shortposting this for the fun of it if its correct
i know its not a popular belief, that the top is in
but
we will see
the idea is basically that we had 12345 up and A down to 73k and overshooting B to new ath.
and now the big 5 waves down to 786 or so

BITCOIN PREDICTION: a SECRET PATTERN is FORMING (watch out)!!!Yello paradisers! In this Bitcoin prediction, I'm updating you about the crash we predicted earlier in previous videos. I'm showing you on a high timeframe chart the ABC corrective mode wave; we are now forming the C wave. The C wave subdivides itself into five smaller waves because it's a motive mode wave. We are taking a look at the volume. We understand that bears are still in power, so we are waiting for some nice volume from bulls. We are spectating a bullish divergence on the MACD indicator. On RSI, there is exaggerated bullish divergence, and in stochastic RSI, we are in an oversold area.
Then, we are shifting our focus to a medium timeframe. We are zooming into the fourth wave, where we are making our sub-waves right now. On the medium timeframe, we are also spectating bearish divergence. We are waiting for the second booby that will basically increase the probabilities of absorption.
As we have seen previously, that helped us to predict that Bitcoin will be crashing. We are also taking a look at our head and shoulders target, which is at $109,000.
Then we are shifting our focus to a lower timeframe, where we are seeing the secret pattern, triple three. Right now, we are creating a sub-wave XX, which is forming itself as a possible zigzag. Paradisers, make sure that you are trading professionally, focus on long-term growth, and avoid get-rich-quick schemes. Any shortage in trading usually ends up sooner or later in bankruptcy.
Remember, don’t trade without confirmations. Wait for them before creating a trade. Be disciplined, patient, and emotionally controlled. Only trade the highest probability setups with the greatest risk to reward ratio. This will ensure that you become a long-term profitable professional trader.
Don't be a gambler. Don't try to get rich quick. Make sure that your trading is professionally based on proper strategies and trade tactics.

BITCOIN VS. GOLDAlthough there is a time difference between bitcoin, known as digital gold, and spot gold, it continues to follow suit, which we can clearly see on the chart.

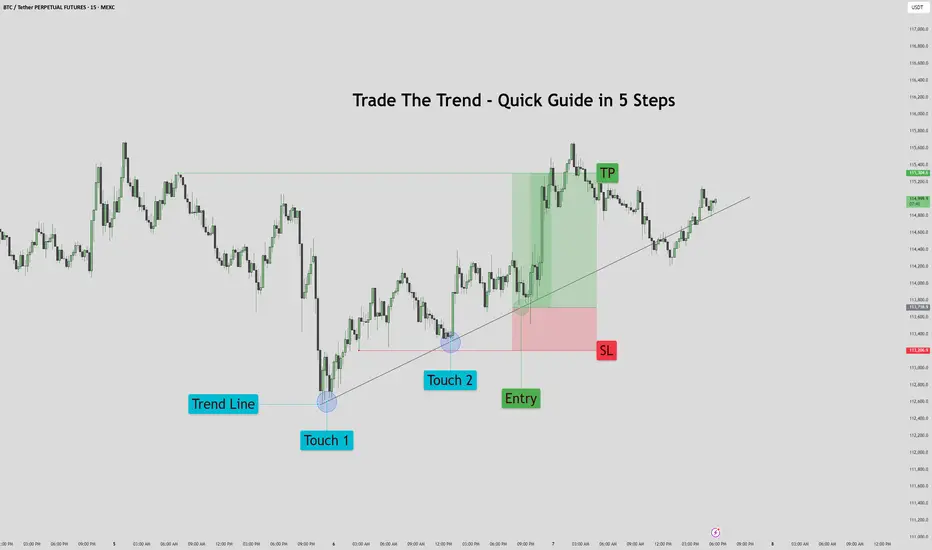
Trade The Trend – Quick Guide In 5 StepsWhat is Trading the Trend?
Trading the trend means buying when the market is going up, and selling when it’s going down.
You're following the direction of the market, not fighting it.
If the trend is up:
Price makes higher highs and higher lows
You look for chances to buy (go long)
If the trend is down:
Price makes lower highs and lower lows
You look for chances to sell (go short)
Why it works:
You’re going with momentum
Simple rule:
Buy in an uptrend, sell in a downtrend — never trade against the flow
1. Assess the chart. Where is it headed? It's headed up.
2. Place your trend line by connecting the first two points.
3. Let the chart play out for a bit. Afterwards prepare your entry on previous failed trend line retest. Set your stop loss below the previous trend line retest, and your TP just before the previous sweep above.
4. Proceed to let the chart play out, then set your pending order.
5. Watch the Trade enter and play out with patience.
This method works for bearish trends as well, just reversed.
If you would like to see more 5 step guides, comment down below.
Thank you!
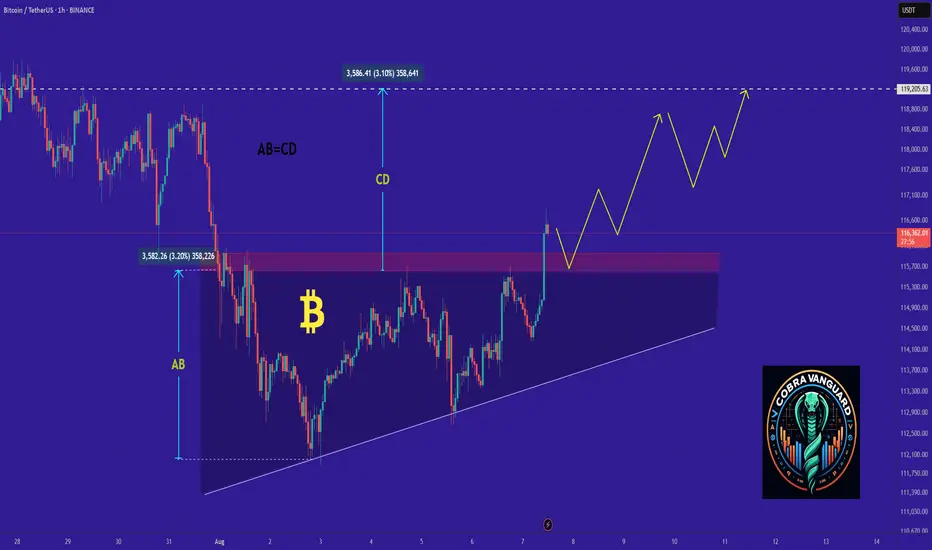
BTC cares US liquidity risks in AugustMorning folks,
So, in general as you can see our upside AB=CD that we discussed last time is working. But...
as you know BTC is strongly related to liquidity dynamic on US domestic system. This month Mr. Bessent wants to re-finance 1Trln in debt, with net borrowing around 250 Bln. Hardly BTC will get a small chunk of this funds.
it means that the volatility could rise significantly in nearest 1-2 weeks with downside price gravitating. Overall action looks rather heavy. Maybe BTC somehow will complete AB=CD target around 116.20-116.25K, but now this action looks like retracement - no thrust, slow action a lot of overlapping candles. So lows might be re-tested or even broken.
In current situation we think it would be better to not take any new longs and watch for clarity. If you have position already - move stops to breakeven.

Bitcoin testing 116k zoneIf we are successful in breaking above the 116k zone resistance. Bitcoin will pump hard to 120k and 123k next. As the high time frame trend continues to stay uptrend. Let's see if bitcoin breaks it now or has some other plans.
Stay tuned!

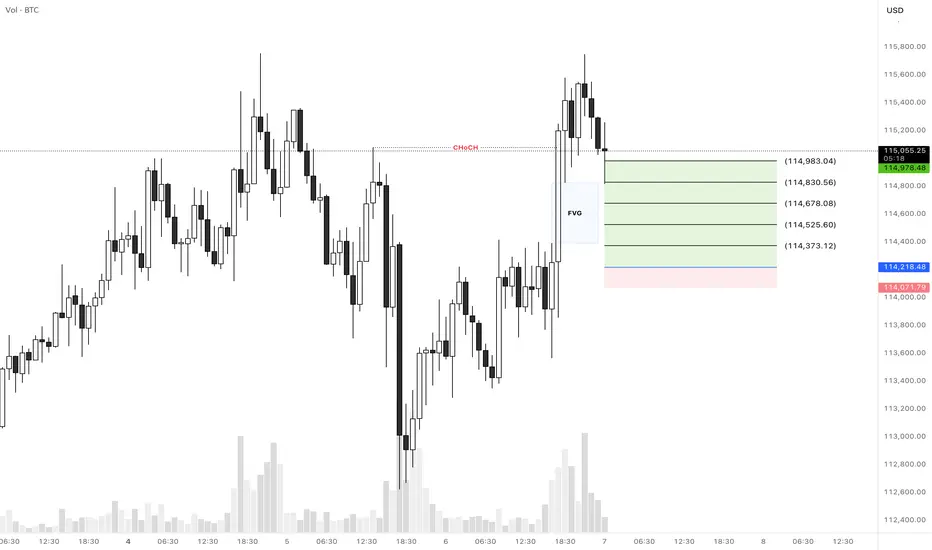
BTCUSD Long SetupHello everyone.
We have a CHoCH in 1H TF that it left a FVG area and it was touched a minute ago...
Let's see how does it reacts to this FVG area and if it didn't push the price up then we can expect our entry is valid...
Another thing that we should consider is that we're in down trend in 4H TF and the price didn't break the previous high for a CHoCH, so this trade would be a little risky so please consider the risk management...
Let's see what happens...
Good luck
BITCOIN → Retest of resistance in the bearish trading rangeBINANCE:BTCUSDT.P is consolidating in the range of 115,600 - 113,500. The price is testing resistance, relative to which a huge pool of liquidity has formed, which bears are likely to defend quite aggressively...
Idea from July 22: expectation of a decline from 120K to 112K. Target achieved
Bitcoin is correcting on D1, the price previously broke through the support level of 115650 and formed another trading range, with the previously broken lower boundary of the consolidation acting as resistance. The market has not yet tested the zones of interest at 110K and 105K, and therefore the possibility of a further decline remains relevant. A liquidity pool has formed relative to the resistance of the trading range at 115678. There is a high probability of a short squeeze before the decline.
Resistance levels: 115678, 116370
Support levels: 113530, 112660, 110K
In the short term, I expect a retest of resistance and a capture of liquidity. If the market is unable to continue its upward momentum and returns the price below the level, a false breakout will form, which may trigger a decline to the indicated areas of interest.
Best regards, R. Linda!

#DOGE/USDT | Eyes Bounce from Key Support !#DOGE
The price is moving within an ascending channel on the 1-hour frame, adhering well to it, and is on its way to breaking strongly upwards and retesting it.
We have support from the lower boundary of the ascending channel, at 0.1930.
We have a downtrend on the RSI indicator that is about to be broken and retested, supporting the upside.
There is a major support area in green at 0.1895, which represents a strong basis for the upside.
Don't forget a simple thing: ease and capital.
When you reach the first target, save some money and then change your stop-loss order to an entry order.
For inquiries, please leave a comment.
We have a trend to hold above the 100 Moving Average.
Entry price: 0.2060.
First target: 0.2111.
Second target: 0.2183.
Third target: 0.2264.
Don't forget a simple thing: ease and capital.
When you reach the first target, save some money and then change your stop-loss order to an entry order.
For inquiries, please leave a comment.
Thank you.

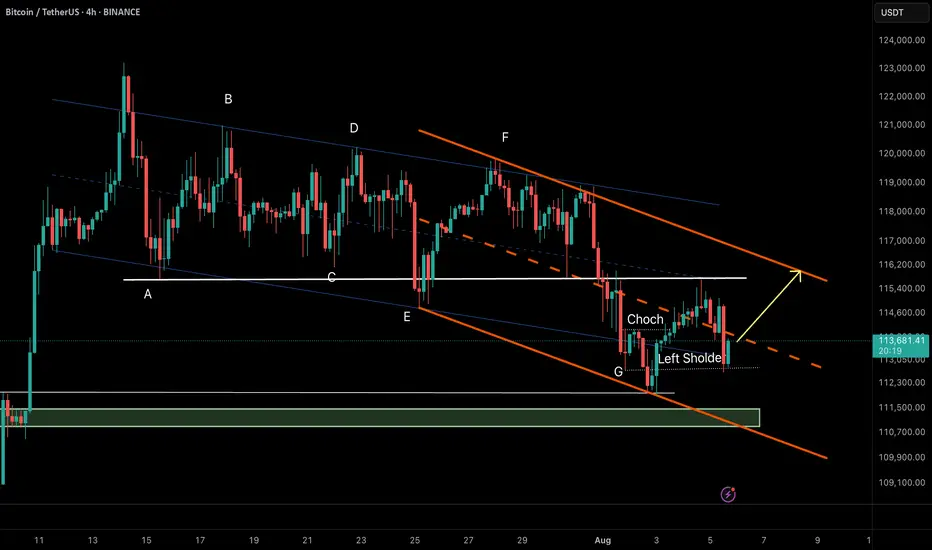
Bitcoin (BTC/USDT) – RTM Reversal Pattern in Action🔸 Market Structure:
Bitcoin has formed a descending channel after a prolonged correction. Recently, price tapped the channel bottom and printed a CHoCH (Change of Character), indicating a potential reversal.
The price has now retraced to the left shoulder of a potential inverse head & shoulders pattern—an RTM classic structure—which held as support, suggesting bullish continuation.
⸻
🔸 Key Technical Signals:
• ✅ CHoCH confirmed at demand zone near $112,300
• ✅ Retest of the left shoulder validates bullish structure
• ✅ Holding above the internal bullish trendline
• ✅ Price aiming toward upper channel resistance
⸻
🎯 Target:
$116,200 – Top of the descending channel & next key resistance.
❌ Invalidation:
Break and close below $112,800 would invalidate the current RTM setup and open room for deeper correction.
⸻
📌 Summary:
This is a textbook RTM reversal:
CHoCH → Retracement → Left Shoulder Test → Continuation
As long as the structure holds, we remain bullish toward the channel top.
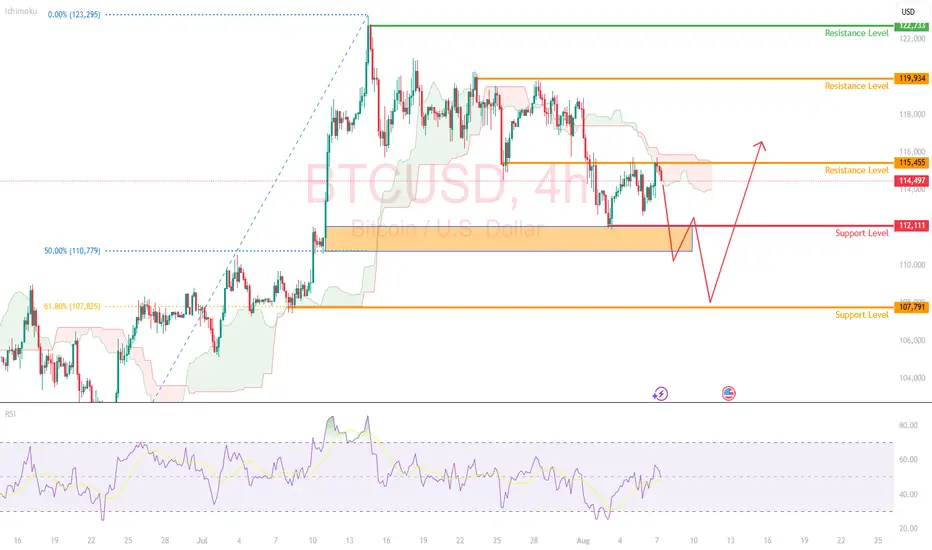
BTCUSD Retrace to ReboundBitcoin is currently trading around $114,500 price level and continues to be held below the $116,000 level.
Price remains in a short-term range between $112,000 and $116,000. But signs are emerging that a breakout may be brewing.
Ichimoku Cloud
BTC is trading into a bearish cloud, which further highlights the possibility of continuation within the range.
RSI
RSI is turning lower from the 60 level, away from the overbought region. This could indicate some downside to come (back into the range).
The Anticipation
Look for a possible break to the downside (below the support level of $112,000 and the 50% retracement level).
Eventually, we could see BTC retest the 108,000 support level before a strong rebound, with possibly a new ATH created.
BITCOIN H4 | Heading into 61.8% Fibonacci resistanceBased on the H4 chart analysis, we could see the price rise to the sell entry at 117,165.96, which is a pullback resistance that aligns with the 61.8% Fibonacci retracement and could drop from this level to our take profit.
Stop loss is at 120,590.52, which is a pullback resistance.
Take profit is at 111,694.11, which is a pullback support that is slightly above the 50% Fibonacci retracement.
High Risk Investment Warning
Trading Forex/CFDs on margin carries a high level of risk and may not be suitable for all investors. Leverage can work against you.
Stratos Markets Limited (tradu.com ):
CFDs are complex instruments and come with a high risk of losing money rapidly due to leverage. 65% of retail investor accounts lose money when trading CFDs with this provider. You should consider whether you understand how CFDs work and whether you can afford to take the high risk of losing your money.
Stratos Europe Ltd (tradu.com ):
CFDs are complex instruments and come with a high risk of losing money rapidly due to leverage. 66% of retail investor accounts lose money when trading CFDs with this provider. You should consider whether you understand how CFDs work and whether you can afford to take the high risk of losing your money.
Stratos Global LLC (tradu.com ):
Losses can exceed deposits.
Please be advised that the information presented on TradingView is provided to Tradu (‘Company’, ‘we’) by a third-party provider (‘TFA Global Pte Ltd’). Please be reminded that you are solely responsible for the trading decisions on your account. There is a very high degree of risk involved in trading. Any information and/or content is intended entirely for research, educational and informational purposes only and does not constitute investment or consultation advice or investment strategy. The information is not tailored to the investment needs of any specific person and therefore does not involve a consideration of any of the investment objectives, financial situation or needs of any viewer that may receive it. Kindly also note that past performance is not a reliable indicator of future results. Actual results may differ materially from those anticipated in forward-looking or past performance statements. We assume no liability as to the accuracy or completeness of any of the information and/or content provided herein and the Company cannot be held responsible for any omission, mistake nor for any loss or damage including without limitation to any loss of profit which may arise from reliance on any information supplied by TFA Global Pte Ltd.
The speaker(s) is neither an employee, agent nor representative of Tradu and is therefore acting independently. The opinions given are their own, constitute general market commentary, and do not constitute the opinion or advice of Tradu or any form of personal or investment advice. Tradu neither endorses nor guarantees offerings of third-party speakers, nor is Tradu responsible for the content, veracity or opinions of third-party speakers, presenters or participants.

BITCOIN PULLBACK FROM SUPPLY AREA|SHORT|
✅BITCOIN price grew again
To retest the resistance of 116k
But it is a strong key level
So we are seeing a bearish reaction
And we will likely see a
Further bearish move down
SHORT🔥
✅Like and subscribe to never miss a new idea!✅