BITCOIN PREDICTION: THIS Breaks - and BTC WILL CRASH TO HERE!!!!Yello Paradisers! I’m sharing my Bitcoin prediction with you. We’re using technical analysis on TradingView, specifically Elliott Wave theory.
On the ultra-high time frame, we noticed a Shooting star candlestick pattern. We’re analyzing the channel where the zigzag formation is occurring.
We’re also looking at bearish divergence on the ultra-high time frame chart and the zigzag on the high time frame chart. There’s a bullish divergence visible there. The Fibonacci level at $108,000 is also noteworthy, as is the volume, which shows that bears are still in control on the medium timeframe. We’re also analyzing the head and shoulders target plus bearish divergence on the low time frame. On the low time frame, we’re looking at the impulse of the flat C, which is an expanded flat and is currently creating its fourth wave.
Remember, don’t trade without confirmations. Wait for them before creating a trade. Be disciplined, patient, and emotionally controlled. Only trade the highest probability setups with the greatest risk to reward ratio. This will ensure that you become a long-term profitable professional trader.
Don't be a gambler. Don't try to get rich quick. Make sure that your trading is professionally based on proper strategies and trade tactics.
BTC-D

TradeCityPro | Bitcoin Daily Analysis #146👋 Welcome to TradeCity Pro!
Let’s dive into Bitcoin analysis. In this analysis, I want to take a look at the higher timeframes since conditions in the lower timeframes haven't changed much compared to yesterday, and it’s a good idea to review the broader picture.
📅 Daily Timeframe
In this timeframe, after the completion of the previous corrective leg that extended to the 78,000 zone, Bitcoin started a new uptrend and has managed to climb up to the 122,000 area.
💥 The most important resistance during this move was 110,183, which, as you can see, has been broken, and Bitcoin is still holding above this level.
✔️ The curved trendline we've drawn in the higher timeframes has been broken in this timeframe, but in my view, confirmation of this trendline break comes only after the 110,183 level is broken again to the downside.
⚡️ Currently, the RSI oscillator is sitting on a support level around 38.21. This area is a very important momentum zone for Bitcoin, and if it breaks, the likelihood of downward momentum entering the market increases.
🧩 However, we still need more confirmations for a bearish scenario, and breaking this level on the RSI alone does not confirm a trend reversal.
🔽 If the correction continues, the main support we currently have is at 110,183. The SMA99 also acts as a dynamic support and, if it overlaps with 110,183, will form a very strong PRZ (Potential Reversal Zone).
📈 If the uptrend wants to resume from here, the first trigger confirming trend continuation is the 120,000 high — and breaking the range between 120,000 and 122,000 will start the next bullish leg.
❌ Disclaimer ❌
Trading futures is highly risky and dangerous. If you're not an expert, these triggers may not be suitable for you. You should first learn risk and capital management. You can also use the educational content from this channel.
Finally, these triggers reflect my personal opinions on price action, and the market may move completely against this analysis. So, do your own research before opening any position.

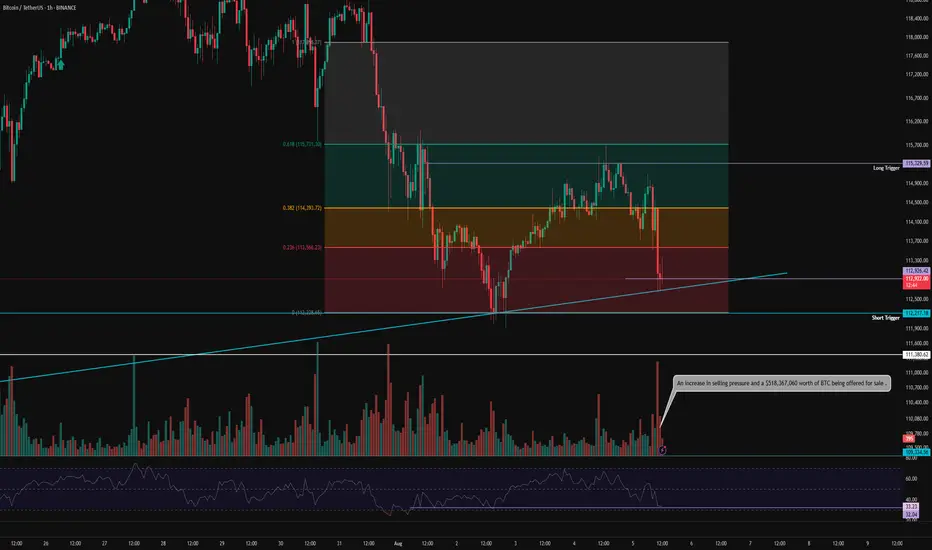
BTC 1H Analysis – Key Triggers Ahead | Day 3💀 Hey , how's it going ? Come over here — Satoshi got something for you !
⏰ We’re analyzing BTC on the 1-hour timeframe .
⏱ We’re analyzing Bitcoin on the 1-hour timeframe.
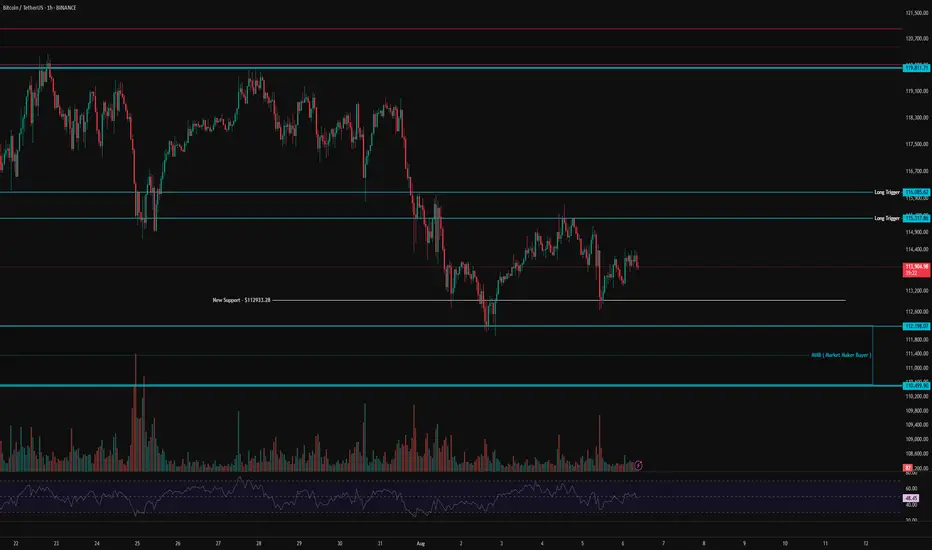
👀 After bouncing from the current $113,000 area, Bitcoin moved upward, indicating the presence of market maker buyers in this zone. A short-term support has formed at $113,000, and yesterday we saw a strong rejection from this level, which helped prevent further selling pressure.
Bitcoin now faces a resistance zone and a potential long entry trigger between $115,317 and $116,085. If long positions increase and short positions get squeezed, this resistance could be broken, potentially fueling a bullish move.
⚙️ On the RSI, our key level is the 50 range. A confirmed hold above this level could signal a higher low forming relative to the previous bottom at $112,933.
🕯 We’re seeing an increase in trading volume, and as the price moves closer to $110,499, there's a noticeable liquidity pull from long positions—more buyers are stepping in around this area.
📈 Our long position trigger lies within the resistance zone mentioned. A confirmed breakout and hold above this level, alongside RSI entering Overbought across multiple timeframes and volume expansion, would give us a solid entry for a long position.
📉 Our short position trigger is below $112,200. A sharp drop with strong selling pressure and RSI entering Oversold would justify a short entry—though I do not recommend taking this trade.
❤️ Disclaimer : This analysis is purely based on my personal opinion and I only trade if the stated triggers are activated .
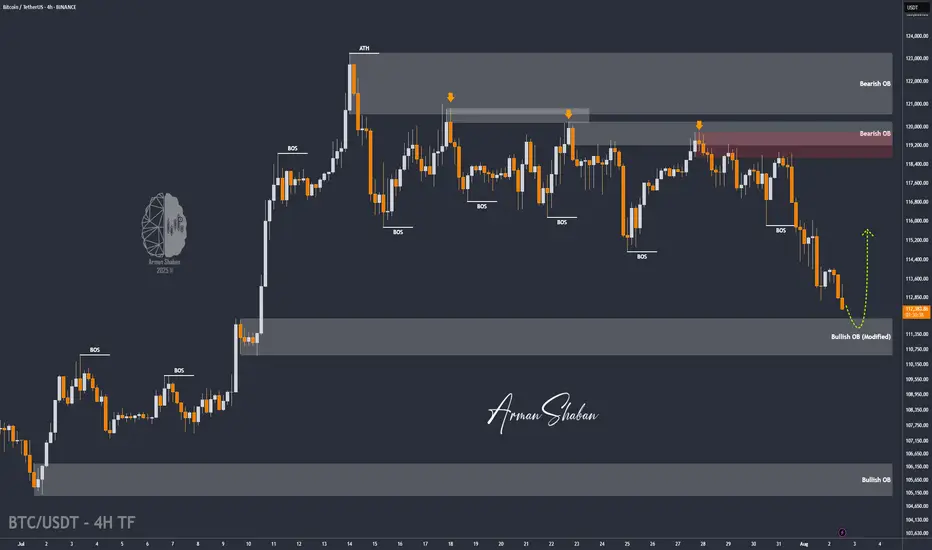
BTC/USDT | Bitcoin Eyes Rebound from $110K Support Zone! (READ)By analyzing the Bitcoin chart on the 4-hour timeframe, we can see that after reaching a new high at $123,218, the price began to pull back and has now corrected down to around $112,500. I expect the current volatility to ease soon. The next critical support zone lies between $110,500–$112,000 — watch price action closely here, as BTC could bounce from this area and push back toward $116,000+. Other key demand zones are located at $109,000, $107,900, and the $105,000–$106,000 range.
Please support me with your likes and comments to motivate me to share more analysis with you and share your opinion about the possible trend of this chart with me !
Best Regards , Arman Shaban
Support & Resistance – Quick Guide In 5 StepsSupport and resistance are key concepts in technical analysis that help traders identify where price is likely to react.
Support acts like a floor — a level where buying interest is strong enough to prevent further declines.
Resistance acts like a ceiling — a level where selling pressure can stop price from rising.
These zones often lead to bounces, reversals, or breakouts, and are used to plan entries, exits, and stop-losses.
How to Identify them:
1. Assess the chart.
2. Identify Swing Points: Look for repeated highs/lows and label them. (Flags)
3. Multiple touches: Highlight the zones with multiple touches. 2+ Touches are stronger.
4. Define: Clearly define the zones. Above is resistance, below is support.
5. Entry: When price makes it way down to support, wait for the reversal. Upon reversal enter on the low time confirmation. Ensure price has failed to break below the support.
Then set TP to the previous High/Resistance zone.
Tips:
Always treat S&R as zones, not exact lines.
Combine with trend, candlestick patterns, or volume for better confluences.
Avoid trading into strong S/R — wait for breaks or retests.

Bitcoin Short SetupHi everyone.
In Bitcoin 1H TF we have a CHoCH followed by a BOS and a pullback, I think it is possible the price meet this area and then continue to go down...
Let's see what happens...
Good luck

Bitcoin Ready for Takeoff - $150K Target Ahead! MARKETSCOM:BITCOIN is showing impressive strength after successfully retesting its May high and bouncing back with conviction. This level, along with the 50 EMA, is currently acting as a strong support zone. Holding above this area signals that buyers are in control, and this zone now serves as a major support for the ongoing bullish trend.
At the moment, CRYPTOCAP:BTC is facing minor resistance in the $115K–$116K range. A decisive breakout above this level is likely to trigger strong momentum, opening the doors for a new all-time high. Once this resistance is cleared, our previous projection of $150K comes into play as the next major target.
For now, it’s crucial for MARKETSCOM:BITCOIN to hold the current support zone to maintain the bullish structure. As always, traders should manage risk effectively and place stop-losses to protect their capital in case of unexpected volatility.
Follow Our Tradingview Account for More Technical Analysis Updates, | Like, Share and Comment Your thoughts

BITCOIN Swing Long! Buy!
Hello,Traders!
BITCOIN went down from
The highs but a strong support
Level is below around 112k$
So after the retest we will be
Expecting a local bullish rebound
Buy!
Comment and subscribe to help us grow!
Check out other forecasts below too!
Disclosure: I am part of Trade Nation's Influencer program and receive a monthly fee for using their TradingView charts in my analysis.

Next Volatility Period: Around August 13th (August 12th-14th)
Hello, fellow traders!
Follow us to get the latest information quickly.
Have a great day!
-------------------------------------
(USDT 12M Chart)
A lot of money has been flowing into the coin market through USDT.
A decline in USDT indicates capital outflow from the coin market.
(USDT.D 12M chart)
As USDT continues to rise, its dominance naturally rises.
However, if USDT is used to purchase coins (tokens) in the coin market, its dominance will decline.
USDT dominance peaked in 2022 and is showing a downward trend.
This indicates that a significant amount of capital flowing into the coin market was used to purchase coins (tokens).
USDT dominance is expected to fall to around 2.84 this year before beginning an upward trend, marking the end of its three-year bull market.
I believe this trend will inject new vitality into the coin market.
For the coin market to maintain an upward trend, USDT dominance must remain below 4.91 or show a downward trend.
If this fails and the price rises above 4.91, the coin market is likely already in a downward trend.
A decline occurred on May 8, 2025, creating a reverse trend.
To maintain this reverse trend, we need to see if it can fall below 4.24.
If USDT dominance declines, the coin market is likely to show an upward trend.
------------------------------------------------------
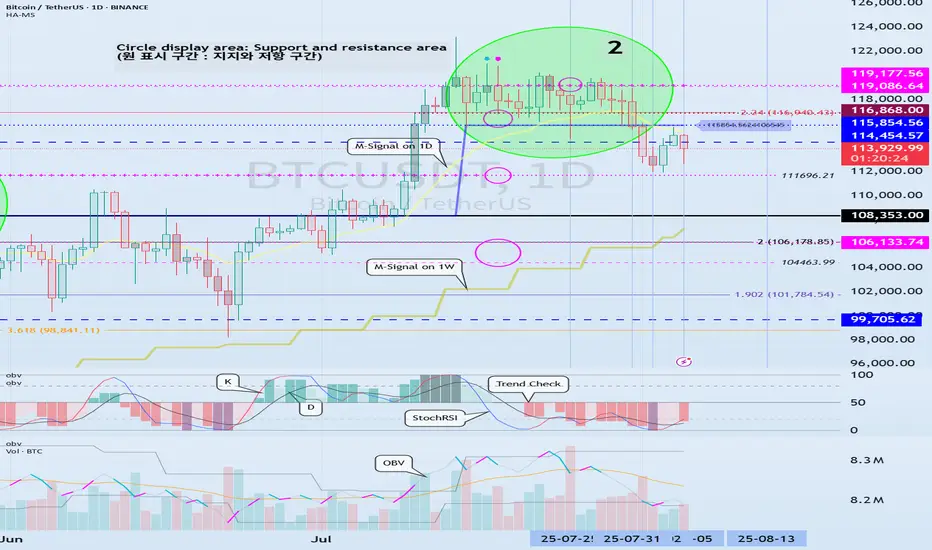
(BTCUSDT 1D chart)
As the new week begins, the HA-High indicator on the 1W chart is showing signs of forming a new level at 114454.57.
Accordingly, the key question is whether the price can rise after finding support in the 114454.57-115854.56 range.
The formation of the HA-High indicator means that the price has fallen from its high.
This also means that further declines are highly likely.
Therefore, if possible, the price should rise above the 114454.57-115854.56 range and maintain its upward momentum.
This period of volatility is expected to last until August 6th.
Therefore, the key question is whether the price can rise above the 114454.57-115854.56 range after the volatility period.
If not, we assume the price will decline until it meets the HA-Low indicator and consider countermeasures accordingly.
This is because the HA-Low and HA-High indicators are paired.
As the price declines, indicators such as the HA-Low or DOM(-60) may appear.
Therefore, if the price declines, you should monitor for the emergence of indicators such as the HA-Low or DOM(-60).
The basic trading strategy is to buy between the DOM(-60) and HA-Low ranges and sell between the HA-High and DOM(60) ranges.
-
If the price falls below the M-Signal indicator on the 1D chart, it is highly likely that the trend will be re-established upon meeting the M-Signal indicator on the 1W chart.
Therefore, if the price fails to rise to the 114454.57-115854.56 range, it is highly likely that the price will eventually meet the M-Signal indicator on the 1W chart.
At this time, a key support and resistance level is expected to be around 108353.0.
When new support and resistance levels are formed, they must remain horizontal for at least three candlesticks to function as support and resistance.
In other words, the HA-High indicator on the 1W chart is showing signs of forming, but it hasn't yet.
Therefore, if the current price holds this week, it will form next week.
Therefore, for the HA-High indicator to function properly as support and resistance, it must remain horizontal for three candlesticks, or three weeks.
This rule must be acquired through significant time and observation.
-
If you sold partially in the 115854.56-119177.56 range according to your basic trading strategy, you will find it easier to observe the current movement. If not, you will likely become anxious.
The key to trading is maintaining a stable psychological state.
If you begin to feel anxious, you should consider how to stabilize your psychological state.
Otherwise, you'll end up making the wrong trades.
-
Thank you for reading to the end.
I wish you successful trading.
--------------------------------------------------
- Here's an explanation of the big picture.
(3-year bull market, 1-year bear market pattern)
I'll explain more in detail when the bear market begins.
------------------------------------------------------
BTC 8H – Fib Support Holds, Will Bulls Defend This Reclaim Zone?Bitcoin is back at a key decision point on the 8H chart — retesting the exact zone it broke out from just two weeks ago. This former resistance has flipped to support, but with momentum cooling off, bulls need to step in fast to avoid a deeper retrace.
🔹 Structure & Levels
Price is hovering inside a reclaimed range (blue box), retesting it from above.
Just below sits the Golden Pocket (0.5–0.618) retracement zone from the July rally — a classic bounce zone if the reclaim fails.
The 0.5 level at $110,879 aligns with previous consolidation structure, adding extra confluence.
Further below lies the 0.786 at $103,802, which marks invalidation for most swing long setups.
🔹 Momentum Check
The Stoch RSI has started curling down from overbought, suggesting momentum may stall short term.
If bulls can’t defend the current reclaim zone, we could see a flush into the Fib pocket before trend continuation.
🔹 Bias & Trade Idea
Holding this level = bullish continuation toward $118K–$120K range highs.
Lose it cleanly = watch for signs of reversal inside the golden pocket.
Risk is defined, structure is clear — and BTC has a habit of reacting cleanly to these zones.
Are you buying the dip now — or waiting for a cleaner tag of the Fib levels?
Drop your thoughts 👇

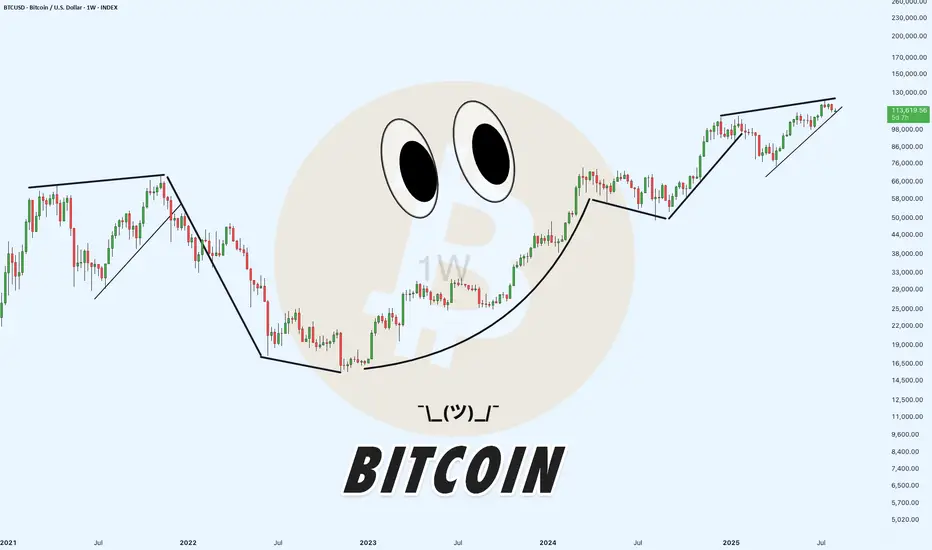
Updated chart: 1050 days of bull, 380 days of bearEach cycle fits quite neatly into ca. 1050 days of bull market and 375 days of bear. Sell in Sep/Oct 2025. Buy in Nov 2026.
An argument can be made that 2021 was a botched bull run. By the time we got to the second peak, Bitcoin was already running out of steam. One single peak would have topped around 100k. I blame SBF/Alameda.
People who are trying to extrapolate/do curve fitting through that 2021 peak will underestimate 2025.
2021 should be ignored as an exception.

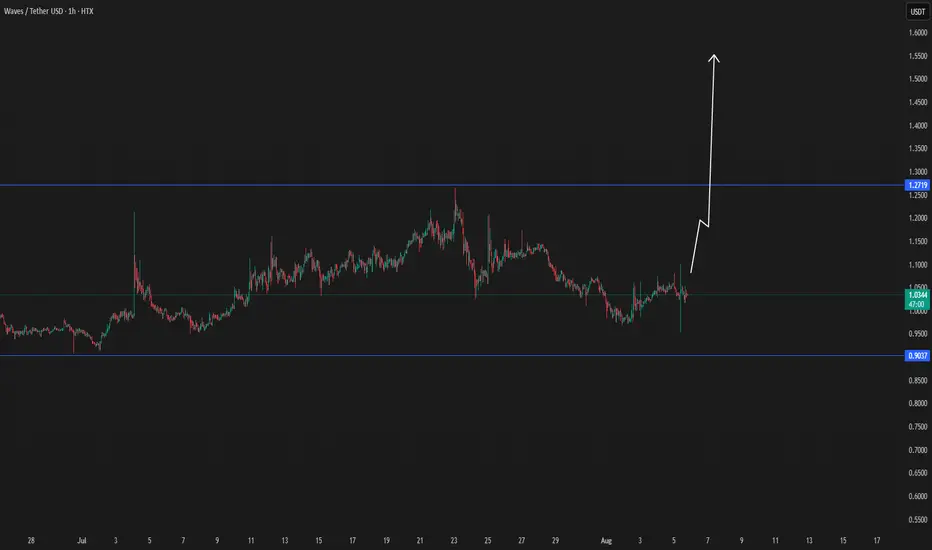
WAVES/USDT BREAK 3.0There is good chance for wave break and focus goes there to check it in the coming time frames.
Bear trap on its way - Bitcoin Weekly Update August 4-10thThis week brings a series of macroeconomic and geopolitical developments that may influence global risk sentiment and, consequently, Bitcoin’s price trajectory.
On Monday, the U.S. releases Factory Orders, a key indicator of industrial demand. Surprises in this data can affect risk assets broadly, as they reflect business investment activity. Weak numbers would likely increase expectations of monetary easing, which tends to support Bitcoin.
On Tuesday, the spotlight turns to the ISM Non-Manufacturing PMI, a leading indicator for the U.S. services sector, which accounts for roughly 70% of GDP. A significant deviation from expectations—especially a decline—could reinforce rate-cut expectations and provide tailwinds for speculative assets like Bitcoin.
Thursday is a critical day, with the Bank of England's interest rate decision in focus. While direct effects on crypto are limited, a hawkish stance could weigh on global risk appetite if inflation concerns resurface. Also on Thursday, the U.S. releases its weekly Initial Jobless Claims—a timely barometer of labor market strength. A rising trend here would suggest economic cooling, strengthening the case for looser policy and potentially benefiting crypto.
However, the most geopolitically sensitive event this week is the reintroduction of country-specific reciprocal tariffs by the United States, taking effect on August 7. Affected countries include Canada (35%), Mexico (30%), and Brazil (50%). These measures could re-escalate trade tensions and trigger short-term market volatility. Retaliatory responses from these countries would likely fuel risk-off sentiment, pressuring assets across the board.
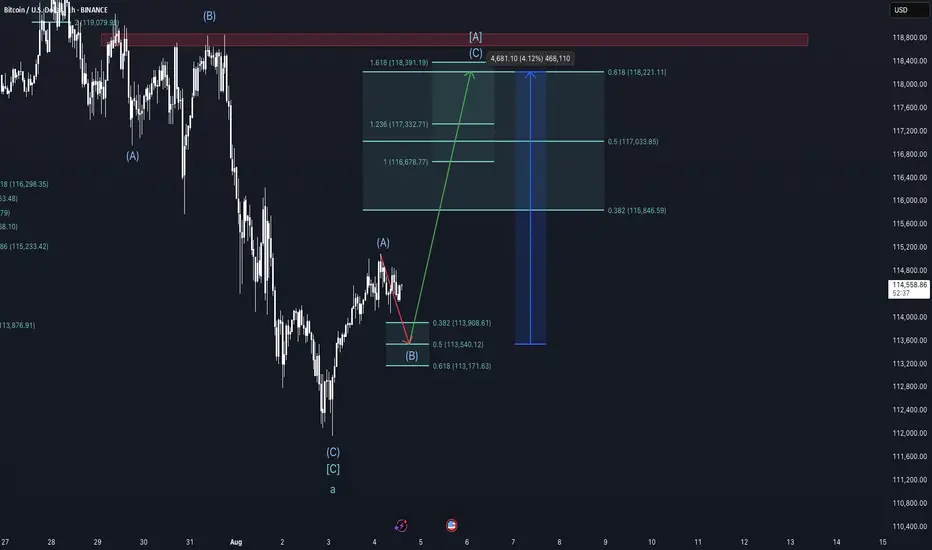
From a technical standpoint, Bitcoin remains within a multi-degree corrective structure according to the Elliott Wave framework. On the cycle degree, we are in a B-wave; on the primary degree, in an A-wave; on the intermediate degree, in a B-wave; and on the minor degree, in a C-wave. This implies that a short-term move lower is still expected, but once complete, a relief rally of approximately 4% could follow before the onset of a larger correction, likely Primary Wave B.
Chart structure suggests that Minor Wave C is in its late stages. Early signs of exhaustion, such as waning downside momentum or bullish reaction at key support zones, could offer clues of an approaching bottom. However, such a rebound should be viewed as temporary and not a trend reversal.
Taking a view between the lines on the on-chain data, the liquidity heatmap shows major liquidity around the red rectangle drawn into the chart, suggesting higher prices. Also, the rather low funding rate on futures suggest an exhausted downward trend and a trend reversal in the near future is likely.
Conclusion:
This week’s calendar offers several macroeconomic catalysts with the potential to move markets. U.S. economic data and tariff policy developments will likely shape near-term sentiment. Technically, Bitcoin remains in a corrective phase with limited downside left before a short-term recovery becomes more probable. Traders should stay alert for signs of a local bottom to position for a tactical bounce—but be cautious, as a larger correction likely looms beyond that.
This is no financial advice and for educational purposes only.
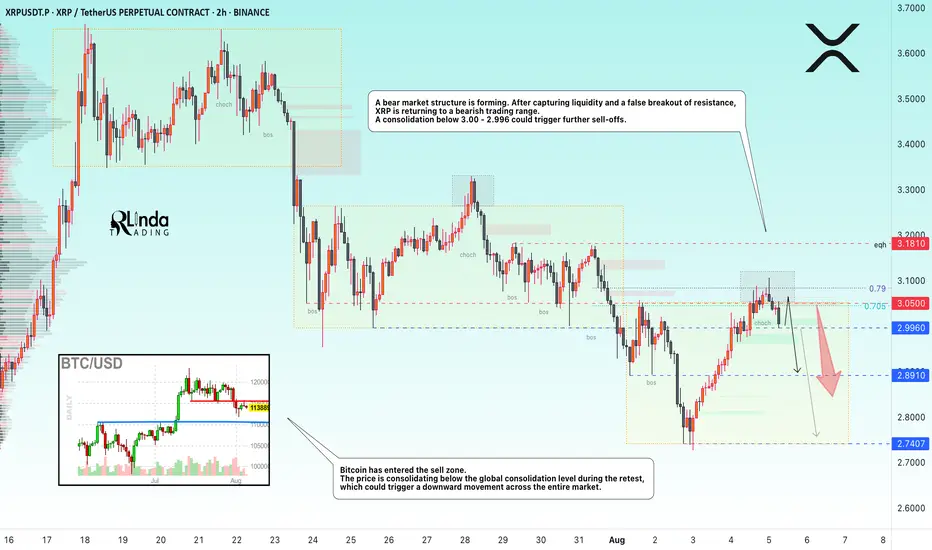
XRPUSDT → Hunting for liquidity ahead of a possible declineBINANCE:XRPUSDT.P is forming a downward market structure after a false breakout of global resistance. Bitcoin is in a correction phase and, after a slight rebound, may continue its movement...
Bitcoin has entered the sell zone. The price is consolidating below the global consolidation boundary of 115,500 during the retest, and if Bitcoin continues to decline, this could trigger a downward movement across the entire cryptocurrency market.
XRP is forming a bearish market structure. After capturing liquidity and a false breakout of resistance, the price is returning to a bearish trading range. There is no potential for continued growth at this time. A consolidation of the price below 3.00 - 2.996 could trigger further sell-offs.
Resistance levels: 2.996, 3.050, 3.181
Support levels: 2.996, 2.891, 2.74
The local bearish structure will be broken if the price starts to rise, breaks 3.050, and consolidates above it. In this case, XRP may test 3.181 before falling further.
At the moment, after a false breakout of resistance, the price is consolidating in the selling zone, and the downward movement may continue. I consider 2.74 - 2.655 to be the zone of interest in the medium term.
Best regards, R. Linda!
Bitcoin fixed above the $112k ┆ HolderStatOKX:BTCUSDT is recovering after touching the $111,940 zone, now confirmed as strong support. The price is reversing from the lower wedge boundary, suggesting renewed momentum. A clean push could retarget $122,250 in coming sessions.

BTC 1H Analysis – Key Triggers Ahead | Day 2💀 Hey , how's it going ? Come over here — Satoshi got something for you !
⏰ We’re analyzing BTC on the 1-hour timeframe .
👀 After the strengthening of the US dollar , Bitcoin experienced a drop and formed a short-term support bottom around the $113,000 level . It is currently completing a pullback to the levels of this recent decline .
🎮 Our Fibonacci retracement is drawn from the breakout zone to the $112,200 bottom . Bitcoin broke below the 0.236 level and then found support . The best potential entry trigger, based on Fibonacci, is at the 0.382 level, or around $115,000 . If Bitcoin breaks above this level , it could form a higher high and a higher low in this timeframe .
⚙️ The RSI is showing a support level around 32 , which is currently preventing Bitcoin from entering the oversold zone . However , if this support is lost , Bitcoin could move into oversold territory .
📈 Our long position trigger is at the 0.382 Fibonacci level . A confirmed breakout of this level , combined with RSI overbuying and increased volume , would be our entry signal .
📉 Our short position trigger is around $113,000 . If this support breaks , we may open a short position . However, the main short trigger is at the 0 Fibonacci level ( support at $112,200 ) . If selling pressure increases and RSI enters the oversold zone , we will consider entering a short position with confirmation .
❤️ Disclaimer : This analysis is purely based on my personal opinion and I only trade if the stated triggers are activated .
Hedera (HBAR) – Pullback Opportunity After 100% RallyHBAR has surged 100% recently. With the broader market entering contraction, we’re now watching for a healthy retracement into key support, aligning with the 50% Fibonacci level and a fair value gap (FVG). This could be the formation of a higher low before continuation.
🔍 Setup Overview:
Entry Zone: $0.22 – $0.19
Take Profits: $0.26 / $0.32 / $0.37
Stop Loss: Daily close below $0.18
Bias: Bullish continuation from support
🧠 Trade Idea:
Price is approaching a confluence zone of Fib support and unfilled imbalance. As long as daily structure holds above $0.18, the bullish case remains intact. This zone offers an attractive long setup for the next move higher, targeting previous resistance levels.
⚠️ Invalidation:
A daily close under $0.18 would break structure and invalidate the setup. Monitor price action and volume confirmation around this support zone for entry timing.

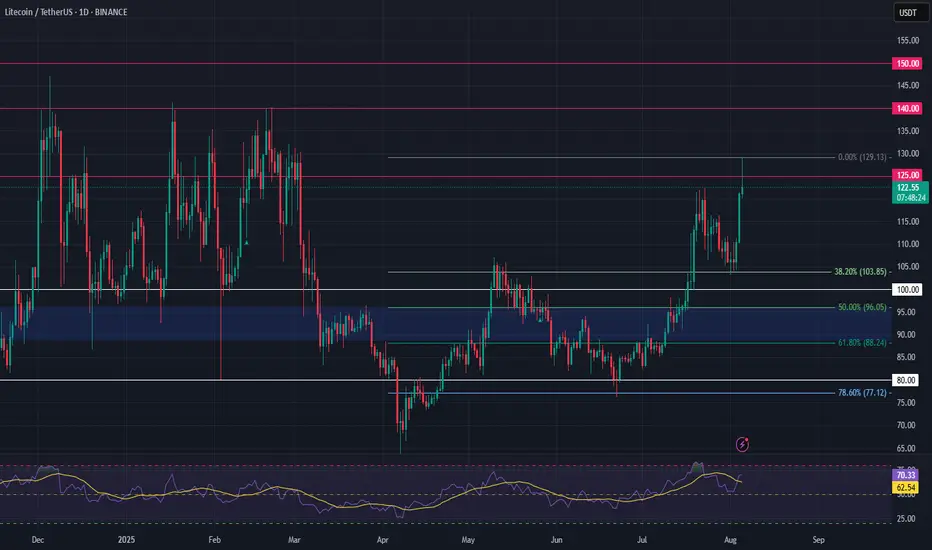
Litecoin (LTC) – Re-Entry After 44% RallyLTC rallied over 44% since our last trade setup. Now, we’re looking for a re-entry opportunity as the broader crypto market shows signs of a potential pullback.
🔍 Setup Overview:
Entry Zone: $108 – $103
Take Profits: $125 / $140 / $150
Stop Loss: Daily close below $100
Bias: Bullish continuation (as long as structure holds)
🧠 Trade Idea:
Expecting a possible sweep of the $104 low before upside resumes. Key condition: Daily candle must not close below $100—wicks are fine. If price respects this level, the bullish structure remains intact.
This is a classic liquidity grab scenario. Entering in the $108–103 zone allows favorable risk-to-reward if LTC catches support and reclaims momentum.
⚠️ Invalidation:
If LTC posts a daily close below $100, trade setup becomes invalid. Monitor price action closely around this key support zone.
TradeCityPro | Bitcoin Daily Analysis #145👋 Welcome to TradeCity Pro!
Let’s get into Bitcoin analysis. Yesterday, Bitcoin was rejected from the zone I had mentioned, and today it will probably begin its new downward move.
⏳ 4-Hour Timeframe
In yesterday’s analysis, I told you that a pullback to SMA25 and the 0.5 Fibonacci zone was possible. That happened, and now, given the current candle, the probability of a corrective scenario has increased.
✔️ I still won’t open any position on Bitcoin and am waiting for it to exit the box between 110000 and 116000. But if certain conditions occur in the market, I might open a position inside this box as well.
✨ First of all, Bitcoin is still above the 111747 support, which is a very important support zone. As the price reaches it, there’s a chance it gets stuck there again.
📊 On the other hand, seller strength is very high, and as you can see, the RSI has been rejected from the 50 ceiling, and a red engulfing candle with very high volume is forming — all of which indicate the power of sellers.
🔽 I still stand by my opinion that as long as the price is above 110000, I won’t open a short position. But for a long position, we can move to the 1-Hour timeframe to review the trigger that has formed.
⏳ 1-Hour Timeframe
Before reviewing the triggers, there’s a very important point that explains why I currently prefer to remain without a position.
💫 Bitcoin in the HWC and MWC cycles has a very strong upward trend. Right now, in the LWC, it’s moving downward. So this Fibonacci drawn on the bearish leg doesn’t really mean much and won’t give us very strong and accurate resistances.
🔍 On the other hand, the LWC is moving against the higher cycles — meaning the higher cycles are stronger. That’s why shorting doesn’t make sense, since it’s against the main market cycle.
🔑 But also, since LWC has gained downward momentum, long positions — if not set with wide stop-losses — will likely get stopped out, because this momentum may cause small downward legs that hit stop-losses.
👀 So opening a long position is also difficult right now, and that’s why I say it’s better to wait for the price to move out of the 110000 to 116000 range, and then enter a position more comfortably.
🎲 If the price goes below 110000, we’ll receive the first sign of a trend reversal in the MWC, and then we can open short positions. And if it goes above 116000, LWC becomes bullish again and the continuation of the uptrend can begin.
Let’s now go to the triggers:
📈 The trigger we have for a long position is 115327 — an important ceiling that overlaps with the 0.5 Fibonacci level and has been touched several times.
☘️ If we get another touch to this level, I myself will likely try to open a long position, and I think it’s a good entry point that’s worth the risk to anticipate a breakout of 116000.
🔽 For a short position, a break below the 112205 low will start the continuation of the correction. I won’t open this position myself, but if you believe Bitcoin wants to reverse its trend, this is a very good trigger in terms of price level and you can open the position.
❌ Disclaimer ❌
Trading futures is highly risky and dangerous. If you're not an expert, these triggers may not be suitable for you. You should first learn risk and capital management. You can also use the educational content from this channel.
Finally, these triggers reflect my personal opinions on price action, and the market may move completely against this analysis. So, do your own research before opening any position.

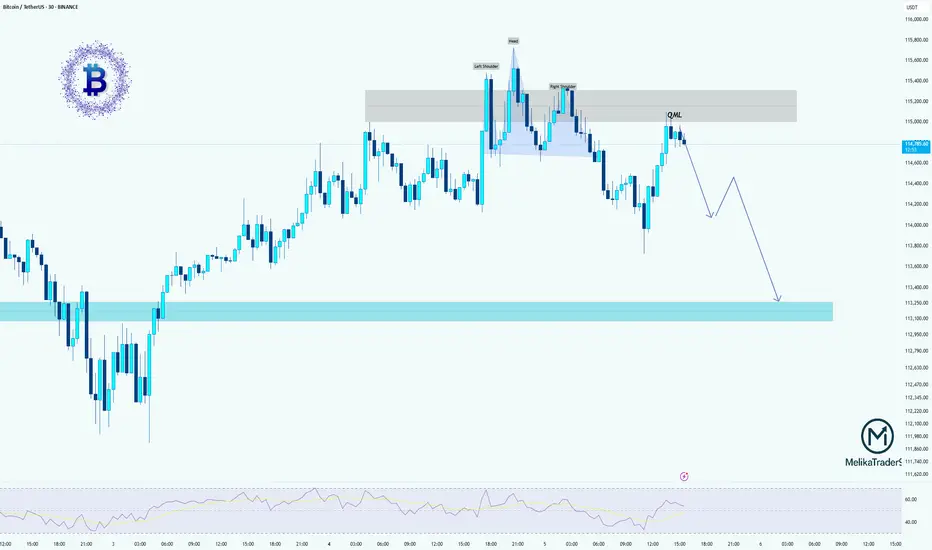
BTCUSDT: Head & Shoulders + QML SetupHello guys!
We have a clean Head & Shoulders pattern forming near a supply zone, with a nice QML (Quasimodo Level) rejection confirming the bearish bias. Price is struggling to break above 115K and has already reacted to the QML zone.
If this structure holds, we could see BTC start a new bearish leg 📉, first targeting 114K, and eventually reaching the demand zone around 112.8K–113.2K.
Watch for further confirmation with lower highs forming.
BTC - Short Setup at 0.702 Fibonacci & Fair Value GapMarket Context
Bitcoin recently rejected from a major resistance area and has since been retracing downward, finding temporary support inside a bullish Fair Value Gap. The market is currently in a corrective phase, with buyers attempting to defend lower levels while sellers look for optimal positions to reload shorts. This environment shows a classic tug-of-war between these two forces as price moves between supply and demand zones.
Consolidation and Current Phase
Although the prior consolidation has been broken, the current price action can still be described as corrective, with intraday structure forming lower highs. The bullish Fair Value Gap beneath price has been respected so far, creating a temporary base. However, the path remains complex, as the market has unfilled imbalances both above and below.
Bearish Retest Scenario
One key scenario involves a retracement toward the bearish Fair Value Gap near 117K, which also aligns with the 0.702 Fibonacci retracement level. This confluence makes it a high-probability area for sellers to step in again. A rejection from that zone would likely resume the downtrend, with the next logical target being the deeper unfilled bullish Fair Value Gap around 110K. This zone acts as a magnet for price due to the inefficiency left behind during the last rally.
Bullish Defense Scenario
For bulls to regain control, the current Fair Value Gap at 114K must hold, followed by a strong move that invalidates the lower-high structure. Such a move would need to break above the 117K bearish FVG with conviction. Only then could momentum shift back to the upside, opening the door for another challenge of the higher resistance zones.
Final Words
Patience and precision are key when dealing with setups like this. Let the market come to your level — and react with intent.
If you found this breakdown helpful, a like is much appreciated! Let me know in the comments what you think or if you’re watching the same zones.

Moon Street Cheat Sheet
All same color lines are idendical to eachother ( copies )
3 times since BTC's beginning, they have been pretty accurate with both time and angle ( on log chart )
is 4th time the charm , or was it the 3rd ?
We shall see
