Bitcoin Near $125K Resistance — Is the Rally Over?Bitcoin ( BINANCE:BTCUSDT ) increased to $120,000 after breaking resistances , as I expected in my previous idea .
Bitcoin has already managed to break the Resistance zone($121,000-$119,000) and is moving near the Potential Reversal Zone(PRZ) .
According to Elliott Wave theory , Bitcoin is completing the 5th major impulse wave . In my opinion, this is the last bullish wave of Bitcoin, and after that we should wait for the main correction of Bitcoin . Do you agree with me that it is time to run and take profit!?
To get a better view of the main waves , I suggest you look at the idea below .
Also, since Bitcoin is correlated with the S&P500 Index ( SP:SPX ) and since I also foresee the possibility of a correction in the S&P500 Index, it is also possible to expect a decrease in the price of Bitcoin based on the S&P500 Index analysis .
I expect Bitcoin to start declining after entering the Cumulative Short Liquidation Leverage($125,000-$122,580) and Potential Reversal Zone(PRZ) and at least fill the CME Gap($119,100-$117,425) .
Note: There are heavy sell orders around $125,000.
Cumulative Long Liquidation Leverage: $120,866-$119,442
Cumulative Long Liquidation Leverage: $117,743-$115,452
What is your opinion on Bitcoin and its trend? Can it see $130,000, or will a main correction begin?
Please respect each other's ideas and express them politely if you agree or disagree.
Bitcoin Analyze (BTCUSDT), 2-hour time frame.
Be sure to follow the updated ideas.
Do not forget to put a Stop loss for your positions (For every position you want to open).
Please follow your strategy and updates; this is just my Idea, and I will gladly see your ideas in this post.
Please do not forget the ✅' like '✅ button 🙏😊 & Share it with your friends; thanks, and Trade safe.
Btc-e

Bitcoin Monthly Update + Top Altcoins Choice, Your PickThis is a monthly Bitcoin chart and is really interesting, it supports without a shadow of doubt a strong continuation and bullish bias.
First, the month started red but is now green. This is always a strong signal when the action starts bad but recovers quickly during the month just to end up good. Starts red to end up closing green.
Bitcoin also closed four consecutive months green. This one will be the fifth month. Since the bears already gave everything trying to push prices lower and failed, we know higher prices are guaranteed next.
We also know this because Ethereum just hit its highest price since December 2021, near the top of the last bull market. Now we have Bitcoin, XRP and Ethereum, the top three Cryptos and the biggest projects, moving forward and doing great.
It is only natural. It is the logical sequence, the smaller pairs/projects will do the exact same.
Just as XRP gained in bullish momentum and hit a new all-time high, to follow Bitcoin, Ether did the same. Then we have Solana and Cardano, Dogecoin, Toncoin, Polkadot, Shiba Inu, Avalanche, Notcoin, Chainlink, Bitcoin Cash, Uniswap and the rest.
They are preparing to grow now and are bullish now. Ready to grow and strong.
No more retraces, no more corrections; the 2025 bull market wave & bull run is getting close.
The next immediate target is $137,206. Notice how the $122,630 target on this chart was hit perfectly. So these numbers are good and work long-term.
» After $137,206, Bitcoin is set to hit $155,000.
(Leave a comment with your Top Altcoins Choice, I will do an analysis for you!)
Thank you for reading.
Namaste.

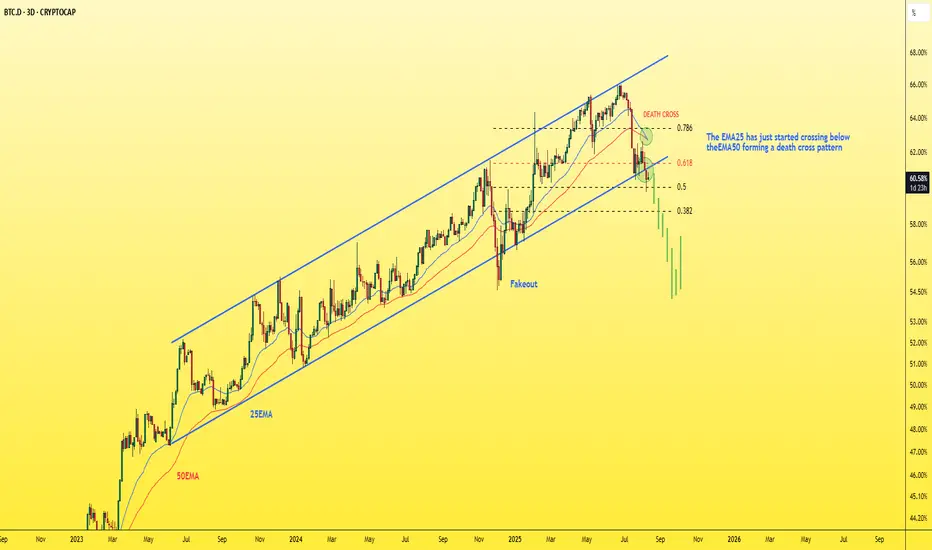
Dominance - Deep dive into Dominance chart!Did you know that dominance is on the verge of collapsing in the coming days? Let me tell you why.
🔸On the 3-day dominance chart:
- We have the beginning of a break of the ascending channel, a close below it, and a retest.
- There’s also a break of an important support level at 0.618 Fibonacci, followed by a retest, and it’s currently trading below it.
- Plus, we have a death cross where the EMA25 crossed below the EMA50.
That’s three confirmations on one chart — can you imagine?
The coming days will likely see a strong pump in altcoins. Remember my words.
Best Regards:
Ceciliones🎯
BITCOIN Can $160k be the Top???Bitcoin (BTCUSD) closed last week on strong bullish fashion as it completed a formidable green 1W candle following a technical bounce on its 1D MA50 (red trend-line). This is a strong bullish signal as every time the (orange) Fibonacci Channel rebounded on its 1D MA50 after a 1W MA50 (blue trend-line) bounce, BTC extended the uptrend towards a new technical Higher High.
Based on the 1W LMACD, we could be roughly half-way (blue circle) through such a Bullish Leg. As you can see, those Bullish Legs have typically made rounded Tops (red Arcs), with the last two both breaking above the Fib Channel's 0.236 level. At the same time, on the horizontal Fib level, the sequence has applied significant importance to every .618 and .0 interval, with peaks on the 0.618, 1.0, 1.618, 2.0, 2.618. Now what's left realistically before the end of the Cycle at the end of the year are 3.0 and 3.618.
As a result, a rather modest potential Top projection is $160000, which is even conveniently placed just below the 0.236 Channel Fib from late October onwards.
Do you think that could be a potential Cycle Top candidate? Feel free to let us know in the comments section below!
-------------------------------------------------------------------------------
** Please LIKE 👍, FOLLOW ✅, SHARE 🙌 and COMMENT ✍ if you enjoy this idea! Also share your ideas and charts in the comments section below! This is best way to keep it relevant, support us, keep the content here free and allow the idea to reach as many people as possible. **
-------------------------------------------------------------------------------
💸💸💸💸💸💸
👇 👇 👇 👇 👇 👇

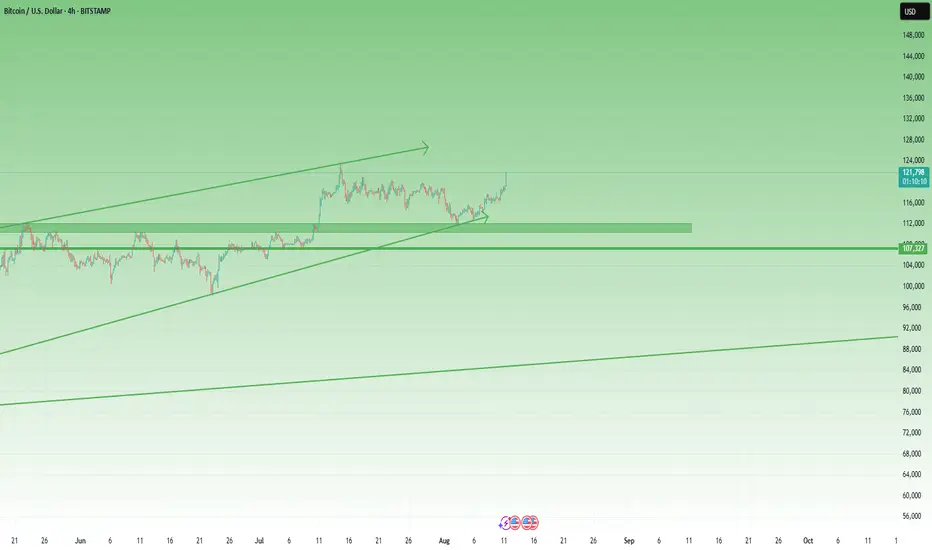
BTC Bulls Back in Control – 130K in SightIn my previous BTC analysis, I highlighted that the price was sitting right in a confluence support zone, with strong odds for a bullish reversal.
That scenario played out well — bulls regained control. After a retest of the low pruces in the middle of last week and a modest initial bounce, momentum accelerated today, pushing BTC close to its previous all-time high at the time of writing.
Looking ahead, I don’t expect the old ATH to be a major obstacle for buyers. A clean break above should open the path toward 130K+ as the next logical upside target.
For now, as long as BTC trades above 114K, bulls have no reason for concern.
Bitcoin: 120K Break To Push 130Ks?Bitcoin has rallied off the buy signal that I wrote about over the previous week. In order to confirm follow through, price needs to CLOSE decisively above 120K this week. This means a solid candle close, NO pin bars. This needs to be followed by a new candle that breaks the previous candle high quickly, and NOT close weak. The blue rectangle on the chart represents a consolidation resistance where price is likely to test and potentially reject. The question that the market needs to answer is: can price push through this without any effort, OR does it get stuck and start to form bearish candles or reversals?
The wave count that I have been referring to in previous analysis is still intact. Subwave 4 never overlapped subwave 1 which means this move is most likely subwave 5. If you are maintaining a profit, it would be wise to trail your stop at least by two previous candle lows on this time frame. At this moment there is NO reason to sell since there is nothing but strength, BUT understand that it can change at a moments notice. It is within reason to wait and see IF price breaks out and if you are long from my price suggestion in my previous analysis, you have the luxury and flexibility to wait it out.
I regularly bring this up during my analysis streams, Wave 5's, ESPECIALLY 5th of 5th waves (which is what this is), imply that the market is highly vulnerable but this WILL not be obvious in any way. Wave 5's can be interpreted as the next wave to follow is LIKELY a corrective structure. This may take some weeks or longer to play out, but knowing that this is a Wave 5 should tell you that risk on the LONG side is ELEVATED. Increasing risk at these levels (same goes for the stock market) is unwise in my humble opinion. Price can run into the 130Ks or higher before it peaks there is NO way to know with any certainty (unless you are Michael Saylor).
Potential catalysts over the next few months can easily change things (NFP, CPI, FOMC meetings). What determines value, especially over the short term is the perception of the future and NOT reality. All it takes is a new "narrative" to proliferate.
Thank you for considering my analysis and perspective.

BTC Elliott Wave medium term analysisCRYPTOCAP:BTC is still consolidating, as shown on the charts.
The structure is shaping up like a classic Elliott Wave 1–2–3–4–5 pattern, with the 4th wave now in play.
This could mean another retest of $110,500 before launching into the final, larger 5th wave 🚀.
The 4th wave might present a solid long entry opportunity heading into the 5th.
📊 DYOR – trade safe.

$BTC Daily UpdateCRYPTOCAP:BTC #Bitcoin $122,809 resistance test rejected, $118,168 current support, 1D closed with bearish pin bar, Previous 4h also bearish with current 4H forming bearish engulfing, $116,908 next support from here, Current support test likely, if followed thru on a bearish engulfing then expect next support test.

BITCOIN BULLS ARE GONNA DO THIS NOW!!!! (Fakeout Wick) Yello Paradisers! In this video, I've been updating Bitcoin price action and the Elliot Wave theory. I've been doing lots of advanced technical stuff. We've been going through channeling and updating ourselves about the most important support and resistance levels. We've been taking a look at the MACD histogram, the RSI, and the stochastic RSI. We've been professionally analyzing the volume; we've understood who is in power right now and what's going to happen next with the highest probability.
We've also been taking a look at what kind of confirmations we are waiting for in order for us to be able to open long or short positions.
Paradisers, make sure that you are trading with a professional trading strategy. Wait for confirmations, play tactically, and focus on long-term profitability, not on getting rich quick.
Remember, don’t trade without confirmations. Wait for them before creating a trade. Be disciplined, patient, and emotionally controlled. Only trade the highest probability setups with the greatest risk to reward ratio. This will ensure that you become a long-term profitable professional trader.
Don't be a gambler. Don't try to get rich quick. Make sure that your trading is professionally based on proper strategies and trade tactics.

#BTC #BTCUSD #BTCUSDT #BITCOIN #Analysis #Eddy#BTC #BTCUSD #BTCUSDT #BITCOIN #Analysis #Eddy
I have identified the important supply and demand zones of the higher timeframe for you.
This analysis is based on a combination of different styles, including the volume style with the ict style.
Based on your strategy and style, get the necessary confirmations for this analysis to enter the trade.
Don't forget about risk and capital management.
The responsibility for the transaction is yours and I have no responsibility for your failure to comply with your risk and capital management.
💬 Note: This is just a possibility And this analysis, like many other analyses, may be violated. Given the specific circumstances of Bitcoin, it is not possible to say with certainty that this will happen, and this is just a view based on the ICT style and strategy with other analytical styles, including the liquidity style. (( The fall of Bitcoin may not change the trend of altcoins and money will move out of Bitcoin and into altcoins, and we will see altcoins grow. ))
Be successful and profitable.

Support and Resistance Areas: 114454.57-115854.56
Hello, traders!
Follow us to get the latest information quickly.
Have a great day!
-------------------------------------
(BTCUSDT 1D Chart)
The K indicator on the StochRSI indicator appears to have entered the overbought zone, leading to a change in slope.
Therefore, the upward trend appears likely to be constrained.
-
We need to confirm whether the price falls within the range indicated by the index finger.
The key question is whether there is support around 114454.57-115854.56.
If it declines, it is likely to continue until it meets the M-Signal indicator on the 1W chart.
At this point, we need to check for support around 108353.0.
This period of volatility is expected to occur around August 13th (August 12th-14th).
The start of a stepwise uptrend is likely to occur only after it rises above 119177.56.
-
Thank you for reading to the end.
We wish you successful trading.
--------------------------------------------------
- This is an explanation of the big picture.
(3-year bull market, 1-year bear market pattern)
I will explain in more detail when the bear market begins.
------------------------------------------------------

TradeCityPro | Bitcoin Daily Analysis #150👋 Welcome to the 150th Bitcoin Analysis on TradingView by TradeCity Pro!
I am very happy that the number of daily Bitcoin analyses has reached 150. I hope the analyses have been useful so far and that you have been able to benefit from them. On this occasion, I want to present a complete and comprehensive analysis of Bitcoin.
📅 Weekly Timeframe
On the weekly timeframe, Bitcoin has been in a very strong uptrend since early 2023. After breaking the 24512 resistance, it made several sharp moves and, in multiple bullish waves, managed to register a new ATH in the 120000 zone.
✨ At the moment, it can be said that Bitcoin is in the seventh wave of its trend, which is quite a high number. The more waves a trend has and the more it shows signs of weakness, the higher the probability of a trend reversal.
📊 Regarding volume, there is not much to say because over time, Bitcoin’s trading volume on Binance has decreased. The reason is partly due to Binance exiting certain countries, and partly due to the growth of the DeFi space, where a significant percentage of trading now happens on DEXs, naturally reducing CEX volume.
⭐ However, if we compare the magnitude, slope, and candlestick size of the bullish waves, the trend weakness is clearly visible. But this does not mean the trend will reverse.
🧩 Many trends, even after showing weakness, continue for several more waves. If this happens for Bitcoin on the weekly timeframe, we can still take many long positions in futures during those waves.
💥 Therefore, this trend weakness is not a solid reason to avoid opening long positions for now. I still believe long positions in futures take priority over short positions.
🛒 For spot, if you have already bought Bitcoin, I suggest you keep holding for now. We can take profit after confirming the trend, but for now, it is better to hold.
🎲 However, for spot buying at current prices, I do not recommend it because it is not worth it. It is better to open futures positions to get a more reasonable profit.
🔔 Now that the 110000 resistance has been broken, the next targets are 128000 and 162000. If RSI enters the Overbought zone, these targets will be within reach.
📅 Daily Timeframe
In the last analysis I shared for this timeframe, the price was in a correction phase, and I mentioned that as long as the price is above 110183, the trend is bullish, and the probability of upward movement is higher than a drop.
🔑 That’s exactly what happened — the price formed a higher low above 110183, and RSI bounced from near the 38.21 support level and moved upward.
🔍 We had a Maker Seller zone between 120000 and 122000, and now the price has penetrated into it.
🔼 It seems to be getting rejected from the top of this zone and today failed to break it. Now we need to see what happens during the New York session.
✔️ In my opinion, it is unlikely that the price will break this top today. The market will probably wait for the U.S. inflation data release tomorrow before deciding on the next move.
📊 If inflation comes in higher than expected, the market will re-enter a correction phase, likely dropping back toward 110183.
📈 If inflation is lower than expected, Bitcoin can break the 122000 resistance and start a new bullish leg.
⏳ 4-Hour Timeframe
On this timeframe, Bitcoin finally broke through the Maker Seller zone it had formed, with a strong bullish candle. After RSI entered the Overbought zone, a Blow Off candle was printed near the 122733 resistance.
☘️ Currently, given the recent red candles, it appears that RSI’s entry into Overbought was a fake-out, and the price has pulled back to 120041.
⚡️ There is a possibility that the price could resume its upward movement from here, as the 120041 zone is an important level that can prevent further declines. In this scenario, the price would also have completed a pullback to the SMA7.
💥 If a deeper correction occurs, the next dynamic support is the SMA25, which is also an important momentum support.
📉 The lower static support levels for Bitcoin are currently 116829 and 115364.
❌ Disclaimer ❌
Trading futures is highly risky and dangerous. If you're not an expert, these triggers may not be suitable for you. You should first learn risk and capital management. You can also use the educational content from this channel.
Finally, these triggers reflect my personal opinions on price action, and the market may move completely against this analysis. So, do your own research before opening any position.

Why the 95% failIt's no secret that over 90% of retail traders lose money. I am not talking about throwing some money into crypto and hoping for the moon type wins or losses. I mean actually trading and making a living from it.
You see, when you start, you are hungry for information - what's the best course, who has the best strategy, what if I trade 25 instruments on a 1-minute timeframe. Surely more profits...
After doing this for over 25 years, you get to see people come and go, sometimes they come back with a new idea and more funds to give the market.
But overall, some of the core problems are - all the gear and no idea.
Not only do people invest in screens, the latest hardware and of course the legendary Bloomberg subscription for 24/7 news.
What about indicators?
Has your screen ever looked a little bit like this?
The issue with more indicators is the majority of them lag to price action, re-paint or are simply not needed. Then combine that with the lack of experience, and you are left questioning do I buy or sell if my RSI is up but the moving average just crossed down?
You are not alone, most traders have been there if not all!
It is hard enough when even the brokers and exchanges fight against you - have you ever seen a scam wick directly to your stop and bounce?
What about the A-book vs the B-book?
In an A-book model, the broker passes their clients' trades directly to the market. Essentially, the broker acts as a middleman, executing trades on behalf of clients in the open market. This means that the broker's profits come primarily from commissions and spreads rather than trading against the client.
B-book, the broker takes the opposite side of the client's trades, essentially acting as the counterparty. Instead of sending trades to the open market, the broker keeps them internally.
The next one that always tickles me is the 100% win rate strategy that someone automated and for a few hundred dollars, it's all yours!!
Look, if there was a silver bullet, a 100% winning strategy you could buy off the shelf - we wouldn't have any other profession on the planet! The world's population would be professional traders. You know the saying " if it sounds too good to be true, it probably is".
You see Elliott waves where they have no right to be. Simply no logic or using them on a tick chart and hoping for miracles.
How about getting some financial advice from a spotty teen who rented a sports car for a video shoot this afternoon? Yeah, sounds like a good plan to help you retire young!
==============================
So, how to avoid all of these things?
Well, to start with, your tradingview chart, on a regular laptop or desktop with one screen, removing all the indicators and increasing the timeframe.
Then you reduce the number of pairs you look at and get to know them. Treat them like a new language. Learn the character traits, how they behave around major news events, what happens to them if the dollar goes up or oil drops 5%.
Don't treat trading like a game.
Instead, treat it like a business, use hours that suit your lifestyle. Deploy proper risk management. Don't see it as a one trade one win type concept. Treat it with respect and profit from it weekly.
You will find, when you learn to manage risk correctly, you care very little about markets going up or down. You tend to sleep with ease and a growing bank balance.
The market has plenty of soldiers fighting on its side, and it does its best to recruit you to fight against yourself!
In summary, less screens, less data inputs (indicators), less instruments, higher timeframes, ignore the influencers, Proper risk management and learn to understand there is no silver bullet.
Trading is statistics and that's all it is.
You can be very profitable with a low strike rate and a large risk-to-reward ratio. Or as simple as a 2% gain per 1% loss and a 50/50 win rate still makes you money!
Disclaimer
This idea does not constitute as financial advice. It is for educational purposes only, our principal trader has over 25 years' experience in stocks, ETF's, and Forex. Hence each trade setup might have different hold times, entry or exit conditions, and will vary from the post/idea shared here. You can use the information from this post to make your own trading plan for the instrument discussed. Trading carries a risk; a high percentage of retail traders lose money. Please keep this in mind when entering any trade. Stay safe.

bitcoin - Time to buy again!The price seems to have completed the fourth corrective wave, and from now on, it's time for a price increase, which will continue up to around $150k .
previous analysis
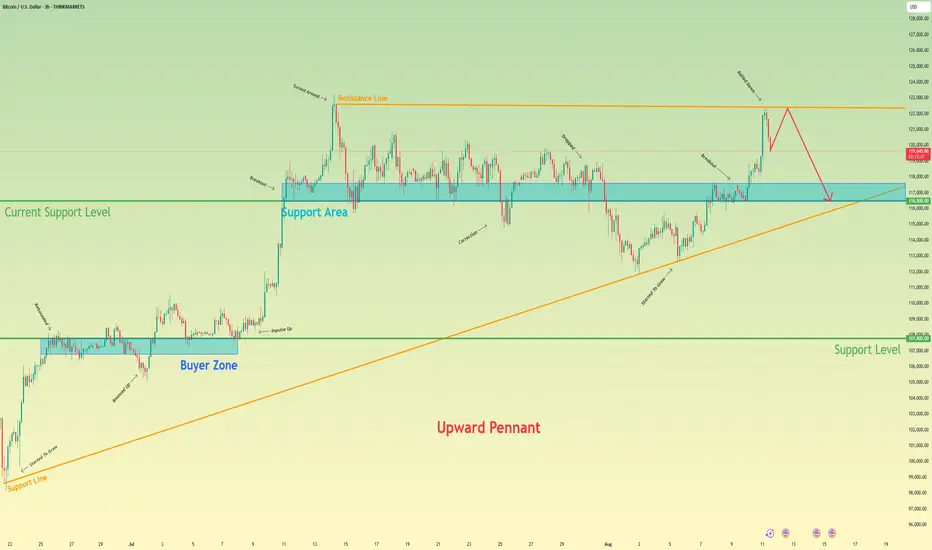
Bitcoin will rebound from resistance line and then continue fallHello traders, I want share with you my opinion about Bitcoin. After looking at the chart, we can see how the price entered an upward pennant and then at once rebounded up from the support line. Then it reached support level, which coincided with the buyer zone, and some time traded near this level, after which it made a small correction. Later it grew higher to 107800 level, breaking it and then made a retest. After this movement, BTC made an impulse up from the support level and rose to the current support level, which coincided with the support area and soon broke it. Later, it BTC rose to the resistance line of the pennant and then made a correction to the support area and started to trades inside. But later it made a fake breakout of the current support level and then tried to back up, but failed and dropped to the support line of support line of upward pennant. Then BTC turned around and started to grow, and soon broke the 116500 level one more time. After this, it reached the resistance line of the pennant, and it turned around and started to decline. In my mind, BTC will grow to the resistance line and then continue to decline 116500 support level. That's why it's my current TP. Please share this idea with your friends and click Boost 🚀
Disclaimer: As part of ThinkMarkets’ Influencer Program, I am sponsored to share and publish their charts in my analysis.
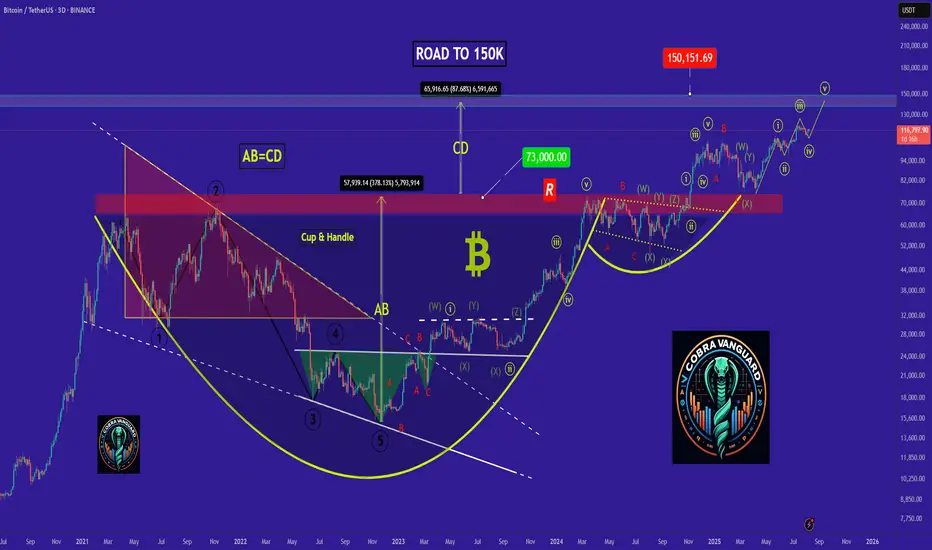
Bitcoin 3D · $137000 Next Target & The Altcoins Market & MercuryBitcoin continues to look awesome. The next target is $137,000 short to mid-term, let's say within 1-2 months. Certainly Bitcoin will continue growing after this target. It comes up and we know when this level is reached there will be a stop. Just as Bitcoin stopped after reaching $123,000. A small pause, a small retrace and then more growth.
We are now in the more growth phase, you are looking at 3D candles. Just today, 11-August 2025, a new 3D session started and as you can see, full green. Bitcoin is now trading at is highest price ever since the all-time high. At resistance, challenging resistance, ultra-bullish.
There are many signals that support a bull market, bullish growth, bullish continuation, bullish impulse, bullish resumption, bullish trend and long-term growth. One of the strongest signals comes from the altcoins.
When Bitcoin consolidates at a high price, it is hard to know if the next move is down or up, the market always goes into a frenzy and half go SHORT the other half go LONG.
You don't have to guess. If the altcoins are rising while Bitcoin is consolidating, this means that the consolidation will lead to additional growth. If the altcoins are dropping while Bitcoin is consolidating, this means that the consolidation phase will end as a breakdown with lower prices.
We see the altcoins growing; we saw the new multiple years high Ether (ETH) did. We know how the smaller altcoins are performing after looking at hundreds of charts. We know the market is not red. We know some are lagging behind or some are way ahead... We know, we know, we know... We know the market is painful when it is bearish; we know the market is quite generous when it is set to grow.
The market does not discriminate between down or up. When it is going down, it will activate all of your stop-loss and beyond. When it is going up, it will fill up all of your sell orders and then go higher... That's how the Cryptocurrency market works.
We are set for the final stage of the bull market, for Bitcoin. For some projects the bull market starts now and will go for years on end. There will be strong variations. Allow for strong variations. I already adapted and this will be a great development because opportunities will be available always. This is the turning point. Mercury stations direct today.
Namaste.

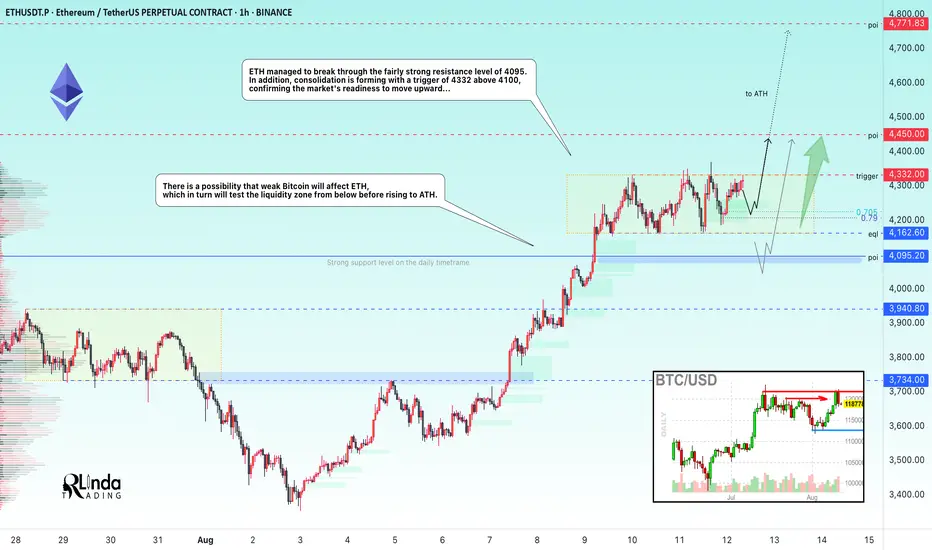
ETHUSDT → A new range has been opened. Onward to ATH!BINANCE:ETHUSDT is breaking through strong resistance formed in the 4090-4100 area on D1-W1. Consolidation is forming after strong growth, which can be seen as a positive sign.
Bitcoin has been looking quite weak recently against ETH, which continues to rally despite Monday's red market. ETH managed to break through the fairly strong resistance level of 4095, and after a strong 25% rally, the price moved into consolidation (trading range 4325-4160, with resistance at 4325 as the trigger). Technically, we see that the market has stopped updating local lows, and a fourth retest of resistance is forming with reduced volatility, which in general could lead to a breakout attempt. Consolidation of the price above the consolidation resistance could trigger further growth. A channel to the ATH is open...
Resistance levels: 4325, 4450, 4800
Support levels: 4220, 4162, 4095
ETH is quite strong and the market may not allow the price to fall too low, as there is a lot of excitement. However, I do not rule out the possibility that weak Bitcoin will affect ETH, which in turn will test the liquidity zone (4162 - 4095) from below before rising to ATH.
Best regards, R. Linda!
118.5K and 120K For Long EntryMorning folks,
Not too much to say now. Most important thing - BTC was able to stay above vital 110-112K support. So the upside reversal that we traded last two weeks with minimal target around 116K was correct. Now BTC stands much higher, but in a moment when we started the trade - it was impossible to say.
Now we're watching two support areas of 120K and 118.5K for potential long entry. Nearest upside target is 127K
Take care.

ETH ROAD TO 20K+I think we are getting closer to the final accumulation stage on ETH.
We can see a potential shape of huge channel in log scale.
After forming median of the channel I would like to see a big and fast correction near 30% from here towards 2900 support which must hold imo.
After that test of smthg around 3600 rgion and double bottom would be the best option just before few months of consolidation before breaking up and starting blow off top part.
Top of that channel depends on timing so the later the better I guess.

$OTHERS / $BTC ALTSEASON REALITY IS INEVITABLE
The reality of the altseason, which was declared dead and denied in all cycles, is literally loading despite everything.

BTC/USD 1D1. Price Structure and Patterns
Medium-Term Trend: Since mid-June, the price has been consolidating between ~$112,000 and ~$121,000, but with a slight upward slope.
Upward Channel: Marked with orange lines – the current candlestick is near the top of this channel.
Triangle Breakout: The white dashed line indicates an upward breakout from the converging triangle (symmetrical) formation, which could signal continued growth.
2. Support and Resistance Levels
Nearest Support:
USD 117,009 (Fib. Level 0.236 and local low)
USD 115,912 (SMA200 – red line)
USD 112,167 (lower consolidation boundary and prior support)
Nearest Resistance:
USD 121,151 (Fib. Level 0.382)
USD 123,966 (Fib. Level 0.5 – key psychological and technical resistance)
USD 126,781 (Fib. Level 0.618 – strong resistance)
USD 130,788 (Fib. Level 0.786 – breakout target)
3. Technical Indicators
MACD: The MACD line is beginning to intersect with the upside signal line – suggesting the beginning of upward momentum.
RSI: 59 – rising, but not yet in the overbought zone (above 70). This means there is room for further growth.
Moving Averages:
The SMA50 (~$114,020) and SMA200 (~$115,912) are below the price – a bullish pattern.
The price has rebounded from the SMA50, which is often a good starting point for further growth.
4. Scenarios
Bullish (more likely at this point)
If the price holds above $118,000 and breaks $121,151, a quick move to $123,966 and then $126,781 is possible.
Confirmation – the daily candle closes above $121,151 on increasing volume.
Bearish
If the price falls below $117,000, a retest of $115,912 is possible, followed by $112,167.
A break of $112,167 could signal a downtrend reversal.
5. Key Observations
Volume is increasing on bullish candles → a sign of accumulation.
The price is near strong resistance at $121,000–$122,000 – a correction is possible here.
Longer term (Fib from the March low), there is potential for a move towards $130,000–$135,000 if the trend continues.

$BTC Market Outlook – Repeating Pattern?CRYPTOCAP:BTC Market Outlook – Repeating Pattern?
Bitcoin appears to be following the same repeating pattern we saw back in May–June 2025. On the Daily timeframe, a clear bull flag is forming, with both MACD and RSI confirming the setup.
In the previous instance, the pattern included two pullbacks before a strong rebound.
Currently, we’ve already seen a bounce off the 50 EMA, which acted as solid support.
You can clearly see the striking similarities, with both the MACD and RSI showing the same bearish divergence.
If history repeats itself, the likely scenario is:
Rejection near the top resistance at $119.5k
Pullback toward the 100 EMA to find support, signaling the end of the correction
The structure is mirroring the earlier move almost perfectly.
Key support levels: $115.6k, $112k, $109k, and in case of a deeper (low probability) pullback: $104k
Key resistance levels (possible rejection zones): $119.6k, $122.2k
If $122.2k is broken, we could be looking at a new ATH.
DYOR 📊

#BTC #BTCUSD #BTCUSDT #BITCOIN #LONG #SWING #Analysis #Eddy#BTC #BTCUSD #BTCUSDT #BITCOIN #LONG #SWING #Analysis #Eddy
BTCUSDT.P Swing Long Analysis With Entry Point
This is my first possible scenario and analysis of Bitcoin's future trend.
This Analysis is based on a combination of different styles, including the volume,ict & Price Action Classic. (( Head & Shoulder Pattern ))
Based on your strategy and style, get the necessary confirmations for this Swing long to enter the trade.
Don't forget risk and capital management.
Entry point already touched : 🟢 79285.50
The responsibility for the transaction is yours and I have no responsibility for not observing your risk and capital management.
🗒 Note: The price can go much higher than the first target, and there is a possibility of a 500% pump on this currency. By observing risk and capital management, obtaining the necessary approvals, and saving profits in the targets, you can keep it for the pump.
Spot Investing : ((long 'buy' position)) :
🟢 Entry 1 : 79285.50
🟢 Entry 2 : 61845.77 (( This Entry is for secound scenario ))
First entry point calculations :
⚪️ SL : Behind the last shadow created.
⚫️ TP1 : 250000 ((215.32%))
⚫️ TP2 : 500000 ((530.63%))
⚫️ TP3 : 999000 ((1160.00%))
‼️ Futures Trading Suggested Leverages : 3-5-7
The World Let it be Remembered...
Dr. #Eddy Sunshine
4/4/2025
Be successful and profitable.
Do you remember my first Bitcoin swing long signal entry & targets?
My first swing long signal was provided on BTC, which was spot pumped by more than 150% and was profitable :
