Volatility Period: July 24-26
Hello, traders.
If you "Follow", you can always get the latest information quickly.
Have a nice day today.
-------------------------------------
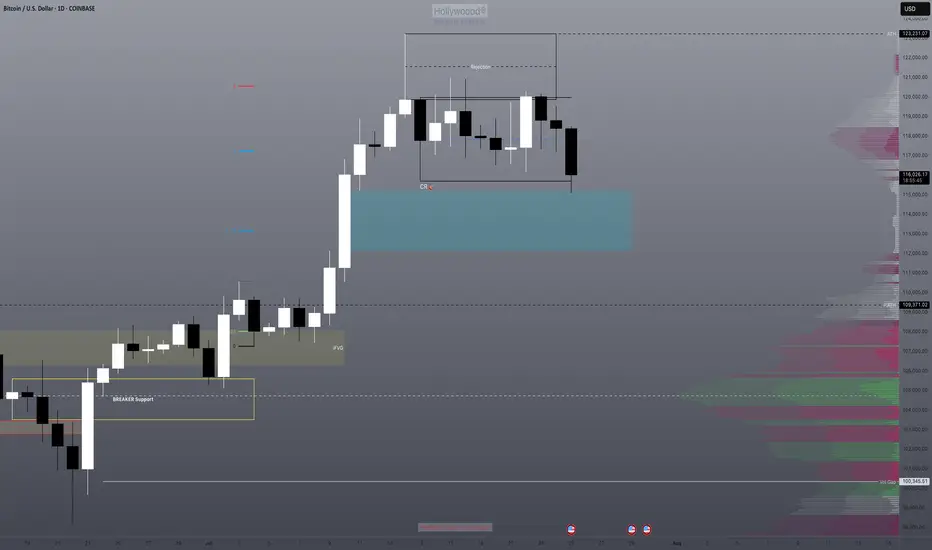
(BTCUSDT 1D chart)
BTC is in a step up trend.
Looking at the bigger picture, it can be seen that it is in the second step up trend.
The important volatility period in this step-up is expected to be around August 2-5 (up to August 1-6).
Therefore, we need to look at what kind of movement it makes as it passes through the previous volatility period of around July 25 (July 24-26) and around July 31 (July 30-August 1).
In other words, we need to check which section is supported and which section is resisted, and see if it breaks through that section.
What we can see now is that it is checking whether there is support in the 115854.56-119086.64 section, that is, the HA-High ~ DOM (60) section.
Since the M-Signal indicator on the 1D chart has risen to the 115854.56 point, the key is whether it can receive support at the 115854.56 point and rise.
If it falls below the M-Signal indicator of the 1D chart and shows resistance, it is likely to meet the M-Signal indicator of the 1W chart.
This flow is an interpretation of the separation learned when studying the price moving average.
Therefore, we can see that the maximum decline point is when it meets the M-Signal indicator of the 1M chart.
-
Industries (coins, tokens) that are renewing the ATH are actually outside the predictable range.
Therefore, we should think of it as a situation where it is not strange whether it falls or rises at any time and think of a response plan.
Since it is currently within the predictable range, we can create a response strategy by checking whether there is support in the 115854.56-119086.64 section.
However, as I mentioned earlier, the volatility period is about to begin, so caution is required when making new transactions.
That is, you need to check whether it breaks out of the 115854.56-119086.64 range during the volatility period that continues until July 26.
And if it breaks out, you need to check whether it is supported or resisted in that area and respond accordingly.
-
The OBV indicator of the Low Line ~ High Line channel is showing a pattern of rising above the High Line.
Accordingly, if the OBV indicator is maintained above the High Line, it is expected to show an additional rise.
In accordance with this, you need to check whether the K of the StochRSI indicator shows a movement to rise in the oversold range and a transition to a state where K > D.
You also need to check whether the TC (Trend Check) indicator continues its upward trend and can rise above the 0 point.
If these conditions are met, it is expected that BTC will rise above 119086.64 or show a pattern of rising.
-
This decline created a low trend line, creating a perfect rising channel.
Therefore, we need to see how far we can go up along the rising channel created this time.
In that sense, we should pay close attention to the movement during the volatility period around July 25th (July 24-26).
-
Thank you for reading to the end.
I hope you have a successful trade.
--------------------------------------------------
- This is an explanation of the big picture.
(3-year bull market, 1-year bear market pattern)
I will explain more details when the bear market starts.
------------------------------------------------------
Btc-e

BTC - Trap, Tap, and Blast Off!BTC has been overall bullish, trading within the rising blue channel (1). After reaching a local high, it entered a short-term correction, forming a falling red channel (2).
👀All eyes are now on the key demand zone (3), which aligns with the lower bound of both the red channel and the rising blue structure.
🔎As long as this confluence holds, we anticipate a potential bullish impulse in August.
A retest of the $111,500–$112,000 zone could serve as the trigger for the next leg toward $128,000. Let’s see if BTC is gearing up for another breakout or if a deeper correction is in play.
🔔 Disclaimer: This analysis is for educational and informational purposes only. It does not constitute financial advice or a recommendation to buy or sell any asset. Always do your own research and manage your risk accordingly.
📚 Always follow your trading plan => including entry, risk management, and trade execution.
Good luck!
All strategies are good, if managed properly.
~ Richard Nasr

It's an Evacuation Through Green Candles💥 "One Last Leap of Faith?" - What Bitcoin Might Be Hiding Before September
The world’s on fire: Israel, Iran, Strait of Hormuz, oil, elections, the dollar, rates, black swan whispers.
And someone’s out here saying Bitcoin might still go up?
Yes. We are. Not because we believe - but because we see.
📉 Everyone’s afraid. The whales aren’t.
When the crowd goes into survival mode, the real game begins.
Whales aren’t exiting - they’re accumulating.
ETFs aren’t pausing - they’re inflowing.
The technical setup isn’t breaking - it’s compressing like a spring.
$104,000. Coil building.
If we break out - targets at $132K–$140K are absolutely in play.
👉 But that’s not the point.
The point is why this is happening while the world is burning.
🧠 The idea: Bitcoin isn’t a safe haven. It’s a distribution machine.
Gold is for panic.
Bitcoin is for structure.
Institutions don’t ask “is it scary?” - they ask “where’s liquidity?”
Everything is aligning for one last upside move.
Until September. After that - chaos is back on the table.
💣 The Global Playbook:
Now (Summer) - Consolidation, ETF flows, geopolitical fear - Strategic entries, low exposure
Breakout - FOMO panic, retail rushes in - Profit-taking via options
September–Fall - Macro/geopolitical shock - Already in cash or hedged
📌 Bottom Line
Yes, Bitcoin might pump. Not because the world is fine - but because someone needs to exit beautifully.
If you're reading this - you're early enough to think.
Markets don’t reward justice. They reward positioning.
🛠 What to do right now:
Watch the $104,000 level - it's the pivot
Breakout = final upside push to $132K–140K
Keep your eyes on September - reversal zone
Think in scenarios: entry, exit, protection
Follow EXCAVO - we don’t guess, we read the game
I've been talking about this scenario for a long time

Bitcoin is testing the triangle ┆ HolderStatBINANCE:BTCUSDT is ranging $132K–$137K in a triangle pattern. Breakout above $137K may target $143K. Decision point near.

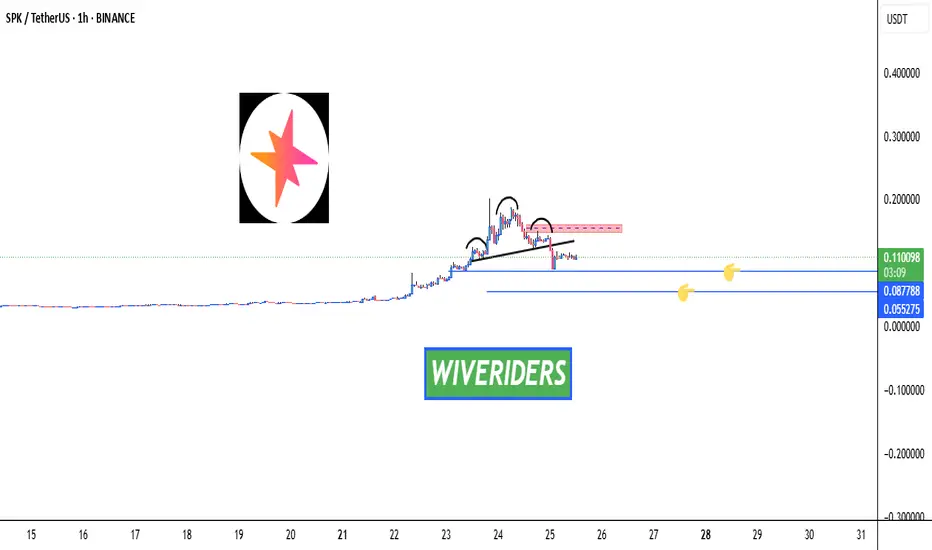
SPK Market Update – Key Levels Ahead 🚨 SPK Market Update – Key Levels Ahead 🔄📉📈
SPK previously formed a bearish Head and Shoulders pattern, which was confirmed by a breakdown. So, what’s next?
🔹 Option 1:
Price could move down to the two blue support levels — these zones may offer potential long entries, as buyers were active here before. Watch for confirmation! 👀
🔺 Option 2:
We also have a red resistance zone, located around the right shoulder of the H&S.
If INDEX:SPK breaks above this zone, it may signal the return of buyers and a potential bullish reversal.
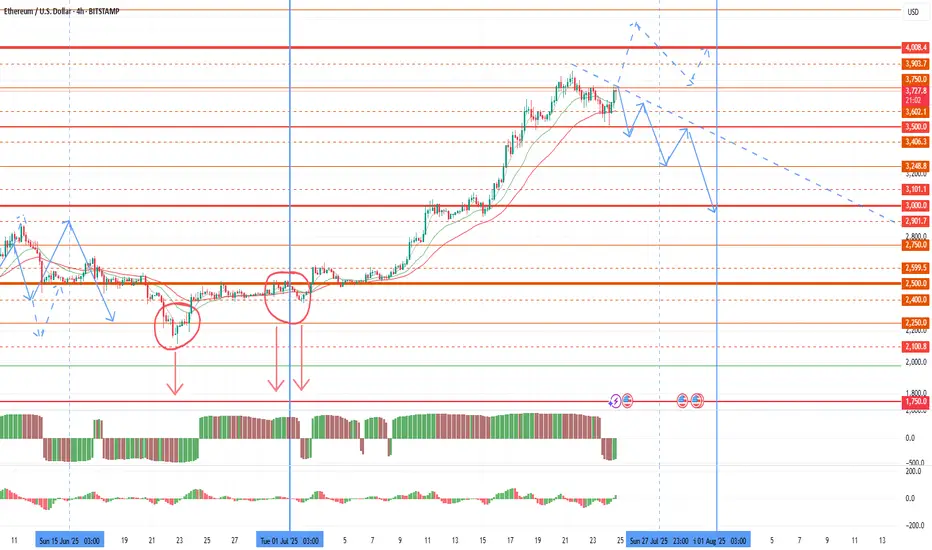
Possible market drawdown before the end of the monthToday I want to review the market and give a warning on further purchases. Since the last review, as expected, volatility in the market began to grow with a flat of about 2500 on ether until the half-year change. The growth of the euro and oil gave rise to a 4k retest in the new half of the year. However, the half-year has opened below 2,500, which is a technical selling signal that bears will use at the end of each major period. A large volume of sales was also left before the half-year change, which can be retested up to 2100-2250. The first pullback is already possible for the current monthly candle, with its pinbar reversal up to 2750-2900 on ether. This pullback started yesterday and is likely to accelerate in the last weekly candle of the month. Further sales are highly likely to continue in the first half of the new month as part of the shadow drawing for the new monthly candle. In an optimistic scenario, the bulls will be able to take 4,000 by the end of the week, in which case the pullback on the current monthly candle will be compensated.
Given the increased likelihood of sales in the market, I recommend fixing profits by the end of the week and reducing the number of coins in operation. The current rollback for some coins will also end with the assignment of the monitoring tag at the beginning of the month and a further collapse, which puts pressure on the coins.
Most of the coins that I considered for work provided good opportunities for making money, especially the growth impulses of pivx and data with sharp breakouts stood out. Adx fio chess cos token also showed growth, but at a smoother pace. The most negative dynamics was given by slf, which eventually received the monitoring tag, and I will not consider it in the future.
Despite the pleasant impulses of 50%+ for individual fantokens, this group as a whole shows extremely negative dynamics relative to the market, and remains in the most oversold position, even relative to coins with the monitoring tag. In an optimistic scenario, fantokens will become interesting to speculators against the background of the general decline of altcoins that has begun, and we can expect a good bull run on them before the end of the month. In a negative scenario, binance may be preparing to assign the monitoring tag to some tokens of this group or chz. In this regard, I leave such tokens as atm acm city porto Lazio as the most undervalued in a small lot. But at the beginning of the month, I also recommend keeping short stops on them in the first half of the day of the first week of the new month to insure against assigning the monitoring tag. Or temporarily sell them for a given period.
In addition to fan tokens, I will choose new coins for operation after assigning the monitoring tag in the new month.
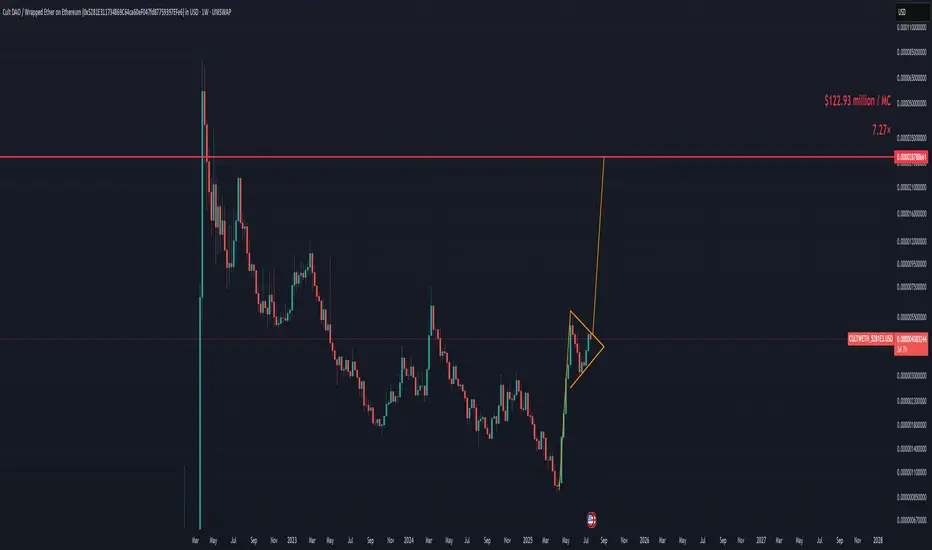
Brace for Impact: CULT DAO’s Bull Flag Points to Violent Upside!If you missed the last 500% wave from CULT DAO, fear not you’re just in time if you’re reading this.
My bottom call was slightly off, but since the lows, it's up 500% and it's just getting warmed up.
We are now forming a giant bull flag that will take CULT DAO straight to $122 million a 7.27x from this price.
I will be publishing CULT DAO TA’s until we hit a one billion dollar market cap, which we should reach sometime in Q4 2025.
Seeing a giant bull flag forming as we enter the final phase of the bull market is beautiful.
Prepare accordingly. Time is limited. We will blast off in under 30 days.
Will the low of this BTC zone be used as a buy point?We have an imbalance high being tested. We know that this also represents the consolidation range low where both TPs and long entries will be triggered.
Will this be enough to send us back bullish or will be need further correction of the imbalance? I think there's a high probability of this with DXY also running into it's daily bearish imbalance range.
BTC 4H – Dance with the 200MA
Bitcoin continues its strong relationship with the 200MA.
Each time price dips below it, fear spikes — but bounces off key Fib levels have followed, with price then riding higher alongside the 200MA.
Right now, price is caught between the 200MA and a nearby Fib level.
Here’s what could happen next:
– Price flips the Fib into support, ideally with help from a rising 200MA.
– Price waits for the 200MA to catch up, and they break the Fib together.
– Or, we get another panic dip, and the bounce comes after another test from below.
Whichever path it takes, we’ll be here watching it unfold.
Always take profits and manage risk.
Interaction is welcome.

BITCOIN BULLISH WEDGE|LONG|
✅BITCOIN is trading in a
Strong uptrend and the coin
Has formed a massive bullish
Wedge pattern so we are
Bullish biased and IF we see
A bullish breakout we will
Be expecting a further
Bullish move up
LONG🚀
✅Like and subscribe to never miss a new idea!✅
Disclosure: I am part of Trade Nation's Influencer program and receive a monthly fee for using their TradingView charts in my analysis.

DOGE Swing Trade – Key Support in PlayDOGE is currently holding a major support zone, offering a strong risk-reward opportunity for a long swing position. With bullish sentiment and meme coin narratives returning, this level is worth watching for upside continuation.
📌 Trade Setup:
• Entry Zone: $0.23 – $0.24
• Take Profit Targets:
o 🥇 $0.27 – $0.28
o 🥈 $0.37 – $0.44
• Stop Loss: Just below $0.215

What’s Next? 🚨 $FARTCOIN Cup & Handle Pattern Forming – What’s Next? 📈
$FARTCOIN has formed a bullish Cup & Handle pattern — but is it over?
❌ Not yet. $FARTCOIN hasn’t shown any strong bearish signals for now.
🔍 We’re watching two key green line levels below.
📉 If the price drops toward these zones, we may see buyers step back in — creating a potential entry, but only with confirmation.
✅ Stay patient — no rush to jump in without a setup. Let the chart guide us.

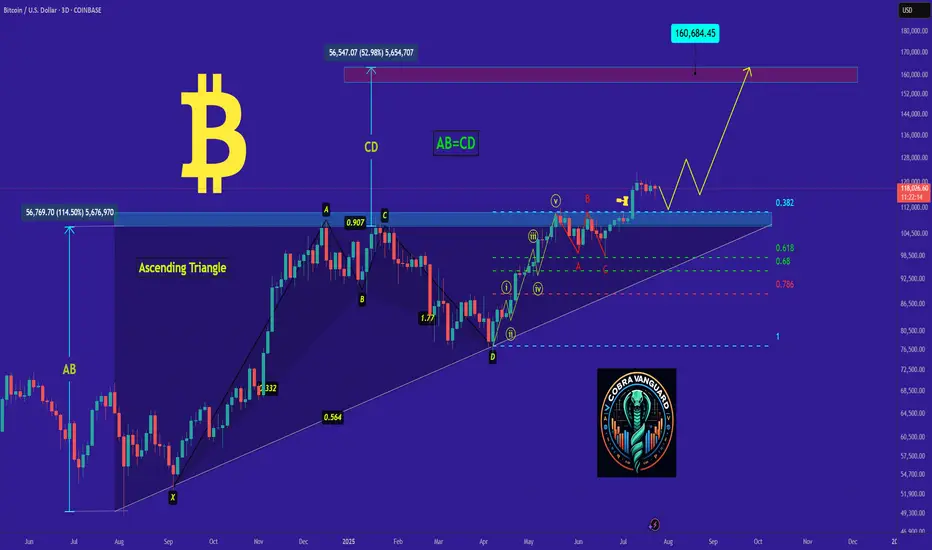
BITCOIN's Situation (12h) !!!So if you pay attention to the TON chart you can see that the price has formed a Ascending wedge which means it is expected to price move as equal as the measured price movement.( AB=CD )
NOTE: wait for break of the WEDGE .
Best regards CobraVanguard.💚

bitcoin- Time to buy again! (Update)As I said, Bitcoin broke the triangle, and now with a slight price correction, it could surge to $160,000, and you still think I'm joking!!
Previous analysis
TradeCityPro | Bitcoin Daily Analysis #137👋 Welcome to TradeCity Pro!
Let’s go over the Bitcoin analysis. I’m making a change to how I analyze Bitcoin — I will no longer include indicators like dominance charts.
🔍 From now on, I’ll be analyzing Bitcoin in daily, 4-hour, and 1-hour timeframes only.
📅 Daily Timeframe
On the daily timeframe, Bitcoin is in a strong uptrend that started from the 78,397 level and in two bullish legs has reached the 122,733 zone.
✅ This level, along with the 0.618 Fibonacci Extension, has created a strong resistance zone. Although price has attempted multiple times to break into or above this area, it has not yet succeeded in closing a candle above or inside the range.
🎲 We also have a curved trendline from higher timeframes, which the price is reacting to even on the daily chart. Currently, the price is near this trendline. There is a possibility that price consolidates over time until it reaches this trendline and then begins its next bullish leg.
📊 If that happens, breaking 122,733 or 120,140 would be triggers for opening a long position on the daily timeframe.
I do not recommend buying Bitcoin on spot right now, because I believe we’re close to the top of this bullish cycle, and this current leg might be the last one.
⭐ A breakout of 76.50 on the RSI would be a strong confirmation of bullish momentum, and would mark the continuation of the uptrend.
🔑 If we get a pullback, the price could correct to dynamic zones like SMA25 or SMA99. Important static support levels are at 110,183 and 100,763.
⏳ 4-Hour Timeframe
In the 4-hour chart, we can see more details of the bullish leg. After the sharp move to 122,733, a correction phase began, forming a range box.
💥 The bottom of the box is around 116,829, which I’ve marked as a zone. It also overlaps with the 0.382 Fibonacci, making it a very important PRZ (Potential Reversal Zone).
The top of the range is at 120,041.
🧩 Yesterday, price made a fakeout to the downside. As you can see, it dumped hard with heavy selling volume and hit the 0.5 Fibonacci level, but couldn’t hold there and quickly bounced back above 116,829.
🧲 Today, I think it's better not to go below the 4-hour timeframe and avoid getting caught up in small market noise.
A break above 120,041 can trigger a long entry.
Another breakdown from the box might trigger a deeper correction.
❌ Disclaimer ❌
Trading futures is highly risky and dangerous. If you're not an expert, these triggers may not be suitable for you. You should first learn risk and capital management. You can also use the educational content from this channel.
Finally, these triggers reflect my personal opinions on price action, and the market may move completely against this analysis. So, do your own research before opening any position.

BTC – Bulls still in controlBTC is trading around 117,800 USD, well above both the EMA 50 (111,800) and the pivot level (105,300), confirming bullish dominance. Price remains below the upper Bollinger Band (123,400), leaving potential room for continuation.
Momentum stays constructive, with RSI at 60 and MACD in a strong positive zone, reflecting sustained upward pressure. As long as price holds above EMA 50 and pivot, the next upside targets lie at 123,400 and R1 at 110,000 has already been surpassed.
Volume has dropped significantly (-31%), suggesting the latest move could lack conviction or represent a pause rather than a breakout.
As long as BTC holds above 111,800, the bullish scenario remains intact.
Watch for any rejection near 123,400 or a close back below the EMA as potential invalidation signals.

BITCOIN → Correction within a downward channel. 112K or 125K?BINANCE:BTCUSDT is consolidating. However, a local downward trading range is forming relative to the current setup. What is the probability of a correction continuing to 112K or growth to 125K?
Daily structure: a local correctional channel within a global bullish trend. We have cascading resistance at 119.2, 119.6, 120, and 120.8. It will be quite difficult to break through this zone on the first attempt, but MM can use it to form traps and collect liquidity.
At the bottom, everything is simpler — a breakdown of the local bullish structure, the formation of an intermediate minimum, below which there is a void down to 112K.
Yesterday, relative to 115-116K, mm staged a massacre (trap) on both sides of the market.
Liquidity collection, return to the range, and growth. The reaction to the false breakdown of support is quite strong. Since the opening of the session, Bitcoin has been heading towards resistance, but there may not be enough potential to break through the upper resistance conglomerate, so I expect to see a pullback or decline to 116-115-114.
Resistance levels: 119.2, 120.1, 120.85
Support levels: 116.37, 115.67, 112
Technically and fundamentally, I do not see any drivers that could support the market (I am talking about Bitcoin, since the driver for altcoins is the decline in Bitcoin's dominance). It is possible that this may appear later. In the current situation, I am considering a false breakout and correction, as the market has not yet finished consolidating or correcting, and the current downward trading range may be extended.
PS: As the price moves towards resistance, it is necessary to monitor the reaction. The market itself will show what it is preparing for...
Best regards, R. Linda!

BTCUSDT ready to march towards 140k zoneHere is once again a view of what I had shared when BTCUSDT was trading around 95k in may 2025.
The price action has been similar to our expectation. A push towards 106k-110k and then drop around 95k-98k before boucing towards 137k.
So the next stop for the current upward move is 137k. The push from 98k has brought us into 120k zone and currently we were holding in that range from 114k-120k for a while.
However, this is going to change now. I believe the last drop towards 114k was a false breakdown from 4h support 4HS1 since the price quickly grabbed this region again by moving towards 117k.
I believe the path to 137k-144k is clear now and we see that in coming weeks. After that we shall likely see a correction towards 120k area before move to the target around 150k.
Lets see how the price moves. We will keep monitoring it time to time and I will provide updates. But till now it has been moving according to the plan.
#BTC #BTCUSD #BTCUSDT #BITCOIN #CRYPTO CRYPTOCAP:BTC $crypto

BTC setup looks good for 5R.Looks like BTC is about to make another leg up toward 135K. Playing a 5:1 R:R on this setup
Entry: 119,000
Stop Loss: 116,000
Target: 135,000

Trade with crux Atlantic... 🔔🔔Trading the financial market is easy when you've the right tools and strategy.💯💯
🔔🔔Let the chart pay your bills.💰💰

XYZ momentum is buildingXYZ positive weekly volume this week is a first in its history! Even though it has never had this much 'green' volume in its weekly history, there is plenty of resistance to be overcome for this stock
$81-85 will be challenging as sellers all the way from 2022 will begin dumping shares, especially when uncertain market conditions will be pushing them to sell. If it consolidates at 85, plan for a move to 98, where there will be another wave of sellers from Dec 2024 and 2022.
XYZ moves will parallel the BTC market with a lag. When BTC breathes, XYZ will breathe. With a BTC bull, expect XYZ to run.
Rating is neutral as this needs to break through resistance prior to accumulation, not the other way around.

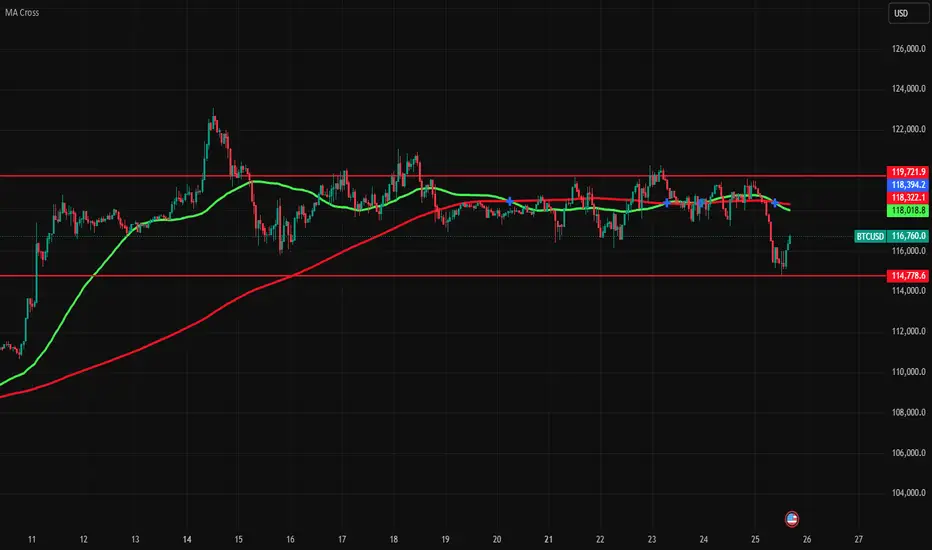
BTC zoneThis is BTC zone where it is moving since few days. It is below golden cross on hourly chart. It could be cross this zone after crossing golden cross.
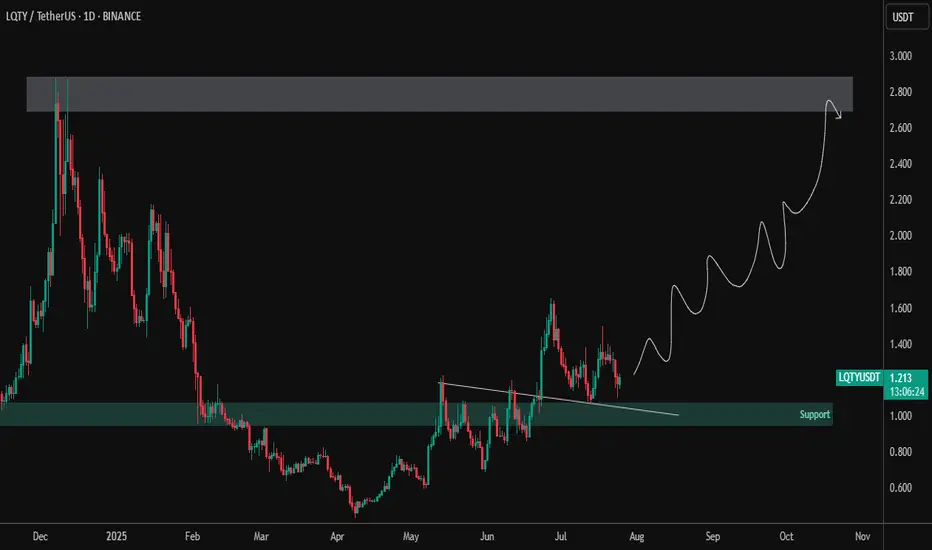
LQTY – Accumulation Completed | Preparing for Trend ReversalLQTY has broken out from a descending structure and reclaimed the key support zone around $1.00–$1.10, showing early signs of accumulation and bullish strength. Currently forming a higher low structure, suggesting a potential long-term uptrend is brewing.
🔹 Technical Highlights:
✅ Clean breakout from descending trendline
✅ Retest of breakout zone holding as support (~$1.10)
🔼 Price printing bullish higher lows on the daily timeframe
🎯 Target zone: $2.70–$2.90 (major resistance from previous highs)
📌 Technical View:
Strong structural base forming
Pullbacks into support area could offer high R/R entries
Break above $1.50 may ignite bullish continuation toward the upper target zone
LQTY appears to be transitioning from accumulation to markup phase. Monitor price action and volume for confirmation of the next leg.