Analyzing the new month, new week, new day
Hello, traders.
If you "follow", you can always get the latest information quickly.
Have a nice day today.
-------------------------------------
(BTCUSDT 1M chart)
A new month begins in one day.
The key is whether it can hold the price by rising above 109588.0.
If not, there is a possibility that it will fall below the 94172.00 StochRSI 50 indicator point that the arrow is pointing to.
We need to see if it can rise with support near the Fibonacci ratio of 1.618 (89050.0).
Since the current low-point trend line is not complete, it is not surprising that it can show a downward trend at any time.
However, if it rises above 109588.0 and maintains the price, it is expected that there will be an attempt to rise near the Fibonacci ratio of 2.618 (133889.92).
I think it is likely to be the last target of the target bull market in 2025.
-
(1W chart)
It is a period of volatility around the week including June 23.
That is, from June 16 to July 6 is the volatility period.
The key is whether it can rise to the right Fibonacci ratio 2.24 (116940.43) during this volatility period.
Even if it fails to rise, if the price maintains above 104463.99, it is expected to show an upward trend around the next volatility period.
The next volatility period on the 1W chart is expected to be around the week of August 18.
-
When it falls below 104463.99, we need to check whether the HA-High indicator is newly generated.
If not, it is important to check whether there is support around the current HA-High indicator point of 99705.62.
Since the M-Signal indicator on the 1W chart is passing around 99705.62, its importance can be said to be high.
If it falls below the M-Signal indicator of the 1W chart, it is expected to determine the trend again when it meets the M-Signal indicator of the 1M chart.
-
(1D chart)
The key is whether it can maintain the price by rising above the HA-High indicator point of 108316.90 on the 1D chart.
If it fails to rise,
1st: 104463.99
2nd: 99705.62
You should check for support near the 1st and 2nd above.
If it falls below the M-Signal indicator of the 1W chart,
1st: 89294.25
2nd: M-Signal of the 1M chart
There is a possibility that it will fall near the 1st and 2nd above.
-----------------------------------------
(1W chart)
The chart above is a trend line chart drawn on the 1W chart.
It looks complicated, but what's important to look at is the correlation between the high-point trend line and the low-point trend line.
That is, even if the price rises above 109.588.0, if it doesn't rise above the high-point trend line, it is likely to fall near the low-point trend line.
Fortunately, since it is forming an upward channel, it is expected that the price will eventually rise even if it falls.
-
(1D chart)
Unlike the trend line on the 1W chart, the high-point trend line on the 1D chart forms a downward trend line.
Accordingly, the period around July 7, when the low-point trend line and the high-point trend line intersect, can be considered an important period of volatility.
However, the volatility period starts around July 2nd and is expected to end around July 10th.
----------------------------------------------
As shown above, many lines were drawn to analyze the chart.
I have roughly explained which of the lines drawn in this way should be prioritized.
Since chart analysis is for creating a trading strategy, the support and resistance points drawn on the 1M, 1W, and 1D charts are ultimately the most important.
Therefore, it is most important to check how the support and resistance points were created and find the reason for them.
Other analyses are only additional elements.
As I always say, chart analysis that does not show support and resistance points is only an analysis chart that can be used for trading.
You cannot trade with such analysis charts.
Also, if support and resistance points are shown, you should check the basis for setting the support and resistance points.
In order to serve as a support and resistance point, there must be a basis.
When you cannot confirm the basis for the support and resistance point, it is important to ask questions and find out the basis.
Fibonacci ratios are not suitable for actual trading.
However, when the ATH or ATL is updated, it is valuable enough for analysis.
Other than that, there must be support and resistance points drawn on the 1M, 1W, and 1D charts.
-
Thank you for reading to the end.
I hope you have a successful trade.
--------------------------------------------------
- This is an explanation of the big picture.
(3-year bull market, 1-year bear market pattern)
I will explain more details when the bear market starts.
------------------------------------------------------
Btc-e

Bitcoin: Bearish Signal Watch 107,400 To Confirm.Bitcoin bearish pin bar developing, which is a bearish sign at least for the short term. IF this candle closes and low is compromised, (107,400?) A sell signal will be in effect (see arrow). This will also confirm a failed break out (see trend line) of a multi month consolidation. The signal in question is an ideal setup for swing traders or day traders looking for aggressive shorts, while the broader trend is completely intact. A reasonable price objective for such a move is the 103K area which is basically the mid point of the consolidation and near the 102 to 100K support. While the market can potentially break lower than that, there is NO way to forecast such an event. Market confirms first, then expectations can be adjusted effectively.
The wave count has been adjusted on this chart. The current consolidation is likely the sub wave 4 of the broader 5 which means implies the trend is still bullish since the sub wave 5 of 5 is not in play yet. Maybe after this next retrace? The next bullish setup (around 103K?) may present a high probability swing trade opportunity on the long side possible over the next week or two.
Keep in mind, it is not a good idea to get married to any opinions. I don't care how bullish the fundamentals are, all it takes is an unexpected catalyst and this market retraces hard. A week ago we were flirting with 98K, today 108K. Levels and price action are a much more accurate gauge of where the market is likely to go on the short term, and more importantly offer greater insight into the potential reward and RISK.
I adjust my outlook constantly because I know that the MARKET is ALWAYS right. It offers guidance if you know how to listen and be flexible. "Outlook" can be categorized by time which helps to keep expectations inline with market intent. For example, reward and risk expectations for a swing trade (4H time frame) will be smaller compared to a position entered for investment (weekly time frame). Keeping these expectations separate will help you control risk in a much more optimal way compared to having a swing trade turn into an investment.
Thank you for considering my analysis and perspective.

BTC - Is it time to 105 - 102k?Just wait and watch, as said it went what i said, Will explain more, but it would take more longs with it and eventually bonk it down, wreckage intensity would be said soon

Example of how to draw a trend line using the StochRSI indicator
Hello, traders.
If you "Follow", you can always get new information quickly.
Have a nice day today.
-------------------------------------
We use the StochRSI indicator to draw a trend line.
We draw a trend line by connecting the peaks of the StochRSI indicator, i.e. the K line, when they are created in the overbought area or when they are created in the overbought area.
That is, when the K line of the StochRSI indicator forms a peak in the overbought area, the trend line is drawn by connecting the Open values of the falling candles.
If the candle corresponding to the peak of the StochRSI indicator is a rising candle, move to the right and use the Open value of the first falling candle.
When drawing the first trend line, draw it from the latest candle.
Since the third trend line indicates a new trend, do not draw anything after the third trend line.
The currently drawn trend line corresponds to the high-point trend line.
-
Therefore, you should also draw the low-point trend line.
The low-point trend line is drawn by connecting the K line of the StochRSI indicator when the top is formed in the oversold zone.
The low-point trend line uses the low value of the candle when the K line of the StochRSI indicator forms the top in the oversold zone.
That is, it doesn't matter whether the candle is a bearish candle or a bullish candle.
The drawing method is the same as when drawing the high-point trend line, drawing from the latest candle.
The top of the best K line of the StochRSI indicator was not formed within the oversold zone.
(The top is indicated by the section marked with a circle.)
Since the trend line was not formed, the principle is not to draw it.
If you want to draw it and see it, it is better to display it differently from the existing trend line so that it is intuitively different from the existing trend line.
-
The chart below is a chart that displays the trend line drawn separately above as a whole.
It is also good to distinguish which trend line it is by changing the color of the high-point trend line and the low-point trend line.
The chart below is a chart that distinguishes the high-point trend line in blue (#5b9cf6) and the low-point trend line in light green (#00ff00).
The low-point trend line is a line drawn when the trend has changed, so it does not have much meaning, but it still provides good information for calculating the volatility period.
-
To calculate the volatility period, support and resistance points drawn on the 1M, 1W, and 1D charts are required.
However, since I am currently explaining how to draw a trend line, it is only drawn on the 1M chart.
-
I use the indicators used in my chart to indicate support and resistance points.
That is, I use the DOM(60), DOM(-60), HA-Low, HA-High, and OBV indicators to indicate support and resistance points.
Since the DOM(-60) and HA-Low indicators are not displayed on the 1M chart, I have shown the 1W chart as an example.
The indicators displayed up to the current candle correspond to the main support and resistance points.
Although it is not displayed up to the current candle, the point where the horizontal line is long is drawn as the sub-support and resistance point.
It is recommended to mark them separately to distinguish the main support and resistance point and the sub-support and resistance point.
The trend line drawn in this way and the support and resistance points are correlated on the 1D chart and the volatility period is calculated.
(For example, it was drawn on the 1M chart.)
The sections marked as circles are the points that serve as the basis for calculating the volatility period.
That is,
- The point where multiple trend lines intersect
- The point where the trend line and the support and resistance points intersect
Select the point that satisfies the above cases at the same time to display the volatility period.
When the point of calculating the volatility period is ambiguous, move to the left and select the first candle.
This is because it is meaningless to display it after the volatility period has passed.
If possible, the more points that are satisfied at the same time, the stronger the volatility period.
If the K-line peak of the StochRSI indicator is formed outside the overbought or oversold zone, it is better to exclude it when calculating the volatility period.
-
The chart below is a chart drawn on a 1D chart by summarizing the above contents.
The reason why there are so many lines is because of this reason.
For those who are not familiar with my charts, I have been simplifying the charts as much as possible these days.
However, when explaining, I have shown all the indicators to help you understand the explanation.
-
Thank you for reading to the end.
I hope you have a successful trade.
--------------------------------------------------

Bitcoin Approaches PRZ – Will the Falling Wedge Break ?Bitcoin ( BINANCE:BTCUSDT ) failed to break through the Support zone($106,800-$105,820) after attacking it five times , and started to rise again.
Bitcoin is currently moving near the Resistance zone($109,220-$108,280) , Cumulative Short Liquidation Leverage($108,800-$108,085) , Potential Reversal Zone(PRZ) , and Resistance lines .
From a Classical Technical Analysis perspective , Bitcoin's movements over the past two days seem to have formed a Falling Wedge Pattern .
From an Elliott Wave theory perspective , Bitcoin appears to have completed the main wave 4 within the Falling Wedge Pattern. The structure of the main wave 4 was a Double Three Correction(WXY) .
I expect Bitcoin to attack the Resistance lines after breaking the upper line of the Falling Wedge Pattern . If Bitcoin fails to break the Resistance lines before the global markets close , we can expect Bitcoin to fall again. Because entering Saturday and Sunday , the trading volume is generally low , and I think Bitcoin needs a lot of volume to break the resistances .
Do you agree with me?
CME Gap: $106,645-$106,295
Cumulative Long Liquidation Leverage: $106,055-$105,430
Note: If Bitcoin manages to break the Support zone($106,800-$105,820), we should expect further declines.
Please respect each other's ideas and express them politely if you agree or disagree.
Bitcoin Analyze (BTCUSDT), 1-hour time frame.
Be sure to follow the updated ideas.
Do not forget to put a Stop loss for your positions (For every position you want to open).
Please follow your strategy and updates; this is just my Idea, and I will gladly see your ideas in this post.
Please do not forget the ✅' like '✅ button 🙏😊 & Share it with your friends; thanks, and Trade safe.

Do you think I'm joking ???Chart is speaking itself...AB=CD.
previous analysis
Give me some energy !!
✨We spend hours finding potential opportunities and writing useful ideas, we would be happy if you support us.
Best regards CobraVanguard.💚

This is a deception or maybe a technique !!!I think this head and shoulders pattern is trying to deceive us and is fake. I expect the price to drop to the support line and then rise to $109k. WAIT FOR IT....
Give me some energy !!
The Crypto Market Game: How to Win Against Fear and Manipulation
Did you really think profiting from the current bull run (a comprehensive upward market) would be easy? Don't be naive. Do you think they’ll let you buy low, hold, and sell high without any struggle? If it were that simple, everyone would be rich. But the truth is: 90% of you will lose. Why? Because the crypto market is not designed for everyone to win.
They will shake you. They will make you doubt everything. They will create panic, causing you to sell at the worst possible moment. Do you know what happens next? The best players in this game buy when there’s fear, not sell—because your panic gives them cheap assets.
This is how the game works: strong hands feed off weak hands. They exaggerate every dip, every correction, every sell-off. They make it look like the end of the world so you abandon everything. And when the market rises again, you’re left sitting there asking, “What just happened?”
This is not an accident. It’s a system. The market rewards patience and punishes weak emotions. The big players already know your thoughts. They know exactly when and how to stir fear, forcing you to give up. When you panic, they profit. They don’t just play the market—they play you. That’s why most people never succeed: they fall into the same traps over and over again.
People don’t realize that dips, FUD (fear, uncertainty, doubt), and panic are all part of the plan. But the winners? They block out the noise. They know that fear is temporary, but smart decisions last forever.
We’ve seen this play out hundreds of times. They pump the market after you sell. They take your assets, hold them, and sell them back to you at the top—leaving you with nothing, wondering how it happened.
Don’t play their game. Play your own.

BTC Is Replaying a Bullish Fractal >>> Are You Watching?Hello guys!
I see a deja vu here! Let’s look at the historical daily chart (Jan–May 2025):
What happened?
Initial Drop (Yellow Oval): Bitcoin approached a key S&D zone but didn't touch it, triggering a short-lived bounce before dropping again.
Second Drop (Red Ovals): This time, price precisely touched the demand zone, triggering a clean bullish reversal.
What followed was a strong trend breakout, sustained higher lows, and an eventual surge past prior resistance levels.
Current 4H Chart Setup: A Mirror Image?
Yellow Highlight: Once again, we saw a bounce that didn't quite touch the key demand zone ($98K–$100K).
Red Zone Prediction: If this mirrors the historical move, the price is likely to return and touch this S&D area before launching a bullish leg.
Blue Path Projection: A sharp reversal is expected post-touch, aiming toward $111K–$113K as the next key resistance zone.
The descending trendline adds confluence
___________________
History Doesn’t Repeat, But It Often Rhymes
Based on this fractal analysis, Bitcoin is likely forming the same bullish base seen earlier in 2025. The setup hinges on one key event: a return to the $99K–$100K zone, where demand is likely to step in aggressively.
If the pattern repeats, the current market may offer one last high-reward long opportunity before a parabolic rally.

BTCUSD – Major Decision Point at The Edge📍 By: MJTrading |||
Bitcoin has rallied sharply from ~$98K and is now testing a critical confluence zone — the top of the descending channel and a strong supply area, known as "The Edge."
EMAs are turning up, supporting bullish momentum
⏳ What’s Next?
At this stage, two scenarios emerge:
⚠️ This is a make-or-break zone:
🟩 Breakout above the channel signals trend reversal → next resistance: $111K
🟨 Rejection leads to a move back to the $103K or $100K levels
This setup offers a high-RR opportunity for both breakout traders and mean reversion players.
🧠 Trade the reaction at the edge, not the prediction.
Thanks for your attention...
Share your thoughts...
—
#BTCUSD #Bitcoin #CryptoTrading #TheEdge #BreakoutOrBounce #CryptoSetup #DescendingChannel #SmartMoney #TechnicalAnalysis #PriceAction #SwingTrade #EMA #RiskReward #MJTrading #4hChart #TrendDecision #SupplyZone

Bitcoin short position After my win streak from previous trades on btcusd I happy to give me to the people who followed me
Here's another great trade for you
Short Bitcoin with a limit order at 108,500
Take profit at 101k , stop loss at 109,500
A 7.5 to 1 risk reward ratio 🔥😉
You can never find anybody trade Bitcoin like me

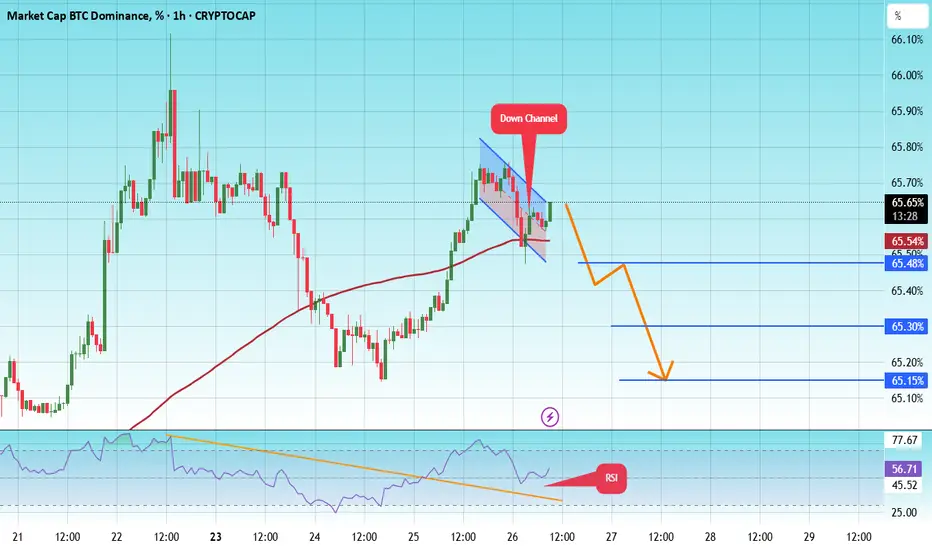
BTC Dominance New Update BTC.D
We are at a critical juncture in Bitcoin's dominance.
A major decline in Bitcoin's dominance has likely already begun. If the green zone is lost, dominance could see a sharp decline, especially since the last wave of this diagonal pattern, Wave G, touched the 0.618 Fibonacci level.
However, there is still a possibility that the green zone could push the price back close to the previous high before we see a decline in dominance. However, there are also indicators that the major decline may have already begun. Follow the chart closely and monitor it closely.
First Target: 65.50%
Second Target: 65.30%
Third Target: 65.15%
To manage risk, don't forget about stop loss and capital management.
Bitcoin - Weekend OutlookCRYPTOCAP:BTC | 6h
Bitcoin is compressing below its all-time high, with 108k as the local resistance that must be reclaimed for a bullish continuation to retest the highs.
I expect the price to clear some poor highs around 108.8k–109.6k before taking out the bad lows around 106.3k-105.4k
As long as we hold above 104k , I believe we’re in a strong position and expect we will retest the highs.
However, losing the 103k support level would be concerning.

BITCOIN → Pause for consolidation before growth. 115K?BINANCE:BTCUSDT focus on the structure on D1. The market is forming local resistance and consolidation after growth. The fundamental background is positive. BTC is following the SP500
The market is recovering in line with the stock market (SP500, NQ) after the de-escalation of the situation in the Middle East. The fall in the DXY is also providing support.
Technically, the focus is on the consolidation phase after the distribution triggered by a false breakout of 100K. The price stopped before the resistance at 108100 and rolled back to 106500, confirming the boundaries of the local trading range, the essence of which is a pause for a breather before a possible continuation of growth. The structure on D1 is compression towards resistance. The trigger is 108100, and a breakout of this level could trigger distribution towards 110500 and ATH.
Despite the fact that the market is under a cascade of resistance (resistance: 108100, 110400, 11900 (ATH)), an important nuance is that after strong growth, the price moved into accumulation in the 100K-110K range on D1-W1, and there are no reasons for a decline yet.
Resistance levels: 108100, 108900, 110400
Support levels: 106500, 104650
If the market structure within 106500 - 108100 remains unchanged and BTC continues to storm the consolidation resistance in the “compression to level” format and stick to the level, the chances of a breakout will increase. I do not rule out the possibility of a pullback to 106500, 105650 before a possible rise to ATH.
Best regards, R. Linda!

StochRSI indicator and support and resistance levels
Hello, traders.
If you "follow" me, you can always get the latest information quickly.
Have a nice day today.
-------------------------------------
The StochRSI indicator on the left chart is slightly different from the StochRSI indicator on the right.
The StochRSI indicator on the left chart is the StochRSI indicator provided by default in TradingView, and the StochRSI indicator on the right chart is an indicator with a modified formula.
The StochRSI indicator is a leading indicator that is reflected almost in real time.
Therefore, it reacts sensitively to price changes.
Although it is advantageous because it reacts sensitively, it also increases the possibility of being caught in a fake, so I thought that a slight delay(?) was necessary, and so I created the StochRSI indicator on the left chart.
If you look at the relationship between the K and D of the StochRSI indicators on the two charts, you can see that there is a big difference.
In the end, you can predict the movement by checking whether the movement of the K line has escaped the overbought or oversold section.
However, I think that you will receive information that can determine the sustainability of the trend depending on the positional relationship between K and D.
Therefore, it is important to distinguish the inflection points that occur in the StochRSI indicator.
This is because these inflection points provide important information for drawing trend lines.
Therefore, the StochRSI indicator on the left chart, which better expresses the inflection point, is being used to draw the trend line.
(Unfortunately, this indicator was not registered on TradingView because I did not explain it well.)
-
As a new candle was created, the StochRSI indicator on the left chart is showing an inflection point on the K line.
The StochRSI indicator on the right chart is showing a transition to a state where K < D.
We will have to check whether the inflection point was created only when today's candle closes, but I think that the fact that it is showing this pattern means that there is a high possibility of a change in the future trend.
Since the next volatility period is expected to start around July 2nd (July 1st-3rd), I think it has started to show meaningful movements.
-
It is true that you want to buy at the lowest price possible and sell at the highest price.
However, because of this greed, one mistake can lead to a loss that can overturn nine victories, so you should always be careful.
Therefore, if possible, it is better to check for support and respond.
In that sense, I think it is worth referring to the relationship between K and D of the StochRSI indicator on the left chart.
This is because the actual downtrend is likely to start when K < D.
-
In order to check for support, you definitely need support and resistance points drawn on the 1M, 1W, and 1D charts.
Ignoring this and checking for support at the drawn support and resistance points can result in not being able to apply the chart you drew to actual trading.
Therefore, you should draw support and resistance points first before starting a trade.
Otherwise, if you draw support and resistance points after starting a trade, you are more likely to set support and resistance points that reflect your subjective thoughts, so as I mentioned earlier, you are more likely to lose faith in the chart you drew.
If this phenomenon continues, it will eventually lead to leaving the investment market.
-
It is important to determine whether there is support by checking the correlation between the StochRSI indicator and other indicators at the support and resistance points drawn on the 1M, 1W, and 1D charts.
Even if the inflection point of the StochRSI indicator or other indicators occurs at a point other than the support and resistance points you drew, you should consider it as something that occurred beyond your ability to handle.
In other words, you should observe the price movement but not actually trade.
As I mentioned earlier, if you start to violate this, you will become less and less able to trust the chart you drew.
-
Accordingly, the basic trading strategy I suggest is to buy near the HA-Low indicator and sell near the HA-High indicator.
However, since the HA-Low and HA-High indicators are expressed as average values, they may move in the opposite direction to the basic trading strategy.
In other words, if the HA-Low indicator is resisted and falls, there is a possibility of a stepwise downward trend, and if the HA-High indicator is supported and rises, there is a possibility of a stepwise upward trend.
Therefore, the basic trading strategy mentioned above can be considered a trading strategy in the box section.
In the case of deviating from this box section, it is highly likely to occur before and after the volatility period indicated by the relationship between the trend line using the StochRSI indicator mentioned above and the support and resistance points drawn on the 1M, 1W, and 1D charts.
Therefore, special care is required when conducting new transactions during the volatility period.
This is because there is a high possibility of being caught in a fake when trading during the volatility period.
-
The DOM(60) and DOM(-60) indicators are good indicators to look at together with the HA-Low and HA-High indicators.
The DOM indicator is an indicator that comprehensively evaluates the DMI, OBV, and MOMENTUM indicators.
Therefore, the DOM(60) indicator is likely to be at the end of the high point range, and the DOM(060) indicator is likely to be at the end of the low point range.
In the explanation of the HA-Low and HA-High indicators,
- I said that if the HA-Low indicator receives resistance and falls, there is a possibility that a stepwise downtrend will begin,
- and if the HA-High indicator receives support and rises, there is a possibility that a stepwise uptrend will begin.
In order for an actual stepwise downtrend to begin, the price must fall below DOM(-60), and in order for a stepwise uptrend to begin, it must rise above DOM(60).
In other words, the DOM(-60) ~ HA-Low section and the HA-High ~ DOM(60) section can be seen as support and resistance sections.
-
If these correlations start to appear, I think you will be able to create a trading strategy that fits your investment style without being swayed by price volatility and proceed with trading.
The reason for analyzing charts is to trade.
Therefore, the shorter the time for chart analysis, the better, and you should increase the start of creating a trading strategy.
-
Thank you for reading to the end.
I hope you have a successful trade.
--------------------------------------------------

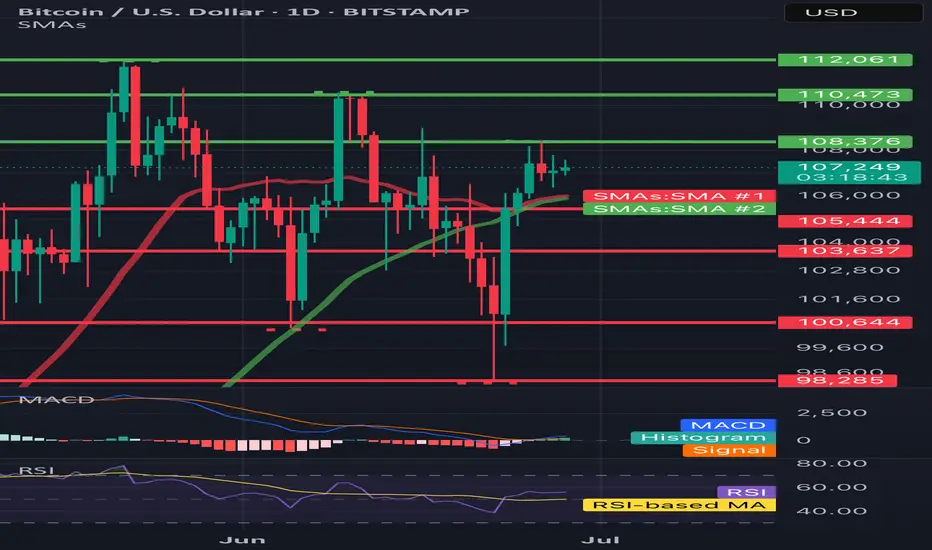
BTC/USD 1DHello everyone, let's look at the 1D BTC chart to USD, in this situation we can see how the 3rd peak formed us and we are currently fighting to maintain the price or a potential output up if we do not see a try to break out, you can expect a stronger relief.
However, let's start by defining goals for the near future the price must face:
T1 = 108376 $
T2 = 110473 $
Т3 = 112061 $
Let's go to Stop-Loss now in case of further declines on the market:
SL1 = 105444 $
SL2 = 103637 $
SL3 = 100644 $
SL4 = 98285
Looking at the RSI indicator, we see
As we entered the upper part of the indicator again, however, there is still a place to try to grow.

HelenP. I Bitcoin can drop from resistance levelHi folks today I'm prepared for you Bitcoin analytics. If we examine the chart, we can see that the price has approached a significant resistance zone between 108200 and 108800. This area previously acted as a ceiling for the price, and now coincides with the retest of the broken trend line from above. After a strong bullish push from the support zone near 103000, the price is currently consolidating just below resistance, which often signals hesitation and potential reversal pressure. Earlier, we observed a period of consolidation around the support zone, followed by a breakout that broke above the trend line. However, the current structure suggests that the breakout may have been temporary. With multiple signs of slowing momentum and price failing to break convincingly through the resistance, a bearish move from this level becomes increasingly likely. Given the context, I expect BTCUSD to reject this resistance and move downward toward the 103000 support level again. That is my current goal, as I anticipate the price to complete a corrective wave in line with the overall structure. If you like my analytics you may support me with your like/comment ❤️
Disclaimer: As part of ThinkMarkets’ Influencer Program, I am sponsored to share and publish their charts in my analysis.

BRIEFING Week #26 : Are we going for a Bubble ?Here's your weekly update ! Brought to you each weekend with years of track-record history..
Don't forget to hit the like/follow button if you feel like this post deserves it ;)
That's the best way to support me and help pushing this content to other users.
Kindly,
Phil

Has Bitcoin Topped? Trump’s SBR Impact | Deep Dive Analysis🚨 Has COINBASE:BTCUSD topped? Even with Trump's Bitcoin Strategic Reserve? 🚨
In this deep dive, we analyze COINBASE:BTCUSD major factors that could point to a major reversal or breakout and to uncover whether a market top is forming.
We’ll cover:
Powerful Indicators
Bitcoin / BTC Trends
Price Action
EMA / SMA Trends
Volume Delta
Trend reversal / breakout
Bullish / Bearish / Confirmation from Indicators
order flow analysis
Timeframes (1W, 1D, 1m, 6M etc.)
Bullish and Bearish Sentiment
Strength Candles
👉 Like, comment below, and follow for more pro-level crypto insights.
MartyBoots here , I have been trading for 17 years and sharing my thoughts on COINBASE:BTCUSD .
Whether you're a short-term trader or long-term investor, this post provides the technical insight and edge to help you make better informed decisions.
📉 Stay ahead of the market. Watch the full breakdown and view charts to decide for yourself: Has Bitcoin really topped?
Watch video for more details and below I will show some powerful charts with descriptions.
Warning in near term - LARGE ORDERS
Consolidation in price with large orders above
The Red lines = LARGE ORDERS
Large orders can act as an magnet to price
Large orders can also be support and resistance
Price Above the white 100 moving average
Price strong above it
Price weak below it
Strength Candles
Still Bullish
Multiple timeframes still green
Sentiment Tool Still Bullish
Still Bullish
Multiple timeframes and settings still green
3 Drive Structure
Equal Measured moves
Implies Top Is Not In
Target = $126k
Bullish Engulfing Candle
Implies higher prices to come
👉 Like, comment below, and follow for more pro-level crypto insights.
#Bitcoin #Trump #BTC #CryptoTrading #TechnicalAnalysis #CryptoMarket #BitcoinTop #TradingView #StrategicBitcoinReserve

BTC - Will the Bears finally get their chance?Buy Side Liquidity Sweep in Progress
Price is currently climbing toward a region densely packed with resting buy side liquidity, marked by multiple previous highs. The area around 108,900 to 111,000 is especially significant, with two clear liquidity pools stacked above recent swing highs. These levels are likely to attract price as market participants seek to trigger stop orders and induce fresh buying interest—setting the stage for a potential reversal.
Weakness in the Current Impulse
The recent rally has advanced with minimal retracement and virtually no visible Gaps. This lack of corrective structure often indicates imbalance and suggests the move is overextended. When price moves upward too cleanly, it tends to leave behind thin liquidity zones, making the entire leg vulnerable to a sharper correction once exhaustion sets in.
Fair Value Gap as a Draw Below
Below current price lies a prominent bullish Fair Value Gap around 104,000. This inefficiency was left unfilled during the last leg up and may now serve as a magnet for price. These types of Gaps are often revisited by the market in an effort to rebalance supply and demand, especially after aggressive moves that break structure to the upside.
Once the higher liquidity levels are swept, watch for a clear reaction—either a strong rejection or lower timeframe structure shift—which could signal that the top is in. If that shift materializes, price may begin a downward leg targeting the unfilled Gap below. The magnitude of the move, combined with the lack of structure on the way up, leaves plenty of room for corrective action.
For those looking to engage, waiting for confirmation on a lower timeframe—such as a break of short-term bullish structure or the formation of a bearish Gap—can help time entries more precisely. In setups like these, patience is key: let the Sweep play out, observe how price reacts, and only then consider stepping in.

IRENs Incredible Surge Continue next wWeek?NASDAQ:IREN has been on a rampage since the April surging 175% and nearing all time high! A great couple of trades for us so far!
Price is likely to hit all time high next week with such a strong trend, where resistance and a pullback is a high probability.
The weekly pivot is $9.77, the most likely area for price to find support just above the 0.382 Fibonacci retracement (which will be dragged up to the weekly pivot once a new high is made).
Price discovery terminal target are the R3 & R5 weekly pivot points at $28 and $40.
Safe trading

$HUT Macro Chart Preparing for Breakout?NASDAQ:HUT looks poised for a strong breakout with a wave 3 long term target of $58 and a short term resistances of $21 and $33
HUT is moving strong almost up 100% from the recent swing low, overcoming its weekly 200EMA with ease. A test of the 200EMA as support is likely before continuation.
Price is consolidating under major resistance High Volume Node (HVN) and the weekly pivot point. Consolidation under resistance often leads to a breakout.
A series of 1-2s appears to be taking place on the Elliot Wave count finding support at the 'BTC-Miners golden pocket' of 78.6 Fibonacci retracement.
Analysis is invalidated below $10.10
Safe trading

Bitcoin Bullish But... Support Zones (Incl. Altcoins)Bitcoin is bullish right now but we know things can change. As long as the action is happening within the blue and gray space, all is good, the bullish bias remains intact. If the action moves below the gray zone and enters the orange zone, this is the danger zone. This danger zone can turn into a buy opportunity or a wait and see approach.
On the other hand, if Bitcoin remains above the blue zone this is ultra-bullish short-term. This is specially bullish for the altcoins but it is bullish for Bitcoin as it reveals consolidation at high prices, but right now we have a lower high so anything goes.
The chart is mixed when looked at up-close. Bullish long-term and on all bigger timeframes. Corrections tend to develop from high prices.
One more thing to consider
When we look at the action short-term we can miss the bigger picture, we can become clouded with noise. The bigger range is $100,000 - $110,000, this is the new long-term support zone that is being established and created before additional growth. Bitcoin can remain here for weeks or even months, if this happens, the altcoins will continue to grow.
We are in a bull market. Bitcoin is obviously in a bull market as it is trading near its all-time high after years of growth. The altcoins are just getting started after years of sideways action... Some altcoins hit new all-time lows but still part of a broad, long-term consolidation phase. Many produced higher lows, some produced lower lows, it makes no difference.
The bear market ended in mid/late 2022 and the ensuing two years we had mix growth. Bullish waves and bearish waves, with the usual variations of course.
The year is now 2025 and Bitcoin is up, most of the big projects have been growing for years now and we are getting close to the final advance, the major fifth wave and the bull market bull run. When this happens, close to its end, all the smaller projects will produce the biggest growth in their history and this will be the boom that will catapult Crypto to take over the financial world.
It won't be the first time this event happens nor the last, the market will continue to fluctuate.
I know there is a lot of information out there and we can become uncertain with every drop, but look at the price; what do you see? Bitcoin is going up.
The altcoins are set to follow, the altcoins do what Bitcoin does.
Namaste.
