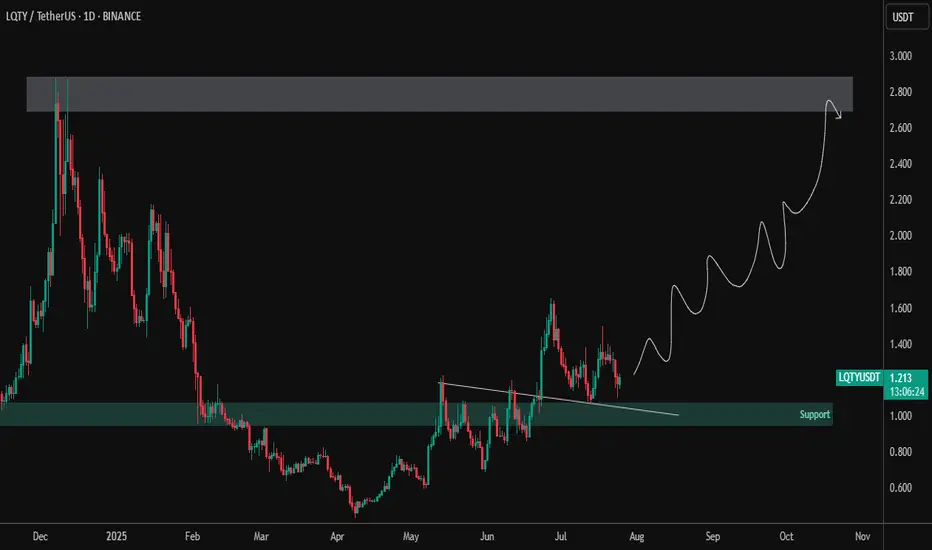
LQTY – Accumulation Completed | Preparing for Trend ReversalLQTY has broken out from a descending structure and reclaimed the key support zone around $1.00–$1.10, showing early signs of accumulation and bullish strength. Currently forming a higher low structure, suggesting a potential long-term uptrend is brewing.
🔹 Technical Highlights:
✅ Clean breakout from descending trendline
✅ Retest of breakout zone holding as support (~$1.10)
🔼 Price printing bullish higher lows on the daily timeframe
🎯 Target zone: $2.70–$2.90 (major resistance from previous highs)
📌 Technical View:
Strong structural base forming
Pullbacks into support area could offer high R/R entries
Break above $1.50 may ignite bullish continuation toward the upper target zone
LQTY appears to be transitioning from accumulation to markup phase. Monitor price action and volume for confirmation of the next leg.
Btc-e
That's where the $BTC 2017 vibes are felt!As we mentioned before, the current cycle that Bitcoin is in is exact

Bitcoin + $200k is magneI disagree with the claim that bitcoin local peak was seen highlighted in ct. I think the bitcoin run will continue and the local peak will be around +$200k
If we take the stretched cycles as a basis, we can understand this through many indicators.

ETH/BTC vs btc dominanceethereum received a reaction as we expected from the current demand zone in the bitcoin pair, and it seems inevitable that the upward momentum from the current area will continue. on the bitcoin dominance side, the same situation exists, but I think we will witness a bearish absolute process.

Bitcoin & 150k TOPBitcoin has been trading within a rising channel for a long time, with resistance at $150,000. The middle support/resistance line also indicates $150,000, suggesting a potential significant rejection at this level.

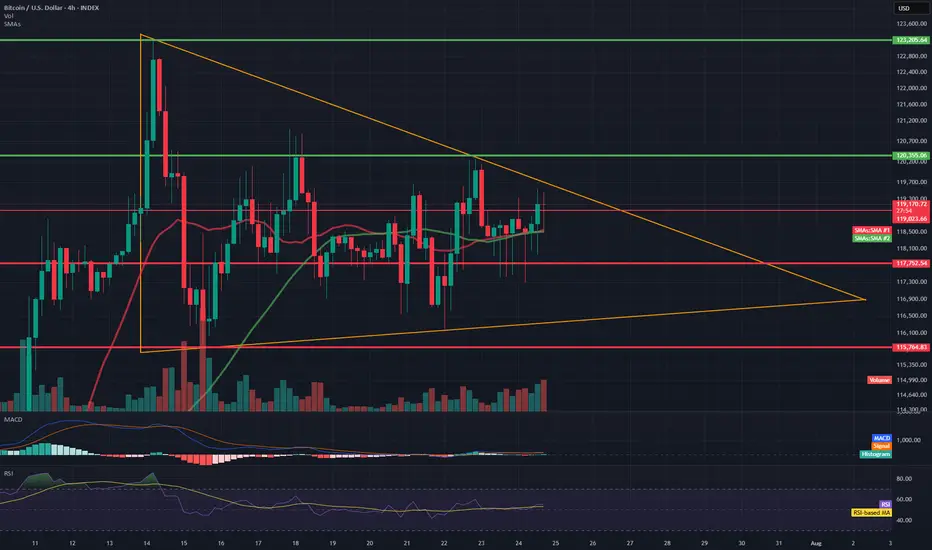
BTC/USD 4H Chart Review📊 Technical Structure (Symmetrical Triangle)
Formation: The symmetrical triangle (orange lines) remains intact—price continues to move within it.
Approaching the apex: The closer to the intersection of the triangle's arms, the greater the probability of a breakout. The current candle is testing the upper boundary of the formation (around $119,300), but has not yet broken it.
Direction: The formation is neutral, but tension is increasing. A breakout of either line (the upper boundary ≈$119,500 or the lower boundary ≈$117,700) could trigger a dynamic move with a range of around $3,000 (the height of the triangle at its widest point).
🧱 Support and Resistance Levels (Red and Green Lines)
Type Level (USD) Description
Resistance 123205 All-Time High – Possible Target After an Upward Breakout
Resistance 120556 Local Resistance – Triangle Breakout Range
Resistance 119200–119300 Currently Tested Level
Support 117752 Lower Triangle Boundary – Critical Defense Line
Support 115764 Next Local Support
📈 Technical Indicators
🔵 RSI (Relative Strength Index)
Currently: ~55 – indicates a neutral situation, having broken down from the overbought level (~74).
Indicates that the market has temporarily cooled down after a previous impulse. There is still room for further upward movement without exceeding 70.
🔵 MACD
The MACD and signal lines are approaching a crossover – if the MACD crosses the signal line upward, it could be a bullish signal.
The histogram is slightly positive – indicating weak but growing bullish momentum.
📊 Volume
Slightly increasing in the last candles – no confirmation of a strong breakout yet, but upward pressure is building.
🧠 Interpretation
Scenario Technical Conditions Movement Objective
🔼 Upward Breakout
Candlestick close above $119,500 USD 122,000–$123,200 USD
🔽 Downward Breakout
Close below 117,750 and confirmed by volume at 115,700, then 114,000 USD
🔄 Consolidation
Inconclusive, continued sideways movement
Between $117,700 and $119,500 USD
✅ Summary
Bitcoin is still in a neutral symmetrical triangle formation but is approaching a turning point.
The RSI has broken out of the overbought range, and the MACD is signaling a potential upside breakout.
Volume confirmation is still lacking, but technical conditions favor the bulls – if it manages to break above 119,500 and hold above, a move towards 122,000–123,000 USD can be expected.
In the event of a rejection, maintaining 117750 will be key; breaking it opens the way to 115700 and below.
BTC.D in Play! Rejection or Reversal? This is BTC.D on the daily chart
It recently dropped below the 200MA and found support at the 0.382 Fib level
Today price is getting rejected by both the 200MA and the 62.25 Fib level
If it stays below we could see a move back down to 0.382
If it closes above the confluence area more upside is possible
Or it could simply range here for a while
We cant control what happens so best to stay patient and ready
Always take profits and manage risk.
Interaction is welcome.

Sell Signal on Bitcoin (1-week timeframe)The IQTrend indicator shows a Sell signal on the weekly timeframe for BINANCE:BTCUSDT .
I also noted the percentage of movement after previous signals so that you understand the seriousness of the situation.
Of course, this time it may be a little different, but I think it's worth keeping this signal in mind anyway.
DYOR

$IREN More downside after huge rally!NASDAQ:IREN is printing bearish divergence on the daily RSI at all tie high resistance.
An Elliot wave motif wave appears complete and wave looks underway with a shallow target of the daily pivot, 0.382 Fibonacci retracement and ascending daily 200EMA.
The daily red wick after printing a 20% start to the day is reminiscent of a blow off top in this asset trapping newbs with FOMO price discovery pump. Market behaviour in action!
Analysis is invalidated if price returns to all time high.
Safe trading

btc vs. ethBitcoin vs. Ethereum 🔃
It is obvious that Ethereum has not yet made a real run compared to other cycles compared to Bitcoin, and I think that the current correlation gap will close in the coming period.

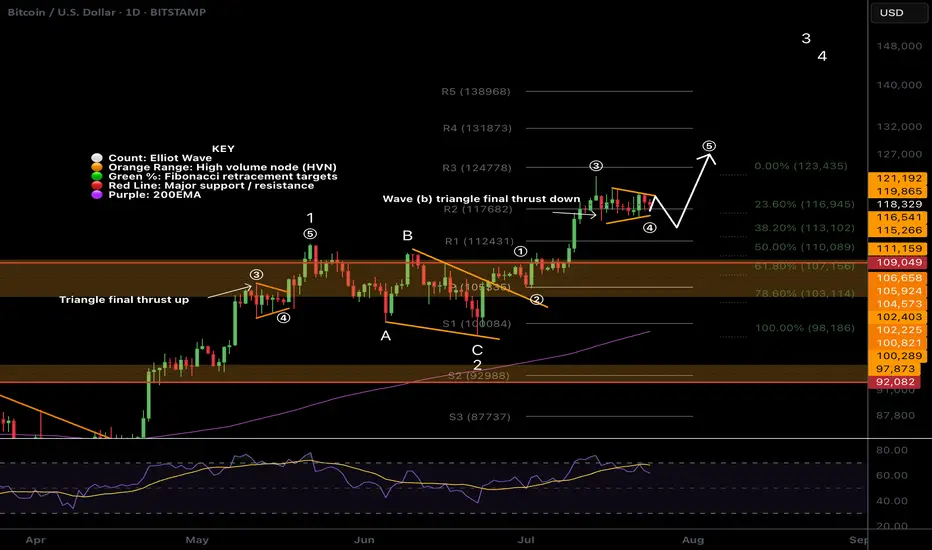
$BTC Wave (b) triangle?CRYPTOCAP:BTC Bitcoin appears to have competed wave 3 up, wave (a) down and now finishing a triangle in wave (b) which would result in a thrust down to around $113k before continuing to the upside in wave (5).
There is slight bullish divergence on daily RSI and wave (4) meets the Fibonacci retracement rules of between 0.236 - 0.382 adding confluence.
Previous all time high is expected to be tested as support on a larger correction, perhaps when the ascending daily 200EMA creeps up to the same level after we blow off.
Safe trading
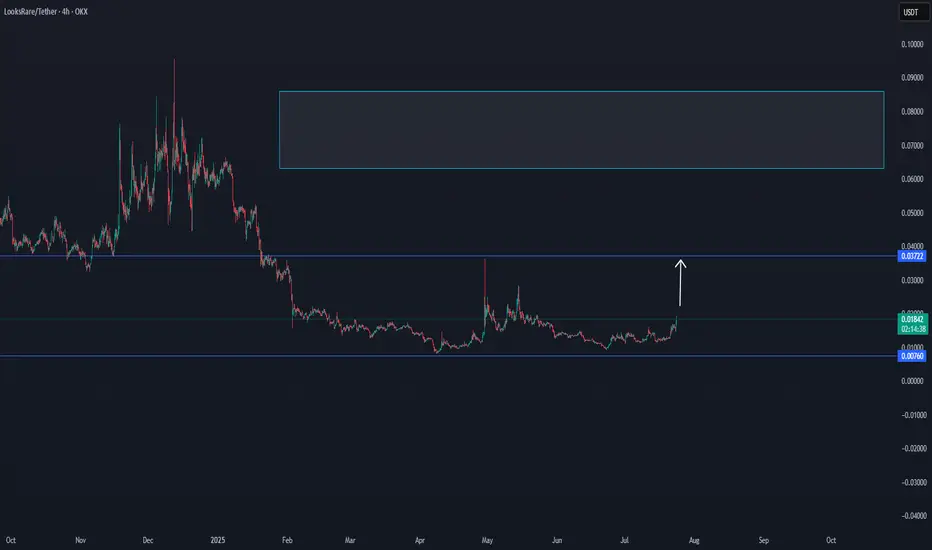
LOOKS/USDT NEW INCREASE VOLUMELooks seems to have trending on a low time frame new increase trending, following to see if this coin is able to get confirmed in the next hours.
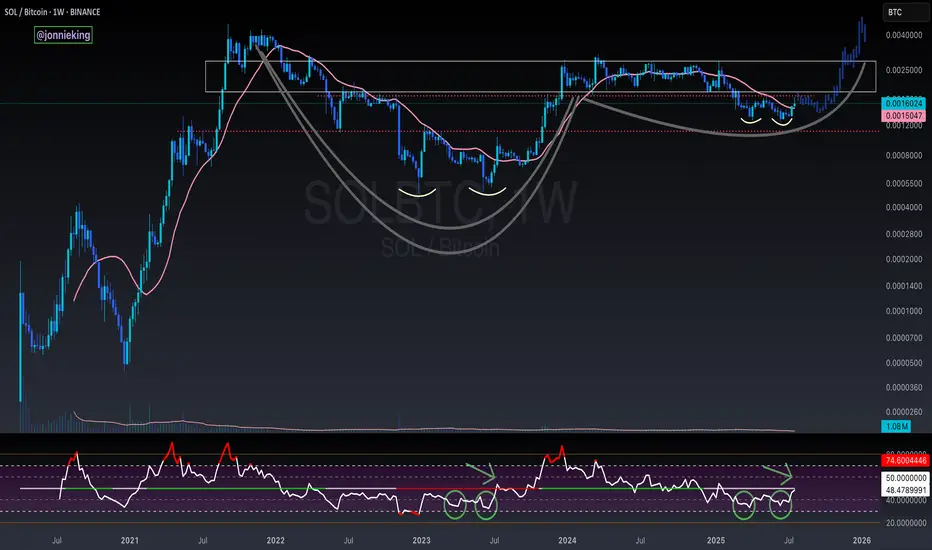
SOL / BTC Cup and Handle Weekly ChartBeautiful cup and handle on the SOL / BTC Weekly chart.
Need to break above the neckline and reclaim the POI.
Double bottom on the RSI matches just before the rip in July 2023.
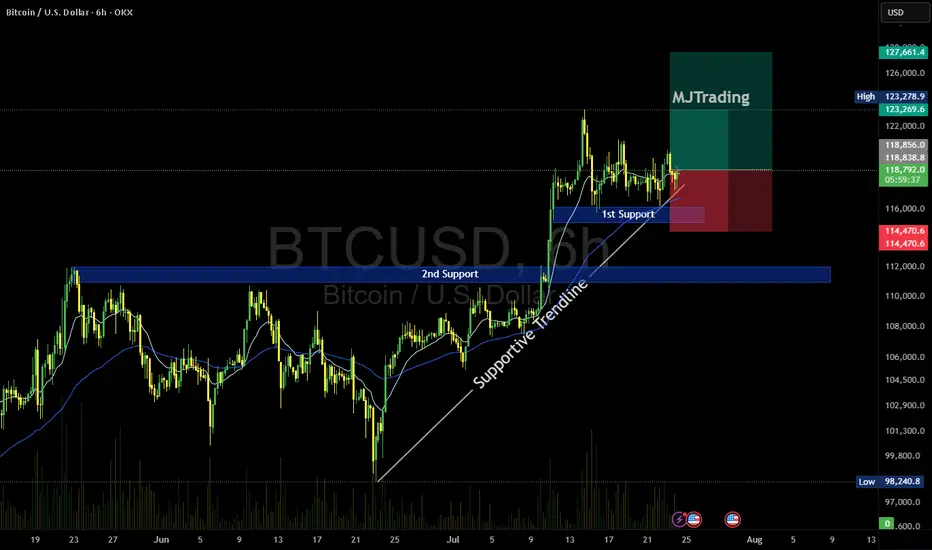
BTC/USD Buy Setup (6H Chart)📈 BTC/USD Buy Setup (6H Chart)
Strategy: Trendline Support Bounce
🔹 Entry
Price: $118,674.3
Reason: Price is bouncing off a supportive trendline and holding above the 1st Support zone.
🔻 Stop Loss (SL)
Price: $114,470.6
Reason: Below the 1st Support zone to protect against breakdown.
🎯 Take Profit Targets
TP1: $123,269.6
Reason: Near recent swing high, good for partial profit.
TP2: $127,661.4
Reason: Next resistance zone, ideal for full exit or trailing stop.
#MJTrading
#Bitcoin
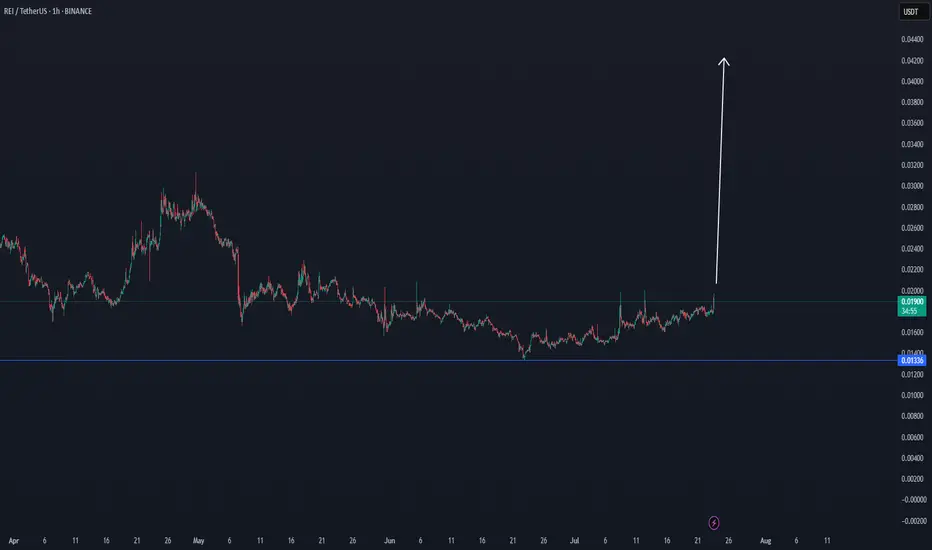
REI/USDT THE NEXT WHALE INCREASE COIN $0,04 TargetREI/USDT THE NEXT WHALE INCREASE COIN
This coin seems to have a powerful DCA effect, which can be confirmed in the coming time frames with a break.
When there is interest, and new confirmations, here below the update.
entering this coin only when there are more confirmations
The first confirmation is to get first out of this box
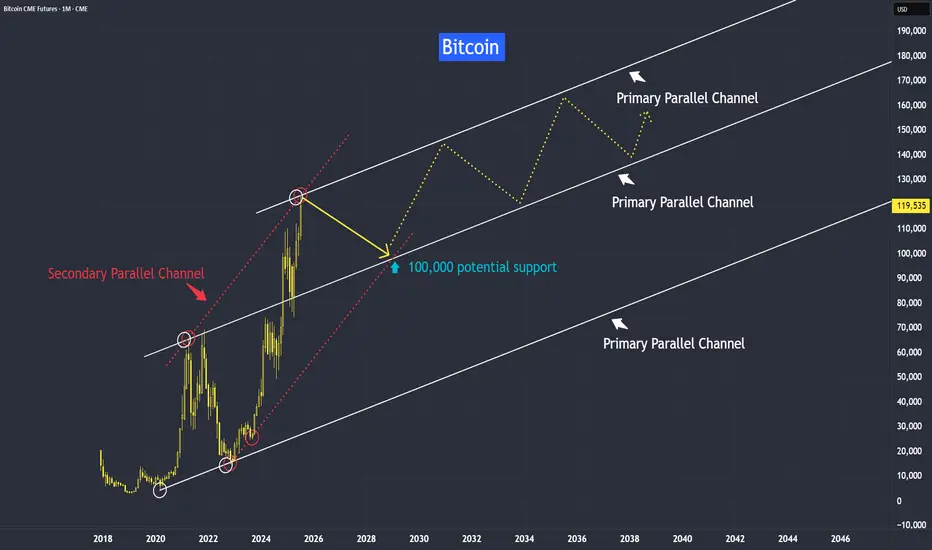
Bitcoin New Support at 100,000Bitcoin’s trend has been growing from strength to strength — and it’s likely to stay that way. Why?
This trend isn’t driven purely by speculation; it’s supported by strong fundamental reasons.
One of the most widely debated topics in finance today is the comparison between Bitcoin and gold. While both are viewed as stores of value, their long-term roles may diverge significantly.
Yes, gold and bitcoin have been moving up in near perfect synchronization with inflation.
Gold is traditionally seen as an inflation hedge, and since June 2022 — when inflation peaked at 9% — we’ve seen both gold and Bitcoin trend higher up to the present day.
Instead of asking why the Fed isn’t cutting interest rates despite the decline in CPI, perhaps we should ask: why the Fed prefers to maintain rates at the current level. What are they seeing with the data and the developments?
When both gold and Bitcoin hold steady at these elevated levels, it suggests that investors still believe the threat of rising inflation remains valid.
In all bull markets, the path is never straightforward — it’s often jagged along with volatility.
What distinguishes a continuing bull market - is the formation of higher lows along its timeline.
However, like gold which we recently discussed, Bitcoin may be approaching a medium-term resistance.
In this first week of this year tutorial, we observed an inverted hammer in the last month of 2024, suggesting a potential correction in Bitcoin, but yet seeing support at around 82,000 level.
As anticipated, the inverted hammer was followed by a correction here toward our support level at around 82,000, with some false breaks along. From that point, the market resumed its upward climb.
Now, it appears to be encountering resistance again.
Still, as long as the market continues to form higher lows, and the threat of rising inflation still remain, the bull trend should remain intact.
This is how the projection might look when mapped with a trendline.
We observed that the primary parallel trendline is reacting in relationship to each other. Next I would like to explore its secondary channel.
Please don’t interpret this as a literal path. Instead, I hope it serves as a guideline to help you form your own projections as the market evolves.
Gold is preferred by older generations, central banks, and conservative investors. Deeply entrenched in traditional finance and cultural value systems.
Cryptocurrency has a rapid adoption by younger investors, tech-native users, and institutions. Millennials and Gen Z are more likely to trust cryptographic assets than governments or fiat systems.
I will keep an open mind to both inflation hedge asset and their instruments.
Its video version for this tutorial:
Disclaimer This analysis is based on technical studies and does not constitute financial advice. Please consult your licensed broker before investing.
Mirco Bitcoin Futures and Options
Ticker: MBT
Minimum fluctuation:
$5.00 per bitcoin = $0.50 per contract
CME Real-time Market Data help identify trading set-ups in real-time and express my market views. If you have futures in your trading portfolio, you can check out on CME Group data plans available that suit your trading needs www.tradingview.com
BITCOIN → Consolidation and compression to 116K. Correction?BINANCE:BTCUSDT.P continues to consolidate, with the price testing support at 116K, leaving behind the zone of interest at 120K-121K. Are there any chances for further growth?
(Alternative scenario (if growth to 120K does not occur))
Fundamentally, there is nothing particularly new, and the hype surrounding Bitcoin is stagnating. Technically, on D1, consolidation is underway with pressure from bears against the backdrop of an outflow of funds into altcoins. However, the dominance index is starting to rise, which could trigger some correction in the market. The price on the working timeframe, without updating local highs, is testing lows, and the latest retest of the liquidity zone is provoking a fairly aggressive reaction that could bring the price to retest the zone of interest at 120K-121K.
But! If the price is squeezed between 116K and 0.5 Fib with a gradual squeeze towards support, the chances of a breakdown and a premature fall will increase.
Support levels: 116370, 115860
Resistance levels: 119650, 120100
Technically, the market needs a breather or correction, which is generally a sign of health. The nuance with Bitcoin is that below 115860 there is no support until 112K, and if the market breaks the current consolidation boundary, the further correction could be quite deep. In the current situation, I do not yet see any drivers or reasons for another rally.
Best regards, R. Linda!

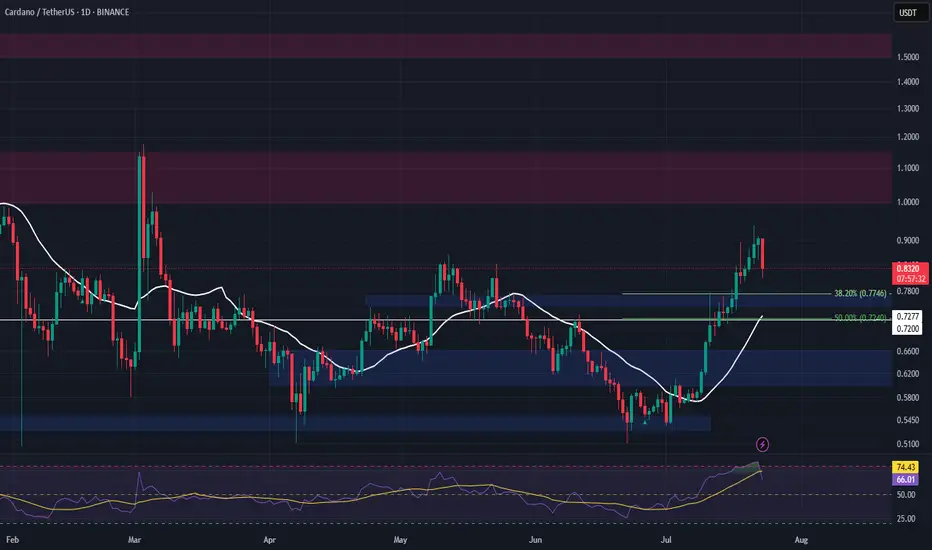
ADA Spot Entry – Pullback Opportunity AheadADA has reached a major resistance zone, and with the broader market appearing overbought, a healthy pullback looks likely. We’re watching for a dip into the next key support area to accumulate for spot holdings.
📌 Trade Setup:
• Entry Zone: $0.75 – $0.77
• Take Profit Targets:
o 🥇 $1.00 – $1.15
o 🥈 $1.50 – $1.60
• Stop Loss: Just below $0.72
btc . july . w4 . d3 yesterday was beautiful. dOpen was vorhersehbar. wednesday brings liquidity. the chart might not look like much, but i see movement coming. resistance is obvious, price target is violent.

BITCOIN Former Resistance turned Support!Bitcoin (BTCUSD) is consolidating right above the December 17 2024 Pivot trend-line, a level that started off as a massive Resistance delivering two strong rejections but has now been turned into Support, holding this consolidation.
The 1D MA50 (blue trend-line) will soon cross this Pivot trend-line and will confirm it as a Support with the price technically looking for a new Bullish Leg towards the 1.5 Fibonacci extension at least ($138000), similar to the April - May uptrend, which also consisted of an Accumulation Phase much like the current.
Can the Pivot trend-line provide the necessary support for such a rebound? Feel free to let us know in the comments section below!
-------------------------------------------------------------------------------
** Please LIKE 👍, FOLLOW ✅, SHARE 🙌 and COMMENT ✍ if you enjoy this idea! Also share your ideas and charts in the comments section below! This is best way to keep it relevant, support us, keep the content here free and allow the idea to reach as many people as possible. **
-------------------------------------------------------------------------------
💸💸💸💸💸💸
👇 👇 👇 👇 👇 👇

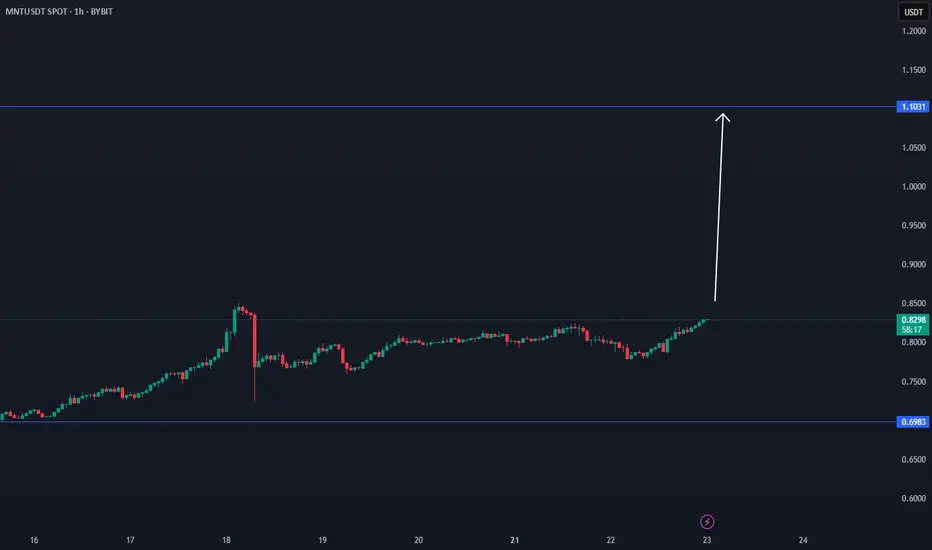
MNT TIME FRAME BREAKMNT has a good chance to break in the coming hours, depending last data.
$1.10 is an important target. 32% increase possibility.
Coin has acctive volume.
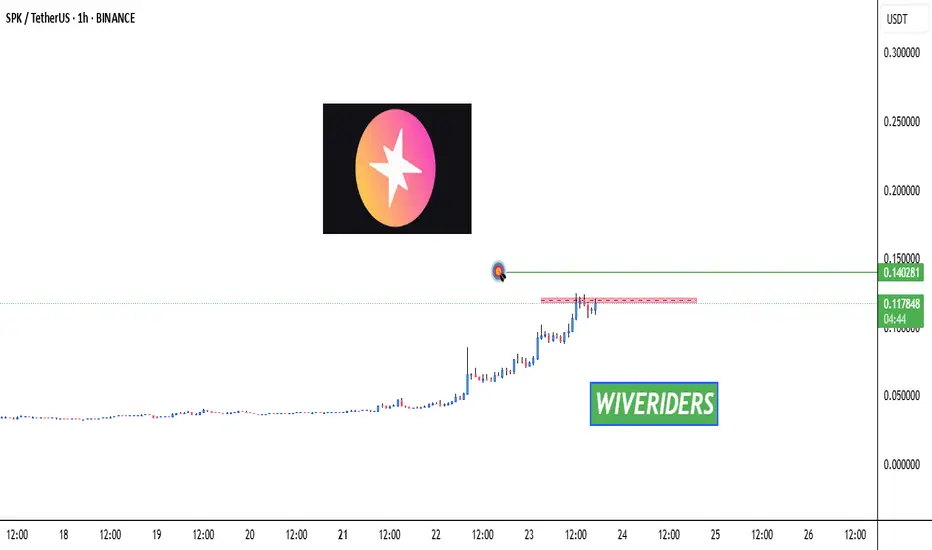
SPK Testing Red Resistance Zone 🚨 INDEX:SPK Testing Red Resistance Zone 🔴📈
INDEX:SPK is now testing the red resistance zone.
📊 Watch for breakout confirmation — if successful:
🎯 First Target → Green line level
This could signal the beginning of a new move up if buyers push through the resistance.
Let’s track it closely for a potential entry! 💼📈
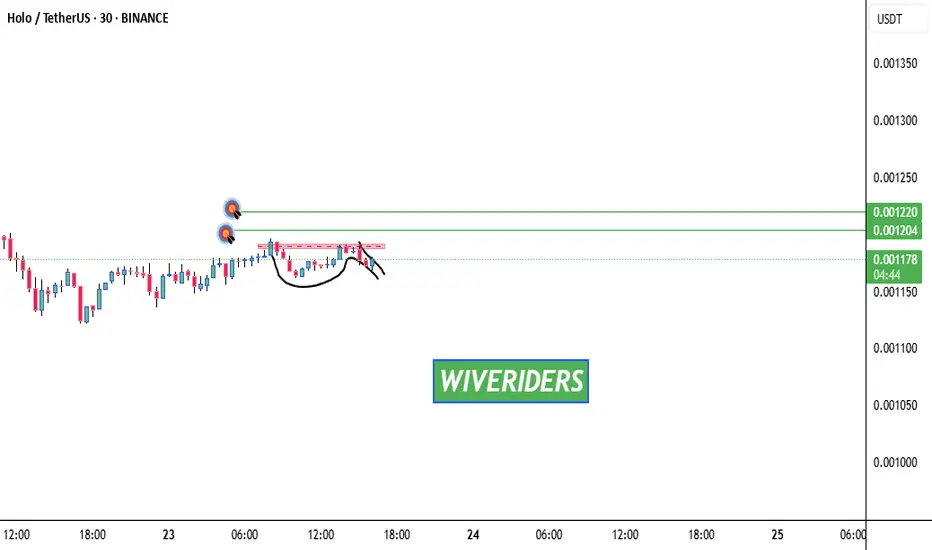
Cup & Handle Formation 🚨 XETR:HOT Testing Red Resistance – Cup & Handle Formation 📈
XETR:HOT is currently testing the red resistance zone and has formed a bullish Cup & Handle pattern on the chart — a classic continuation setup.
If breakout is confirmed, potential upside:
✅ First Target: Green line level
✅ Second Target: Green line level
🕵️♂️ Wait for clear breakout confirmation before entering long.
This pattern often signals strong momentum if buyers step in.
Trade smart. Let’s monitor for the perfect entry! 💹💼