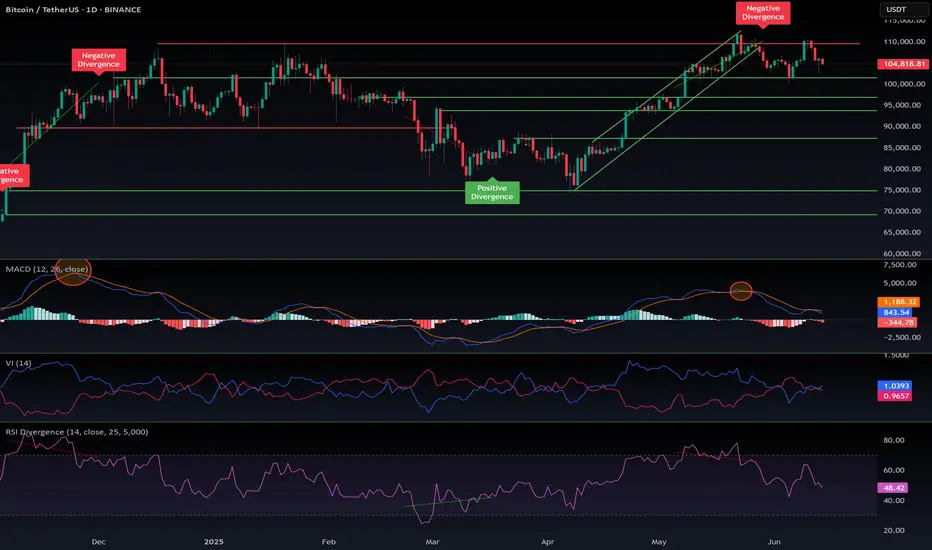
Bitcoin Under PressureBitcoin remains mired in a bearish trend as price action struggles below key moving averages—the 50-day, 100-day, and 200-day—all of which point to sustained downside pressure. On the higher timeframes, a clear descending trendline from the April–May highs remains firmly intact, reinforcing the macro downtrend.
The Relative Strength Index (RSI) continues to hover in the neutral-to-lower zones, with recent bounces still failing to cross bullish thresholds. A short-term relief rally emerged post-news volatility, with price attempting to retest the supply zone between $103.9K and $104K—a region of confluence with bearish Fibonacci levels and previous order blocks.
However, rejection at this level could set the stage for a further breakdown, targeting the $96.3K–$95.5K range. In the 1-hour and 4-hour timeframes, Fibonacci retracements and a climbing RSI suggest short-term relief is plausible, but a lower high formation would confirm continued bearish control.
BTC remains technically vulnerable despite short-term bounces, while geopolitical events and U.S. policy narratives shape market sentiment. Yet behind the volatility, continued ETF inflows, stablecoin stability, and altcoin resilience signal a market that, while cautious, remains fundamentally engaged.
Traders and investors alike should stay focused on key resistance levels for BTC, monitor developments in Middle Eastern tensions and U.S. crypto policy, and watch ETF and stablecoin flows as barometers of broader market conviction.
BTC-M

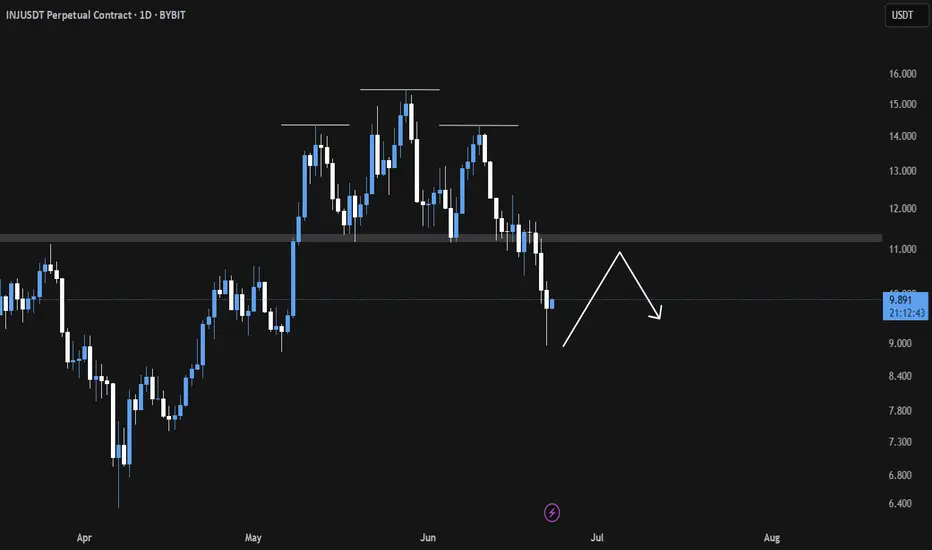
INJ Breakdown in Play Eyeing the Neckline for Precision ShortsINJ/USDT Analysis
〽️ The Head and Shoulders pattern has broken down successfully, confirming a bearish structure.
💠We anticipate a potential relief bounce towards the $11 region which aligns closely with the neckline retest zone. This area is likely to act as a liquidity trap, where institutional sellers may re-enter aggressively 👀.
🎯 Key downside targets remain at
1. $8.98
2. $8.03
3. $6.92
Strategic Plan 🎖️
Look to initiate short positions around the neckline retest near $11, as the risk-reward becomes increasingly favorable from that level.
Trade with discipline. Let the structure lead the execution. 🫡🧠
$BTC - Short-term OutlookCRYPTOCAP:BTC | 4h
We got a solid bounce off 98k
Next key level is 103.5k–104k. A clean reclaim flips short-term bias bullish.
If price gets rejected again, this likely confirms a bearish retest, and likely leading back down to the 94k–92k value area
Price could range for awhile at this level as we challenge the 104k — prior value acting as resistance.

Checking the trend change after the volatility period
Hello, traders.
If you "Follow", you can always get the latest information quickly.
Have a nice day today.
-------------------------------------
(BTCUSDT 1D chart)
This volatility period is expected to last from June 21st to 23rd.
Therefore, it is necessary to check the trend formed after the volatility period.
The 99705.62 point is the HA-High indicator point of the 1W chart, so it is important to see if there is support near this point.
If it falls without support, it may fall to around 89294.25.
The 89294.25 point is the HA-Low indicator point of the 1D chart.
Since the M-Signal indicator of the 1W chart is rising to around 99705.62, the area around 99705.62 is likely to play an important role as support and resistance.
Even if it turns upward, it must rise above the HA-High indicator point of 108316.90 of the 1D chart to maintain the price.
If not, it is likely to fall again.
-
The fact that the HA-High indicator was created means that it fell from the high point range.
In other words, if it falls below the HA-HIgh indicator point, it is likely to start a downtrend.
However, since the HA-High indicator is an intermediate value, if it is supported near the HA-High indicator, it is possible to show a stepwise upward trend.
The end point of the high point is the DOM (60) indicator.
Therefore, it should be interpreted that it has risen above the high point section only if it rises above the 111696.21 point.
Therefore, depending on how the 108316.90-111696.21 section is broken upward, an upward trend can be predicted.
----------------------------------------------------------------------
There are auxiliary indicators OBV indicators made of Low Line ~ High Line channels and PVT-MACD oscillator indicators.
The OBV indicator made of Low Line ~ High Line channels is an indicator that can see how the channel is structured, and whether OBV falls below the Low Line of the channel or rises above the High Line.
Therefore, you can predict the future trend based on the channel pattern.
-
The PVT-MACD oscillator indicator is an indicator created by adding the Close value dash PVT value to the MACD formula.
Therefore, it shows a similar appearance to the MACD oscillator indicator.
The reason for looking at the PVT-MACD oscillator indicator is to find out how the trading volume flows.
There are many trading volume indicators, but I think this PVT-MACD oscillator indicator reflects the trading volume flow well.
-
However, you should look at the support and resistance points where the changes in the movement of the PVT-MACD oscillator indicator, the OBV indicator created by the Low Line ~ High Line channel, and the StochRSI indicator occur.
If the changes in these indicators occur near the DOM(-60), HA-Low, HA-High, and DOM(60) indicator points, it can be of great help in creating a trading strategy.
The DOM(-60) indicator indicates the end point of the low point.
That is, falling below the DOM(-60) indicator means that it has entered the low point range, and there is a high possibility that it will show a full-scale downtrend.
The fact that the HA-Low indicator was created means that it has left the low point range.
That is, if it rises above the HA-Low indicator, it means that there is a high possibility that an uptrend will begin.
However, since the HA-Low indicator is an intermediate value, if it encounters resistance and falls, it is possible that it will show a stepwise downtrend.
Therefore, whether there is support in the DOM(-60) ~ HA-Low range is important.
-
Currently, the OBV indicator created as the Low Line ~ High Line channel has fallen below the Low Line.
Therefore, we need to look at whether the Low Line ~ High Line channel will change to a downtrend channel in the future.
We need to look at whether an 'M'-shaped pattern indicating a trend change occurs.
Since the PVT-MACD oscillator indicator is still below the 0 point, it can be seen that the selling force is dominant.
However, since the oscillator is maintaining an upward trend, you can see that the overall selling pressure is decreasing.
Even so, since it is located near the HA-High indicator, the resistance in the HA-High ~ DOM(60) section is expected to be considerable.
-
Support and resistance points should be drawn on the 1M, 1W, and 1D charts.
This will increase accuracy.
However, since the standard time frame chart for all indicators is a 1D chart, it is most important to check the flow of the 1D chart.
-
You may think it is difficult because you have to look at multiple indicators at once.
The most important thing is to look at the movement when approaching the HA-Low or HA-High indicator.
The reason is that the basic trading strategy is to buy near the HA-Low indicator and sell near the HA-High indicator.
-
Thank you for reading to the end.
I hope you have a successful transaction.
--------------------------------------------------
- Here is a description of the big picture.
(3-year bull market, 1-year bear market pattern)
I will explain more details when the bear market starts.
------------------------------------------------------

Crypto $TOTAL Market Cap Hopeful Weekly CloseWhat a wild close to the Week for the Crypto CRYPTOCAP:TOTAL Market Cap
Closed just above the 50% Gann level within the POI, but failed to close above the EMA9.
Strong bounce off the SMA20 still shows bull have some gas left in the tank, but I suspect we go lower with such a massive bearish candle on the week.
SMA50 is ~2.8T

Bitcoin Weekly, Not Good But... Opportunities AboundI cannot say about the weekly timeframe the same I said for the daily, the situation here is different. The chart looks bad. The weekly close changes nothing.
If Bitcoin moves and closes weekly above $106,000, this can be good news, but any trading below this level has bearish potential. It can be a period of bullish consolidation but the bearish potential cannot be ignored. So, I will keep it short. Bitcoin remains in doubt on the weekly timeframe.
Bullish above $100,000. Bearish below $100,000.
It has been six weeks with Bitcoin moving with basically no change.
Last week's action did produce some loses for some traders, but for us the market remains the same. We focus on the altcoins, ignore Bitcoin for now, there is no growth and the action is still happening near resistance; at short-term support but overall, closer to a top than a bottom. It is risky to say the least. Many altcoins are trading at bottom prices and growing strong. We go for the low risk vs high potential for reward chart setups. We don't mind the market shaking, evolving or reacting to some geopolitical event, we do care about making the right choices... Focus on the altcoins for now, and for long...
Hold on. I shall give you more information.
Bearish action is indeed present but still weak.
Bearish volume is very low.
The fact that more than 1B worth of leveraged positions were liquidated calls for a pause. Each and every time this amount of money is taken out of peoples hands and transferred to the exchanges, the market changes direction. Regardless of the signals, the bigger picture or the long-term. This is a huge transfer, the whales are getting richer, retail is getting rekt.
So, the market is likely to shake some more. This is only because Bitcoin is trading way too high and hasn't produced any significant retrace after considerable growth. Again, we buy those trading low near support. We sell those trading high near resistance. As long as this is the MO, we are sure to win in the long-run.
I wouldn't want to buy-long a project that is crashing when there are others growing, yet to grow and with huge potential for growth.
Remember, the market is big now, Bitcoin is very strong above 100K. It can happen that Bitcoin goes on a retrace while the altcoins move ahead. Money flowing out of the big projects reaches the smaller projects, classic bull market dynamic. Nothing surprising; opportunities are endless.
Thanks a lot for your continued support.
Namaste.

Bitcoin Daily Bearish: If 100K Breaks, 80KBitcoin being bearish is only true if the $100,000 support level breaks. If it breaks expect the market to dive down, deep and fast and reach around $82,500 or $88,888. But this is only if the support breaks. If support holds, as it is doing so far, then you can expect higher prices in the coming weeks. If support breaks, the flush is likely to be super fast and strong which means that you will still get higher prices in the coming weeks, so the conditions remain the same mid- to long-term, only the short-term is now in question. The bears are putting pressure on the market and many LONGs have been liquidated already.
It will be nice to see how it all develops, but it shouldn't take more than two weeks. We are likely in the clear in a matter of days (2-3 days). Do not be afraid if the market shakes, Bitcoin is going up; Crypto will grow, regardless of the short-term.
Namaste.

Bitcoin Break: Watch 100K Revesal Or Test Of 95K.Bitcoin broke 100K support without any type of retrace attempt (YET). This move which is attributed to global events should not be entirely surprising. Most importantly do not OVERREACT, especially with all the nonsense hype this will generate. Here is a more effective way to process the current situation.
Avoid bias and pay attention to the bigger picture. In terms of wave count, Bitcoin can technically retest the 85K area and STILL be considered within a broader Wave 4. This implies the broader structure is still BULLISH (Wave 1 overlap). A swing trade or investing buying opportunity can develop in the 95K area or lower (see illustration).
The short term momentum is bearish as per break of 100K. This should guide shorter time frame strategies like day trades. A new bearish trend line is in play (see arrow). At this point without any meaningful reversal pattern in play (4H or above) look for bearish continuation patterns like consolidations (triangles) inside bars, etc. The 95K support would be a price objective to consider if you are open to aggressive short strategies. Keep in mind, shorting into such a low is HIGHLY risky and best suited for those who have adequate experience.
This situation proves once again, "expert" opinions mean nothing. A few short weeks ago, Bitcoin was poised to break out and everyone was going to be rich again (remember the Bitcoin conference?). So much for that. The market does NOT care what you, me or Michael Saylor thinks. It reflects the perception of the future, whether or not that future plays out.
This is precisely why CHARTS can offer value in terms of measuring potential and RISK. You don't even need to be that technical, just take a look at the weekly time frame. The previous week's bearish pin bar low was broken signaling weakness, NOT Bitcoin 100 million K.
Thank you for considering my analysis and perspective.

BTCUSD CRACKing Everywhere!As I have been warning for a while now. See previous post.
I first warned to wait for the CRACK!
Then we got the 2nd CRACK!, very normal.
Then a nice M pattern with a lower high.
Then another CRACK!
And now a right Shoulder.
MAGIC!
Now we wait for the H&S to break down.
Click boost, follow, and subscribe for more. Let's get to 5,000 followers. ))

Perspective -- all basic indicators point DOWNI feel it's easy to get lost in what is happening NOW and forget what has happened OVERALL.
Zooming out to a weekly chart and using basic trading indicators, we can see where this is going.
Trading Volume: Low
Double Top: Confirmed
Elliot Pattern: Concluded
SMA50 & SMA100: Same setup as Dec 2021
Stochastic RSI: Turning bearish
First target: 92 - 93k range
Second target: 77 - 78k range
Third target: 33 - 34k range
I suspect a slight uptick at 93k, but not surprised if it breezes past this onto 78k.
Strange that anyone views this as a bulllish movement. This is a clear signal of a bearish market, and if altcoins follow then it'll be a full on crypto winter.

Bitcoin Short-Term Recovery Confirmed Bulls Win!Ranging markets/sideways markets is when traders lose the most money. Always keep this in mind.
» Short-term signals are pointing to a recovery right away.
» Bitcoin's drop wicked below the 13-June low but the RSI produced a higher low and thus we have a bullish divergence.
» Bitcoin's current drop went lower yet the chart reveals lower volume now compared to 13-June. This reveals weakness on the bear camp. This means a recovery will happen next, right away.
These are just a few signals but taken together with the altcoins analysis that I showed you and the bigger picture; Ha ha! The bulls win again.
Namaste.

$BTC Heading to the Long-Awaited 200DMA Retest ~$96kFULFILL THY PROPHECY 📖
CRYPTOCAP:BTC making its way down to the long-awaited 200DMA retest, which just so happens to show confluence with the .618 Fib level at $96k.
RSI shows a bit more room to the downside as well.
Make sure to get those bids in!

Bitcoin Daily Update June 22nd 2025Bitcoin daily chart:
🔻 Bearish Signals
1. Break of Rising Trendline:
The price has broken below the upward (orange) trendline, indicating a shift in momentum.
This trendline had previously acted as support, so the break suggests growing selling pressure.
2. Support Levels:
BTC is now hovering just above $99,634, which appears to be a key short-term support.
The next major support is around $93,363 — a break below that could open the door to mid $80K or even $71K (0.786 Fibonacci level).
3. Market Cipher Indicator (middle panel):
The momentum wave is clearly descending, and VWAP (green) is curving down.
The money flow (red) is negative.
Bearish dots and crosses are appearing.
4. Stochastic RSI (bottom panel):
Both %K and %D lines are dropping sharply below the 20 line, suggesting downside momentum is strong.
No sign of bottoming out yet.
🟡 Neutral/Bullish Watch Points
If BTC holds $99.6K and reclaims $100,115 or $104,616, it could neutralize or reverse this bearish setup.
RSI is not oversold yet, so room remains for further downside before any strong bounce.
📉 Summary:
BTC is currently bearish on the daily chart with:
Breakdown from an uptrend.
Weak momentum.
Declining oscillators.
Support tests underway.
If $99.6K fails, eyes shift to $93.3K, and below that, $86.5K–$71.9K as potential zones.
....
🔻 Primary Trade Setup (Bearish)
⚙️ Type: Short Position
⏰ Timeframe: Daily
📉 Strategy: Trendline break and momentum continuation
Entry:
Below $99,500 (confirmation of trendline breakdown & continuation)
Targets:
1. Target 1: $93,363 — Previous support level
2. Target 2: $86,500 — Next horizontal support
3. Target 3: $71,949 — Major 0.786 Fibonacci level (high confluence)
Stop-Loss:
Above $100,600 (to avoid fakeout wicks)
Or tighter: $100,150 (for smaller R:R)
Risk-to-Reward (R:R):
Entry: ~$99,500
SL: ~$100,600 → ~1.1% risk
TP1: ~$93,300 → ~6.2% reward
R:R ≈ 5.6:1 (to TP1) — solid risk profile
🔄 Alternate Plan (Bullish Reversal Setup)
⚙️ Type: Long Position (Only IF price reclaims broken levels)
If BTC reclaims $100,600 and closes above $104,616, trend could resume up.
Entry:
Break and daily close above $104,616
Targets:
1. $110,616 — recent resistance
2. $112,000 — psychological + historical zone
Stop-Loss:
Below $100,600
Invalidates upward breakout
📊 Indicators to Watch:
VWAP: Still pointing down (bearish bias)
Money Flow Index: Still in red (risk-off)
Stochastic RSI: Resetting near bottom — could support bounce later
Much love and appreciation,
– chevs710

Dollar's Decline: Global Economic ShiftsYou're probably wondering why I'm talking about the dollar on the Bitcoin chart. It's because I want you to look a few steps ahead.
That's why this post is for people like that.
1. Global Economic Transformations: Collapse of the Jamaican Monetary System
Insights and Logic:
We are witnessing the end of the Jamaican monetary system, established in 1976 following the collapse of the Bretton Woods system.
The Jamaican system's key feature is free (yet conditionally market-driven) exchange rates and the global dominance of the U.S. dollar.
For decades, the U.S. utilized the dollar's reserve currency status to finance budget and trade deficits without equivalent value returns—a beneficial "global tax."
Facts:
Currently, over 60% of global reserves are denominated in dollars (IMF data), but diversification is accelerating.
The U.S. is facing a "liquidity trap": to sustain markets, the Fed must print money, exacerbating inflation and weakening the dollar's global effectiveness.
Analogy:
Just as Nixon abolished the gold standard in 1971, we are now witnessing the abolition of the dollar's global standard—not abandoning the dollar as a reserve currency, but its monopoly.
2. Political Environment in the U.S.: Trump, Tariffs, and Managed Uncertainty
Insights:
Court decisions against Trump's tariffs are political tools, especially prior to congressional elections.
Democrats aren't just fighting for power—they systematically undermine Trump's economic policies in voters' eyes.
Systematic Explanation:
Virtually any presidential decree in the U.S. can be challenged legally. Lower-court decisions rarely withstand appeals, yet they create temporary buffers allowing policy adjustments.
This enables Trump to recalibrate his trade model systematically without losing face.
Conclusion:
The U.S. operates under "managed uncertainty," where seemingly chaotic political behaviors are structured adaptation mechanisms to global changes.
3. Mass Market and Sixth Technological Paradigm: NBIC as Foundation for Future Growth
Insights:
The future mass market will be built around NBIC technologies:
* Nano—new materials and sensors;
* Bio—biotech, genetic engineering, life extension;
* Info—digital platforms, neural networks, blockchain;
* Cogno—cognitive interfaces, AI, neural interfaces.
Historical Analogy:
Just as cars and mobile phones defined the mass market of the 20th century, longevity treatments, AI services, and neural devices will define the 21st century.
Facts:
Examples of current "false starts": Nvidia, Palantir, OpenAI—stock price volatility relates not to technology failures but premature valuation.
Forecast:
The next 20 years will see growth in new sectors, dominated by those capturing mass consumers, not just investors.
4. Digitalization and Geo-economics: Telegram, AI, and Control
Facts:
Telegram plans to integrate Grok neural network—a signal of the digital merger of communication, payment platforms, and behavioral analytics.
Insight:
Telegram as a future super-app: messaging, finance, AI assistance—all-in-one.
This is a media reset: traditional platforms like Bloomberg and CNBC lose influence to those controlling data flows directly.
Conclusion:
Information landscapes become automated—algorithms, not journalists, manage narratives.
5. **Europe: From "Progress Locomotive" to Stagnation and Subcontracting**
Facts:
Germany has been in recession for three consecutive years. The average age is 46.
Pension burdens and social standards make the economic model (Rhineland capitalism) unsustainable.
Ideological Crisis:
Europe is split into "transhumanist" (West) and "neoconservative" (East) factions.
The neoconservative revolution is gaining ground in Hungary, Poland, Slovakia, Romania, and even eastern Germany.
Conclusion:
Europe is skipping the sixth technological paradigm, becoming a "comfortable but uncompetitive" zone. Europe's "Japanification"—a path without acute crises but also without growth.
6. Future Growth Centers: Asia and the Global South with Risks
Facts and Locations:
Indonesia, Vietnam, Thailand—dynamic economies with high ROI and moderate political risks.
Philippines, Taiwan—potential proxy-conflict zones between the U.S. and China.
Logic:
Global capital moves towards higher returns rather than better living standards.
Asia becomes a new economic and geopolitical battleground similar to 20th-century Europe.
7. Role of Cryptocurrencies and USDT, USDC: Transition to Digital Dollar
Facts:
U.S. authorities view cryptocurrencies, especially USDT, as tools to reboot the dollar model.
USDT effectively integrates the dollar into the crypto economy, maintaining Treasury demand and allowing dollar exports outside the U.S.
Insights:
Unlike CBDCs, the U.S. digital dollar (via stablecoins) enables global expansion rather than local control.
The U.S. aims to lead the new monetary evolution—digital dominance instead of fiat.
8. Prospects in Latin America: Argentina, Mexico, and Risks
Argentina Analysis:
President Milei implements neoliberal reforms akin to Ukraine's: reduced state role and deregulation.
Possible outcomes: deindustrialization, increased poverty, export dependency.
Positives:
No war risks, resource-rich (oil, wine, food), good medicine and education standards (legacy).
Mexico:
High growth yet severe crime levels—excellent for business, risky for life.
9. Global Hybrid War Instead of a Third World War
Concept:
Not a "world war" but a global hybrid war: multiple power centers, proxy conflicts, shifting alliances.
Theaters of conflict: Asia (especially the South China Sea), potentially the Middle East and Africa.
Strategic Conclusion:
Avoid proxy countries; prefer "neutral dynamic" regions like Indonesia, Vietnam.
About DXY
I have been talking about the fall of the dollar index for a very long time.
September is coming soon
Best regards EXCAVO

BTC Loses Key Level — Will 100K Hold or Fold?Bitcoin has been locked in a range for the past 45 days, clinging above the critical psychological support at $100K. But cracks are starting to show…
Every bounce from the key level at $102,430 has been weakening — and now, for the first time, we’re breaking cleanly below it. Things are starting to tilt bearish.
So the question is…
⛏️ Will 100K be tested next?
🔍 Key Support Zone: $97.7K–$96.9K
Using the Fibonacci retracement from the swing low at $74.5K to the recent ATH, the 0.382 retracement lands at $97,655 — just below the $100K mark.
But there’s more…
Here’s why the zone between $97.7K and $96.9K is crucial:
0.382 Fibonacci retracement: A common pullback level in strong uptrends.
Anchored VWAP from $74.5K: Currently sitting around $96.9K, tracking cumulative volume-weighted average price — a key level.
Daily Order Block: Sits right at $96,887, aligning with the VWAP and reinforcing the area as demand-rich.
1.272 Fibonacci extension: From the previous move — providing another layer of confluence.
Fair Value Gap (FVG): The imbalance lies right in this zone. Price often fills these before continuing trend.
All of this stacks up to a high-probability long setup.
🕵️♂️ What to Do Now?
Set alerts at $100K and watch for a reaction. If price slices through, shift focus to the 0.382 Fib — monitor price action closely for signs of a reversal.
The first clean test of this zone could present a solid long — but as usual don’t trade blindly. Wait for confirmation.
_________________________________
💬 If you found this helpful, drop a like and comment!
Want breakdowns of other charts? Leave your requests below.

BTC is still bearish (2H)This analysis is an update of the analysis you see in the "Related publications" section
The red zone seems to have had enough orders to reject the price downward. It is expected that the price will drop at least to the green zone below.
There will be some fluctuations along the way.
A daily candle closing above the invalidation level would invalidate this analysis.
For risk management, please don't forget stop loss and capital management
Comment if you have any questions
Thank You

BITCOIN BEARISH SETUPBitcoin (BTC/USDT) – Breakdown from Double Top Confirms Bearish Trend Continuation
The 4-hour chart of BTC/USDT (Binance Perpetual Contracts) presents a textbook double top formation followed by a confirmed breakdown below structural support levels. The bearish trend has already met its first target, and technicals suggest the move could extend lower toward the key demand zone around $96,000.
🔍 Key Technical Highlights:
Double Top Pattern: Clear double top structure formed between $109,000–$110,000, followed by a strong rejection.
Support Break: Price broke down below key support at ~$105,000, triggering a sell-off and validating the bearish reversal.
Bearish Retest: After the breakdown, price retested the broken trendline (highlighted with a red zone) and failed to reclaim the range.
First Target Hit: Price achieved the first projected support zone at around $101,000.
Next Target: Based on measured move projection and previous structure, the next downside target lies near the $96,000 mark.
📉 Outlook:
The structure remains bearish as long as BTC trades below the broken support-turned-resistance zone (~$105,000). Momentum favors continued downside toward the next key zone unless a significant bullish reversal signal emerges.

BITCOIN BEARISH SETUPTechnical Analysis Summary:
Pattern Formation: The chart shows a descending triangle pattern with double tops, indicating bearish pressure at resistance levels.
Breakdown Confirmation: Price has broken below a key ascending trendline (shown in dashed line) and retested the breakdown area, forming a bearish rejection (highlighted red zone).
Key Zone: The price is currently trading around $105,075, just under the previous support-turned-resistance zone (~$106,000). This confirms a failed bullish structure and strengthens the bearish outlook.
Targets:
First Target: Around $101,000–102,000, aligning with the next visible support zone.
Second Target: Around $97,000–98,000, which is a major support / key zone based on prior structure.
Bias: Bearish in the short term, as long as price remains below the $106,000 resistance zone.
Trade Setup Outlook:
A short position is implied by the arrows.
Best entries are around retests near $105,500–106,000 with stops above the recent highs (~$107,000).
Conservative profit-taking at the first target, with extended TP near the key support zone.

BTC had break down the 4H trend line Time for long term shortTrend line had been broken down not only once but more than 1 time shows a strong bearish bias momentum with strong volume
Which confirmed by retest the resistance twice and failed to break it out and the pressure still on the downward momentum after several attempts to push higher and successfully pushed down-so set your short positions SL above 105,600 to avoid any wicks attempts
Entry 102,600. / 102,800
SL. 103,600
TP1 @. 101,220
TP2 @ 100,250
TP3 @ 99,550
Runners to hold if you wish 98,500
Wish for all best of luck and well managed Trade setup , enjoy the trend movment

BITCOIN → Possibility of retesting 100K. Buyer weakeningBINANCE:BTCUSDT.P is in consolidation after the rally stalled due to the exhaustion of the bullish driver. The price updates local lows and starts looking at 100K
Bitcoin is under pressure after the escalation of conflict in the middle east and after the FOMC speech. There is also another observation: large companies, politicians, funds and investors have long and aggressively motivate the crowd to buy, verbally confirming that they bought dozens and hundreds of bitcoins at a time for the balance, but bitcoin is standing still and updating lows. At the same time, various services such as "cryptorank" fix bullish sentiment at the lows. The market either lacks liquidity or something more unpredictable is happening (chart drawing????)
Technically, bitcoin is following the behavior of the SP500 quite strongly, which closes Friday's session quite weak and close to key support, which could trigger a continuation of the decline. Bitcoin won't stay on the sidelines and could also follow the index....
Resistance levels: 104K, 105K, 106K
Support levels: 102K, 100.6K, 97.5K
The price is coming out of the “symmetrical triangle” consolidation breaking the support, thus confirming the bearish mood. After a small correction after a false breakdown of 102500 the price may again return to storm (retest) the level under market pressure, which will only strengthen expectations of further decline. The target is liquidity 100600 - 100K. From 100K rebound and growth is possible.
Regards R. Linda!

BITCOIN Free Signal! Buy!
Hello,Traders!
BITCOIN is retesting a
Horizontal support level
Around 101,288$ from
Where we will be expecting
A local rebound so we can
Go long with the Take Profit
Of 104,324$ and the Stop
Loss of 100,300$
Buy!
Comment and subscribe to help us grow!
Check out other forecasts below too!
Disclosure: I am part of Trade Nation's Influencer program and receive a monthly fee for using their TradingView charts in my analysis.

bitcoin btc shortshort entry :107.300 , STOP LOSS: 108.400 , PROFIT TARGET 101.000
RR 1:5 BINANCE:BTCUSDT.P

$BTC correction: targets 101k, 97.5k, 94k, 87kThe hype is peaking — institutions, banks, Wall Street, and even governments are buying Bitcoin.
Yet despite the frenzy, BTC has been rejected three times around the $110K level and appears to be heading into another correction.
Bitcoin maximalists are pushing a strong FOMO narrative to attract retail investors, but several factors are pushing back:
- Psychological barrier: At these price levels, retail investors are hesitant. Owning just a "fraction" of a Bitcoin doesn’t appeal to the average person.
- Geopolitical tension: The conflict with Iran is serious. This isn’t a small, isolated country — Iran is a millennia-old civilization with global alliances. This situation won't resolve quickly or easily like Libya, Syria, or Iraq.
- Oil price surge: Escalating tensions could disrupt the Strait of Hormuz, a critical route for global oil. Western sanctions on Russia already strain supply — if Iran joins, where will Europe get its energy? U.S. supply won’t be enough. Expect a spike in inflation.
- Recession risks: Persistent inflation could drive a recession in the second half of the year.
- Trade wars & tariffs: No resolution, just chaos.
- Ukraine-Russia war: Still unresolved. Still draining global stability.
In short, the world is burning — and this is terrible for markets.
Bitcoin maximalists — some even selling company shares to buy more BTC — may soon face the harsh reality: Bitcoin needs a deeper flush before it can rally again. Retail won’t return until altseason clears the way and resets sentiment.
In a cycle dominated by propaganda, institutional manipulation, and global unrest, predictions are fragile. The only guide left: the chart.
Technically, we’re in correction mode again. Comparing with past cycles, potential pullback targets are:
$101K, $97.5K, $94K, $87K
There’s massive support at $74K, but it's unlikely we revisit it soon.
Stay cautious. DYOR.
#Bitcoin #CryptoMarket #BTCUpdate #Geopolitics #Altseason #CryptoCorrection #MacroView #CryptoFOMO #RiskAssets #DYOR