BTC (Daily) Elliot Wave 2 UnderwayBTC appears to have completed a motif wave (1) poking above all time high after printing a triangle for wave 4. Triangles are an ending pattern with a final thrust up afterwards typically breaking all time highs before reversing in wave 2, selling into retail FOMO.
Wave 2 has a $92k target at 0.5 Fibonacci retracement and high volume support node.
Wave 3 should be a powerful move up taking price way into all time high.
Safe trading
BTC-M

ETH/BTC vs btc dominanceethereum received a reaction as we expected from the current demand zone in the bitcoin pair, and it seems inevitable that the upward momentum from the current area will continue. on the bitcoin dominance side, the same situation exists, but I think we will witness a bearish absolute process.

BTCUSD - Bear Double Top ScenarioBitcoin is still above the ascending trend line in green however price is looking to form a next high reaching new ATH's
This could lead to resistance at the next top creating a double top, pushing price back down to the ascending trend line. From there if this strong trend line in green breaks it could turn very bearish below that line.
4Hr chart

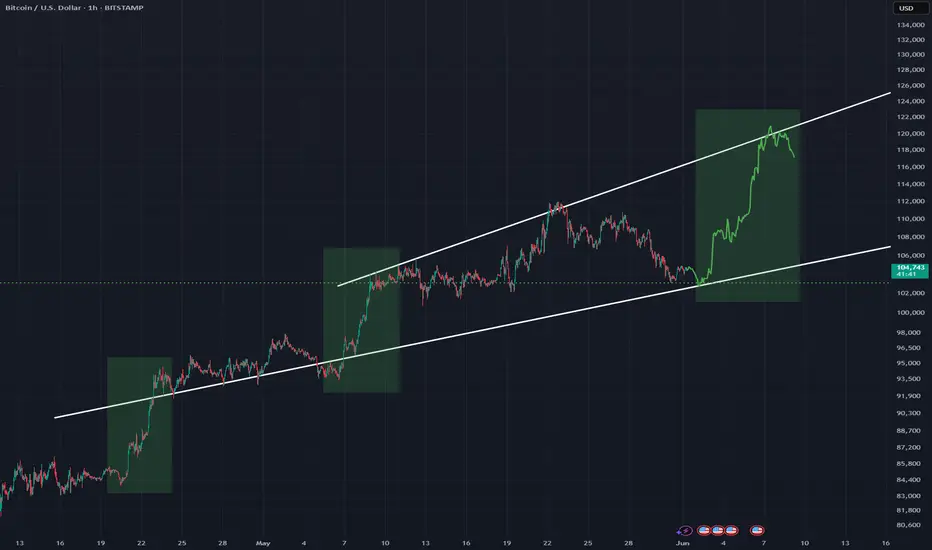
Bullish View #BTC Looking for a third strong wave up within this expanding pattern as price hits support in white
Moves up in green rectangles are similar
Hourly timeframe with the horizontal dotted line as a strong support line
Bitcoin Mixed: Below Resistance, Above Support (Altcoins Update)I hope you are having a good Saturday and weekend my dear friend, I have a quick update on Bitcoin and the Altcoins market today. Good news and bad news.
Let's start with the good news.
The Altcoins are producing a higher low and bullish. This means that we will continue to see growth as expected. The market went through a shakeout, nothing more.
On the Bitcoin side, we have the bad news which is not that bad.
The action is happening above support (grey dashed line on the chart) but below local resistance. The market just went through a major shakeout. I shall explain.
People got greedy and ended up putting too much leverage on their positions, when this happens, the market needs to balance things out because it cannot grow in this way long-term. And thus the shakeout. 1 billion dollars worth of LONGs were liquidated.
The good news is that once this process is over, the market can resume with its usual cycle but...
The situation is tricky now but I can tell you exactly what will happen. Bitcoin will consolidate before additional growth. While Bitcoin consolidates, the Altcoins will move up. Plan and simple.
What happens next with Bitcoin, down or up?
As long as Bitcoin trades above $100,000-$102,000 weekly/monthly the chart and market bias is considered ultra-bullish . This means that Bitcoin is ultra-bullish right now.
If the action moves and closes weekly below 100K, nothing happens. A simple retrace that ends in a higher low followed by additional growth.
The market is bullish now and will continue bullish.
The Altcoins are a good buy and this recent flush gives an opportunity for those that missed early prices.
Market conditions remain the same. We are bullish and set to grow long-term.
We are 100% bullish on Bitcoin and the Altcoins market.
Namaste.

Check support: Fibonacci ratio 1.902(101978.54) ~ 2(106178.85)
Hello, traders.
If you "Follow", you can always get the latest information quickly.
Have a nice day today.
-------------------------------------
(BTCUSDT 1M chart)
A new month begins.
The OBV indicator is currently rising again near the High Line.
We need to see if it can continue to rise by breaking above the High Line.
If not, there is a possibility of a decline near the Fibonacci ratio of 1.902 (101978.54) ~ 2 (106178.85).
If it declines with strong trading volume, there is a possibility of a decline near the StochRSI 20 point of 97209.25.
Therefore, we need to respond depending on whether there is support in the Fibonacci ratio of 1.902 (101978.54) ~ 2 (106178.85).
The most important support and resistance area on the current 1M chart is 69000-73499.86.
-
(1D chart)
It is showing a downward trend below the M-Signal indicator of the 1D chart.
Accordingly, the possibility of a short-term downtrend is increasing.
However, as mentioned earlier, the key is whether it can rise with support in the right Fibonacci ratio 1.902 (101978.54) ~ 2 (106178.85) section.
If not, it is likely to fall to around 97226.92.
-
The next volatility period is expected to be around June 6.
Accordingly, the current trend is likely to be maintained until the next volatility period.
In order to turn into an upward trend, the price must rise above the M-Signal indicator of the 1D chart and maintain it.
However, since the HA-High indicator is formed at the point of 108316.90, it is highly likely that the uptrend will begin only when it rises above this point.
Therefore, we need to check if it rises above 108316.90 and receives support.
-
In my chart, the basic trading strategy is to buy near the HA-Low indicator and sell near the HA-High indicator.
However, if it receives support from the HA-High indicator and rises, it is likely to show a stepwise uptrend, and if it receives resistance from the HA-Low indicator and falls, it is likely to show a stepwise downtrend.
The end of the stepwise uptrend is a downtrend, and the end of the stepwise downtrend is an uptrend.
Therefore, in order to establish a buying strategy, we need to meet the HA-Low indicator.
In other words, if the HA-Low indicator is newly created as the price falls, it is important to see whether there is support near it.
-
If it falls below the dotted line indicated on the OBV indicator, it will fall below the previous High Line, so there is a possibility that it will lead to an additional decline.
In particular, if it falls below the Low Line, the price is likely to fall.
However, since the channel of High Line ~ Low Line is still showing an upward trend, I think the overall movement is still maintaining an upward trend.
In order for the channel of High Line ~ Low Line to turn downward, it must fall to the area indicated by the arrow.
-
To summarize the above,
- Check for support in the right Fibonacci ratio 1.902(101978.54) ~ 2(106178.85) section
- The start of the uptrend is when the price rises above 108316.90 and maintains it
- Check for support near 97226.92 in the event of a further decline
- If the HA-Low indicator is newly generated in the event of a further decline, focus on finding the time to buy based on whether there is support near that area
-
Thank you for reading to the end.
I hope you have a successful trade.
--------------------------------------------------
- This is an explanation of the big picture.
(3-year bull market, 1-year bear market pattern)
I will explain more details when the bear market starts.
------------------------------------------------------

Bitcoin Monthly Outlook – Long-Term PerspectiveBitcoin Monthly Outlook – Long-Term Perspective
Regardless of the daily fundamental noise—ranging from institutional interest to global policy shifts—technical analysis also supports the possibility of further growth in Bitcoin over the long term.
Currently, Bitcoin remains in its primary bullish trend and is still moving within a rising channel structure.
Even if a pullback occurs toward the $39,000 level, the overall trend structure would remain intact, and the risk-to-reward ratio could still be considered favorable (approximately 4:1 in this context).
Of course, the market is driven by probabilities, and deeper corrections are always possible. However, both positive news and technical structure continue to signal a potential continuation of the upward movement.
📌 Based on this structure, key long-term support levels to watch are:
$70.000
$50,000
$40,000
📌 This analysis is for educational and informational purposes only and does not constitute financial advice.
📝 Follow for updates and long-term crypto insights.

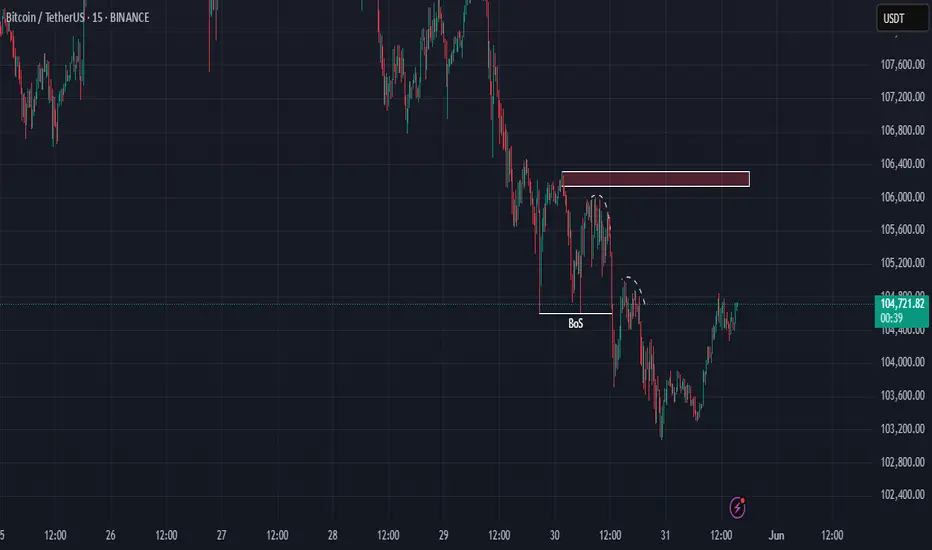
BTC/USDT: Correction to H1 Demand Zone? Multi-Timeframe Strategy🔹 H1 Context (Bullish):
- Demand zone (green) below Fib 0.5: Key support.
- Breakout (BOS) suggests bullish continuation *after possible correction*.
🔹 M5/M15 Situation (Short-Term):
- Price rejecting red zones (immediate resistance).
- Scenario 1 (Bearish):
→ If price respects red zones: Correction toward H1 demand ($103K).
→ Action: Short trades in M5/M15 targeting green zone.
- Scenario 2 (Bullish):
→ If red zones break: Confirmation of strength (new highs target).
🔹 Risk Management:
- Short entries: Rejection at M5/M15 red zones + M1 confirmation.
- TP: M15 lows ($103.5K) or H1 demand zone ($103K).
- SL: Close above red zones.
🔹 Technical Key:
- H2 Order Block as dynamic support: If respected, prevents drop to H1.
- Confluence: H1 demand + Fib 0.5 = High-probability area.
#BTC #Bitcoin #Trading #Crypto #H1 #M15 #TechnicalAnalysis #Fibonacci
BTC/USD 4h Char ReviewHello everyone, I invite you to review the current situation on BTC taking into account the 4-hour interval. We can see how the price is maintained just below the upward trend line, while a downward trend channel may be forming locally.
Here you can see how the price decline is maintained in a strong support zone from $ 105,000 to $ 103,150, however, if the support zone is broken, the price may quickly fall to the support area at $ 100,700
Looking the other way, you can see that when the trend reverses, we first have resistance at $ 106,560, the next is at $ 108,590, and then you can see very strong resistance at the level of the last ATH in the area of $ 112,000.
On the MACD indicator and the RSI indicator, you can see how we are maintaining in the lower part of the range, which indicates that the price bounce is still taking place to continue the growth.

SPELLUSDT Forming Bullish Falling WedgeSPELLUSDT is currently exhibiting a bullish falling wedge pattern, a formation that often precedes a significant upward breakout. The price has been gradually compressing between converging trendlines, and recent candles suggest growing bullish pressure near the wedge’s support. With a good volume profile backing this consolidation, the chart structure is lining up for a potential breakout that could yield a projected gain of 90% to 100% in the near term.
Spell Token (SPELL) powers the Abracadabra.money ecosystem, a DeFi lending protocol that allows users to borrow stablecoins using interest-bearing assets as collateral. As DeFi begins to regain traction in the broader crypto market, SPELL is drawing more investor attention due to its utility and role within a growing protocol. This resurgence in investor interest is aligning well with the technical setup, indicating strong potential for bullish price action.
Technically, a breakout from the falling wedge pattern with sustained volume could confirm the bullish reversal. Once the resistance line is breached, it may trigger an impulsive rally with minimal overhead resistance, creating an ideal scenario for swing traders and short-term investors targeting explosive moves. The projected upside from the current pattern breakout points toward levels not seen since previous local highs, reinforcing a bullish narrative.
In summary, SPELLUSDT is showing strong signs of a trend reversal with an ideal bullish chart pattern and healthy volume. The convergence of technical indicators, pattern formation, and growing market interest sets the stage for a potential high-reward setup in the coming weeks.
✅ Show your support by hitting the like button and
✅ Leaving a comment below! (What is You opinion about this Coin)
Your feedback and engagement keep me inspired to share more insightful market analysis with you!

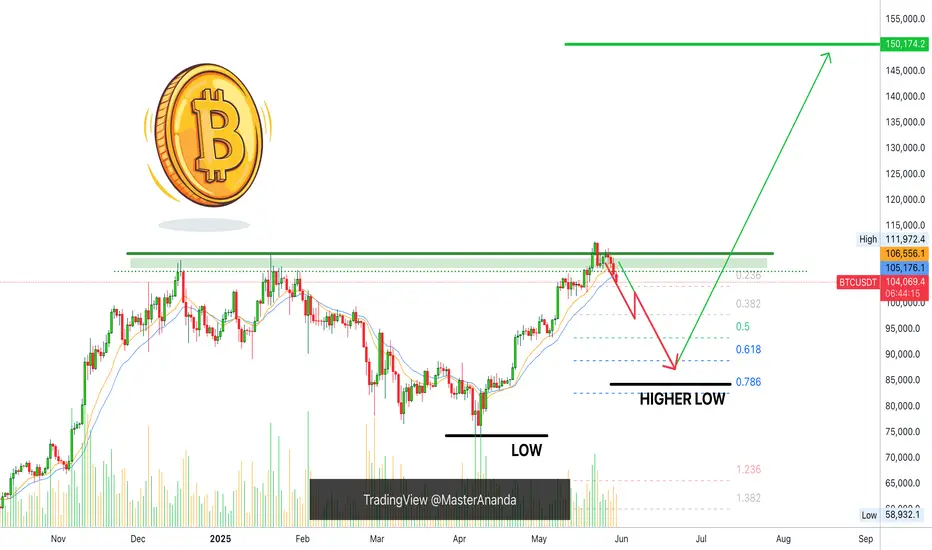
Bitcoin Bullish, Will Not Hit $200,000 This Cycle, $137,000 NextBitcoin is still bullish. A higher low is a bullish development. If Bitcoin stops bleeding at around a price of $88,888.88 this would be a strong, perfect, higher low compared to 7-April and it would match perfectly a classic correction because this price sits at the Fibonacci golden ratio.
Good afternoon my fellow Cryptocurrency trader, timing is important and we got perfect timing on this retrace. How far down will it go?
It is still too early to say but we know that below $74,500 isn't possible because that's the last low. $78,000 is possible but not necessary so we are betting that the lowest ever will be above $80,000. Remember, Bitcoin will never ever trade below $80,000 in its history. Sorry, but these prices are gone, nobody can buy this low again.
There is good news though. You can still buy when the next low is established.
It is impossible to predict the exact price when Bitcoin will stop dropping, but it is possible to see a support level being developed. So when the next support is in, we can cover (close the SHORT) and go LONG again.
Pretty simple. Buy when prices are low, sell when prices are high.
A new all-time high is pretty high and thus we sell (sold).
When the next support level is established, we buy again.
Thanks a lot for your continued support.
Each Altcoin needs to be considered individually because some will grow while others move down. We are more advanced now in this bull market cycle. You can visit my profile for more.
Namaste.
Maybe your biggest risk is your biggest chance !!!The price is currently forming the second corrective wave, and a slight price drop to reach higher levels is normal.
Give me some energy !!
✨We spend hours finding potential opportunities and writing useful ideas, we would be happy if you support us.
Best regards CobraVanguard.💚
_ _ _ _ __ _ _ _ _ _ _ _ _ _ _ _ _ _ _ _ _ _ _ _ _ _ _ _ _ _ _ _
✅Thank you, and for more ideas, hit ❤️Like❤️ and 🌟Follow🌟!
⚠️Things can change...
The markets are always changing and even with all these signals, the market changes tend to be strong and fast!!

BTC HTD Demand zones for longBTH HTF Demand Zone are marked,
when price hit these levels you can take long if you want,
trading is risky, Do-your-own-research, Follow risk management

Be careful with BTC !!!Finally, the price broke the wedge, and the price experienced a significant drop. I think is the time for btc to rise again to 111k after more correction . STRONG SUPPORT 98k
Give me some energy !!
✨We spend hours finding potential opportunities and writing useful ideas, we would be happy if you support us.
Best regards CobraVanguard.💚
_ _ _ _ __ _ _ _ _ _ _ _ _ _ _ _ _ _ _ _ _ _ _ _ _ _ _ _ _ _ _ _
✅Thank you, and for more ideas, hit ❤️Like❤️ and 🌟Follow🌟!
⚠️Things can change...
The markets are always changing and even with all these signals, the market changes tend to be strong and fast!!

BITCOIN - BEARISH MOVE !Hello Traders !
The Bitcoin failed to create a new higher high!
The price formed a descending triangle pattern.
Currently, the support level (106632 - 107332) is broken.
So, I expect a bearish move📉
________________
TARGET: 103170🎯

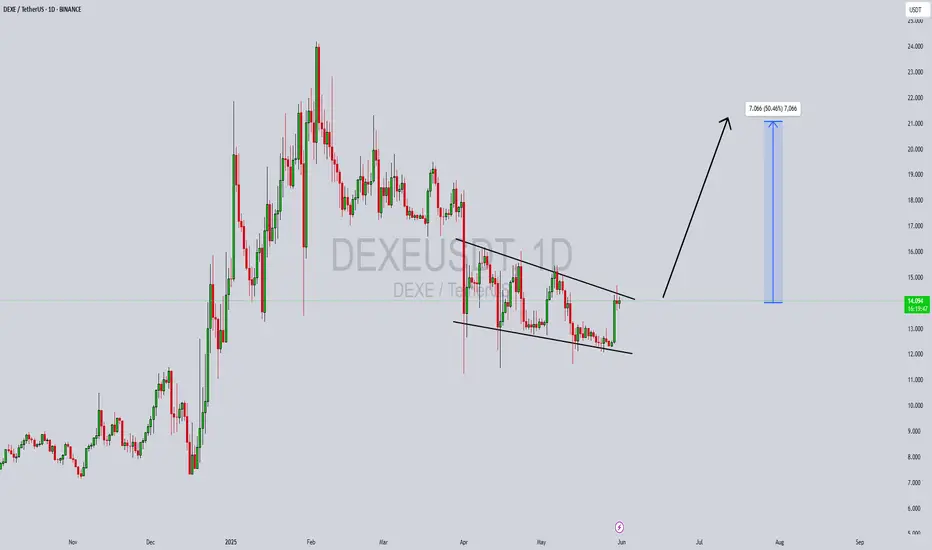
DEXEUSDT Forming a Bullish Wave DEXEUSDT is currently forming a bullish wave pattern, which indicates a strong continuation trend following a previous impulsive move. This technical formation, characterized by a series of higher highs and higher lows, reflects growing investor confidence and buying momentum. With good volume supporting the price structure, the likelihood of a breakout continuation is high, targeting an expected gain of 40% to 50% in the medium term.
DeXe (DEXE) has been gaining traction within the decentralized finance (DeFi) sector. As a governance and staking token for the DeXe network, it offers a unique proposition in decentralized asset and portfolio management. This aligns with the growing demand for transparency and user empowerment in financial decision-making, which enhances its fundamental appeal. The recent bullish wave setup complements this strong narrative, making DEXEUSDT a compelling asset on both technical and fundamental fronts.
From a chartist’s perspective, confirmation of this pattern with a breakout above recent swing highs could attract both momentum and position traders. Supporting indicators such as RSI trending upward and MACD crossover point to increasing bullish strength. The combination of technical alignment and rising on-chain activity for DEXE fuels a high-probability trade setup for bullish continuation.
In conclusion, DEXEUSDT is on the radar of many smart money traders looking to ride the next impulsive leg. If this bullish wave completes as anticipated, we could see significant upside in the coming weeks, especially as DeFi regains momentum across the crypto space.
✅ Show your support by hitting the like button and
✅ Leaving a comment below! (What is You opinion about this Coin)
Your feedback and engagement keep me inspired to share more insightful market analysis with you!
PHAUSDT Forming a Bullish Flag PatternPHAUSDT is currently displaying a classic bullish flag pattern on the daily chart, which is often considered a strong continuation signal in technical analysis. After a sharp upward move, the price has entered a consolidation phase within a descending channel—forming the "flag" portion of the pattern. With good volume backing the previous rally, this consolidation suggests that the bulls are simply taking a breather before the next leg higher. A breakout above the upper boundary of the flag could potentially trigger a 40% to 50% gain in the coming sessions.
From a market sentiment standpoint, PHA is gaining increased traction among crypto investors due to its underlying fundamentals and the growing use case of privacy-preserving technologies. As part of the Phala Network, which focuses on decentralized cloud computing with built-in privacy, the token has positioned itself well in the Web3 and privacy niche. This unique narrative is attracting more attention, and it reflects in the technical setup that's ripe for a breakout.
Traders should closely monitor the breakout zone near the flag's resistance. If PHAUSDT pushes through with strong volume confirmation, it could mark the beginning of a new bullish wave. Price action, along with volume spikes, RSI crossover, and MACD bullish alignment, further support this scenario. The potential risk-to-reward ratio favors strategic long entries for both swing traders and mid-term investors.
This pattern is a compelling opportunity for those looking to capitalize on breakout moves in trending altcoins. If market conditions remain favorable, PHAUSDT could easily exceed expectations, offering a solid gain for those positioned early.
✅ Show your support by hitting the like button and
✅ Leaving a comment below! (What is You opinion about this Coin)
Your feedback and engagement keep me inspired to share more insightful market analysis with you!

SEIHead and Shoulder Pattern is seen in the chart,
Breakout of Neckline will give a huge pump 🚀🚀🚀
Can grab some here 💰

BTCUSD - Short Term Bear MarketExpecting BTC to slow down to allow alts to catch up to this massive run
Once the bottom trend line is hit BTC will probably keep going
Small Correction
Weekly timeframe

BTC High Time Frame Bullish BATThere is Bullish BAT on the 4hr etc., lining up with the 200MA. Thank you

BTC/USDT Chart Analysis.
BTC has been in an uptrend since early April 2025, breaking above a strong horizontal resistance line (visible in the chart).
However, we can now observe a descending channel (falling wedge) after the peak, indicating a potential pullback.
Support Levels:
The price has tested the 50-day SMA (red) and is approaching the 200-day SMA (green), which is a strong dynamic support (around $94,740–$98,000).
Horizontal support lines are around the $103,000 and $100,000 levels, acting as immediate support.
Price Pattern:
The pattern resembles a bullish flag or descending wedge, suggesting a possible continuation of the previous upward move if a breakout occurs.
Before a bullish reversal, a retest of support levels (highlighted in the blue circle) near the moving averages is possible.
Future Path (as drawn on the chart):
Possible pullback to around $100,000–$98,000 levels.
Reversal and breakout are expected to be between $112,000 and $115,000 initially, and possibly higher to $125,000–$130,000.
Volume & Momentum:
No volume data is shown, but the price action indicates a correction with weakening momentum.
Trend lines are sloping upwards, indicating underlying strength despite the correction.
Trade Setup Based on This Analysis
Entry Zone: Around $100,000–$98,000 (if price tests support and forms reversal patterns like a bullish engulfing or hammer).
Stop-Loss: Below $94,000 (below the 200 SMA and the trendline support).
Short-Term Target: $112,000–$115,000.
Mid-Term Target: $125,000–$130,000.
Risk Considerations
If BTC breaks below the 200 SMA and horizontal support near $94,000, the trend may weaken.
Thanks for your support!
DYOR. NFA

Bitcoin's at ALL TIME HIGHS and I'm going ALL IN!!As Bitcoin surges to new all-time highs, I've made a pivotal decision: to stop saving in dollars and start holding Bitcoin.
Why Bitcoin? Self-Custody:
Owning Bitcoin means true ownership. With self-custody, I control my private keys, ensuring my wealth isn't subject to third-party risks like bank failures or government seizures.
Declining Dollar Value: The U.S. dollar continues to depreciate due to inflation and economic policies. Holding Bitcoin, a deflationary asset, offers a hedge against this erosion of purchasing power.
Global Accessibility: Bitcoin transcends borders, providing financial inclusion for anyone with internet access, especially in regions with unstable currencies.
Security and Privacy: With proper self-custody practices, my Bitcoin holdings are secure from hacks and offer enhanced privacy compared to traditional financial systems.
As I monitor the BTC/USD daily chart, the trend is clear: Bitcoin isn't just a speculative asset; it's a movement towards financial sovereignty.

Altseason is cancelled for now. But Should resume soon.If you're interested in altcoins, be sure to check out my ideas. I’m closely tracking CRYPTOCAP:BTC.D and CRYPTOCAP:OTHERS , and you’ll find plenty of valuable insights in those analyses.
So, what’s going on? My CRYPTOCAP:OTHERS prediction played out — May was bullish. But was it the real altseason? Not quite. The true altseason typically begins at the end of the Bitcoin cycle, and we’re not there yet.
Right now, we’re seeing price action reminiscent of December 2024. Bitcoin maximalists are aggressively buying BTC during a time it should be correcting, which is inflating BTC dominance and crushing any momentum for an altseason. They appear to be using altcoins as exit liquidity to pump BTC, especially as retail investors hesitate to buy Bitcoin above $100K.
What’s next?
The daily MACD suggests we’re entering a correction phase that could last around two weeks. A drop toward $1.2T is likely, as there's a major order block between the current level and that target. However, the real support lies below $900B — my "green box" — which I view as the ideal buy zone.
Historically, entries in this green box have offered 2x–3x returns on high-volatility altcoins from the top 100, especially in sectors like memes, DeFi, and AI.
I expect altcoins to correct into that zone in the coming weeks — keep an eye on it.
DYOR (Do Your Own Research).
#Crypto #Altcoins #Bitcoin #BTC #BTCdominance #Altseason #CryptoMarket #CryptoTrading #MACD #TechnicalAnalysis #DeFi #MemeCoins #AIcoins #AltcoinSeason #DYOR
