BitcoinATH 2017 (~$20K): The top of Bitcoin's 2017 bull market.
ATH 2021 (~$69K): The peak of the 2021 bull cycle.
These two ATHs are connected by a long-term diagonal resistance line, forming a key trendline.
Current Price (May 2025): ~$109,772 — Bitcoin is approaching this major trendline for a third time.
BTC-M

BTC/USD 4h Chart ReviewHello everyone, I invite you to review the current situation on BTC. When we enter the four-hour interval, we can see how the BTC price is moving in the upward trend channel, in which several upward waves can be marked, which may indicate the beginning of another wave of growth.
Here you can see how the current rebound has brought the movement closer to a strong resistance zone from $ 110,400 to $ 113,200, only breaking out of this zone on top can give the price an increase in the area of strong resistance at $ 121,000.
Looking the other way, you can see that when the trend reverses, we first have a support zone from $ 106,600 to $ 105,400, however, if this zone is broken, we can see a quick return of the price to the area of strong support at $ 102,000.
The RSI indicator shows how a support line was formed from which the indicator bounced many times, giving the price an increase, while the MACD indicator maintained the upward trend and created room for another upward movement when the price recovered.

BITCOIN → False breakout of 110K. Negative background???BINANCE:BTCUSDT.P hit a new all-time high of almost 112K on the back of improved economic and fundamental data, but the party didn't last long before Trump's next speech...
Yesterday, Trump spoke and announced new tariffs on the EU. The markets reacted quite aggressively to this news. Despite the fact that the market has practically bought back all the losses, the question itself remains open. The introduction of 50% tariffs on Europe will increase the risk background, which could trigger a fall in both the stock market and cryptocurrencies. In this case, money will flow into gold (a safe asset)...
Technically, Bitcoin is forming a false breakout of the global resistance level of 110K (previous ATH). The price is reacting and forming a bearish momentum (coinciding with the change in the fundamental background).
The area between 109.8 and 110.3 is a resistance and liquidity zone relative to the previous ATH. If the bears hold the resistance, Bitcoin may get stuck inside the 110K - 106.8K (105K) range.
Resistance levels: 109.8K, 110.3K, 112K
Support levels: 106.8K, 105K
Accordingly, if the 110K resistance holds amid the correction, consolidation below the resistance will confirm the formation of a false breakout, and in this case, Bitcoin may move to the 110K (112K) - 105K (102K) range. However, situations change daily, and if Bitcoin does break through 110K and manages to consolidate above its previous ATH, this will be a signal for growth...
Best regards, R. Linda!

Bitcoin Hits New All-Time Highs — Rally Targets $130K+Bullish Momentum Accelerates:
Bitcoin has reached new all-time highs, confirming a strongly bullish technical outlook. Accelerating upside momentum and growing investor confidence are driving the current rally.
Breakout Confirmation:
A decisive breakout from a broadening wedge pattern has unlocked potential targets in the $130,000–$135,000 range, signaling a likely continuation of the uptrend.
Key Support Levels:
With Bitcoin now trading well above $106,000, the previous resistance at $108,000 is expected to act as strong support during any pullbacks — providing a clear risk threshold for traders.
Favorable Risk-Reward Setup:
This alignment of:
Strong momentum
Completed consolidation
Successful breakout
...creates a compelling risk-reward scenario and reinforces the case for continued upside in the current bull cycle.
Bitcoin may just be getting started on its next leg higher. 🚀🔥
#Bitcoin #BTC #AllTimeHigh #Crypto #TechnicalAnalysis #Bullish #Breakout #MarketMomentum #CryptoTrading #CryptoMarket

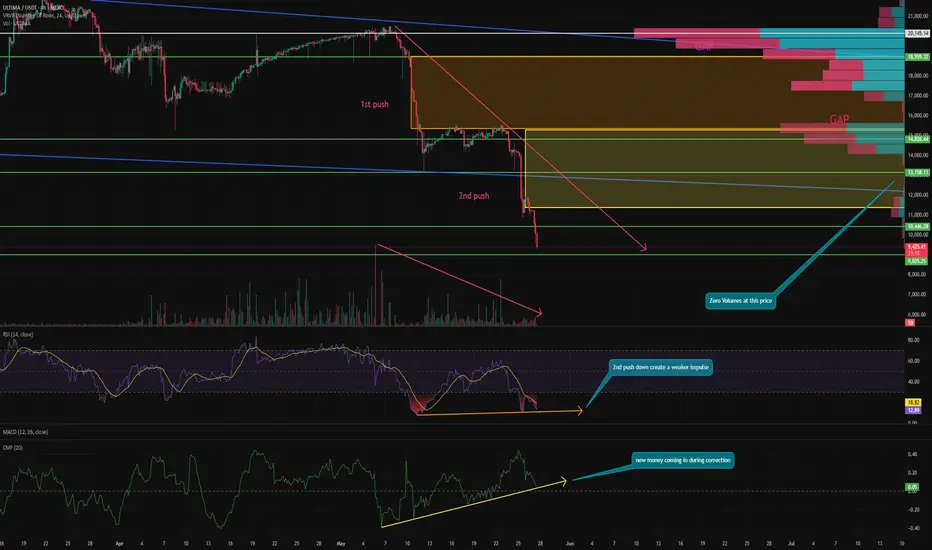
One of the MOST UNDERVALUED assets with huge POTENTIAL? ULTIMA continues its correction and by the looks of it, the end of the correction is getting closer.
⚡️ Let's see why I think there is a huge potential here in the short term.
The current correction is caused by the start of the token unlocking period after the freeze and many of them went straight to the market. However, they are not in a hurry to pay off yet.
Now, above are two huge GAPs. The first one is $11,400 - $15,320 and the second one is $15,400 - $19,000. As you know, GAPs are 99% of the time closed sooner or later. Especially such huge ones that leave behind such untraded areas.
📰 On every impulse, historically, there are 3-4 down pushes. Right now, ULTIMA has completed the second one. Not sure what the 4th will be, given what impulses were on the first two. So the next one (if there is one) could be the last and entail a BOS and a return to growth.
⚙️ Metrics and indicators:
Volume - the entire correction that started as early as $20,000 continues on lower selling volume, signaling seller exhaustion. Potentially signaling a rebound in the short term.
RSI - the second impulse was weaker than the first and a divergence was formed on the indicator chart. Which indicates a potential change of trend back to growth.
CMF - here is the most interesting thing. During the whole correction, fresh liquidity continues to enter the token. Also forming a divergence.
This indicates that holders continue to accumulate the coin. 🔥
VRVP - shows that at the price of $14,000, trading volumes have almost completely disappeared. The asset was probably overheated speculatively as it gave over 500% in a short period of time last year alone. And the current correction is landing gamblers with shoulders that obviously don't want to re-enter and go try their luck further.
Small volumes have started to appear in the $11,000 zone. Which, combined with the fact that we know we could be in for another downward momentum, is very correlative. After all, we are seeing more and more volume at a low price and the next impulse may just spark interest from those who have been waiting for a lower price for a long time.
📌Conclusion:
My first key point was $10,000. The next one will be $8,000. I don't expect a move below $6,000. But am buying at each key point so I don't miss the upside and average the position. Not trying to guess where the long awaited bottom is.
Bitcoin - Waiting for a clear breakout!About an hour ago, Bitcoin (BTC) managed to fully fill the 1-hour Fair Value Gap (FVG). After touching the upper boundary of this gap, the price reacted sharply and quickly reversed, which resulted in the formation of a Swing Failure Pattern (SFP).
What is a SFP?
A Swing Failure Pattern, or SFP, occurs when the price briefly moves above a previous high but fails to sustain that move. In this scenario, the price only sweeps above the previous high with a wick, but the candle does not close above it. This often signals that buyers could not maintain control, and it can lead to a reversal or a loss of momentum.
Narrow range
Currently, BTC is trading within a narrow range between 106,600 and 110,600. Within this range, the price is moving up and down without breaking out in either direction. On the 1-hour chart, BTC respected the FVG a few hours ago, which suggests that bullish momentum might still have a chance to develop.
Bullish breakout
For a bullish breakout, we would want to see BTC break above 111,000 with strong buying momentum. If this happens, the price could turn the current resistance into new support and potentially make a move toward the all-time high (ATH).
Bearish breakout
On the other hand, a bearish breakout would require the price to close below 106,600 with significant volume. If BTC closes below this level, the support could turn into resistance, and a drop toward 100,000 would become a real possibility.
Conclusion
In my view, BTC showed strength by holding the 1-hour FVG, but after the latest move upward, it failed to break through resistance and instead formed a SFP. Because of this, I expect a pullback toward 108,000 or even 106,000. At this stage, it’s best to be patient and wait for a clear breakout in either direction before making any major trading decisions. If you want to protect your capital, it’s wise to wait for confirmation before entering a new position.
Thanks for your support.
- Make sure to follow me so you don't miss out on the next analysis!
- Drop a like and leave a comment!

HolderStat┆BTCUSD stairway to New ATHCRYPTOCAP:BTC — Price action grinds up a steep ascending trendline, printing serial consolidation flags that keep bullish momentum intact. Holding 108-109 k support leaves room for a thrust toward the 115-118 k liquidity / new-ATH zone highlighted above. Breakout continuation, higher-highs narrative alive while the wedge floor protects the move.
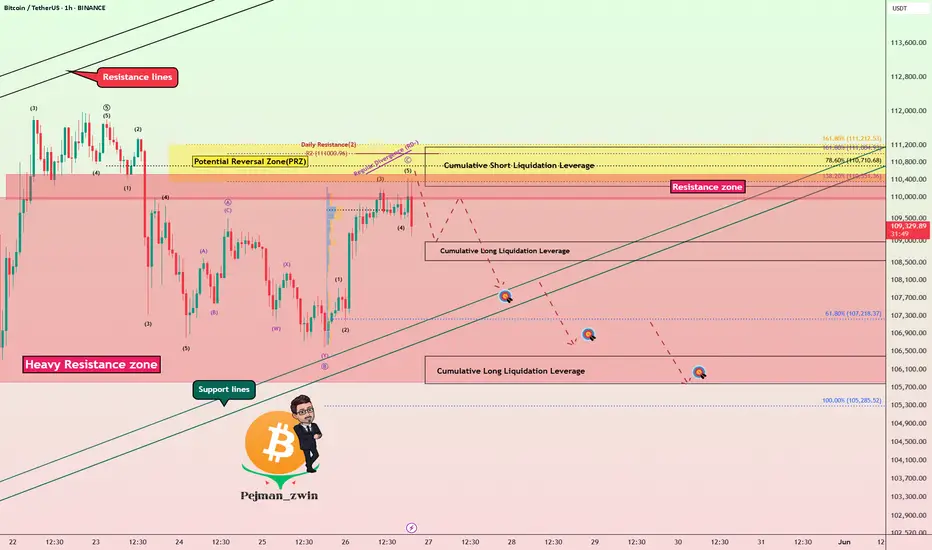
Bitcoin Bounce on Trump Tariff Delay – Short Setup Still Valid!Bitcoin ( BINANCE:BTCUSDT ) started to fall as I expected in the previous idea , and declined near the Support lines .
Bitcoin started pumping after the news that " US President Trump agreed to postpone 50% EU tariffs until July 9th ." Do you think this pumping of Bitcoin will continue?
Bitcoin is trading in a Heavy Resistance zone($110,000-$105,800) near the Potential Reversal Zone(PRZ) .
From the Elliott Wave theory perspective , Bitcoin appears to be in corrective waves , which is why I am labeling this idea as a ''Short''. The corrective waves structure is of the Expanding Flat(ABC/3-3-5) type.
I expect Bitcoin to attack the Support lines once again, and if these lines are broken, it will decline to the Targets I have indicated on the chart.
Notes :
MicroStrategy bought another 4,020 Bitcoins, but it didn't have much of an impact on the market.
If the Bitcoin price falls back below $109,000, about $185 million in long Bitcoin positions will be liquidated . = Attractive for exchanges
Bitcoin 2025 Conference to be Held in Las Vegas, Tuesday-Thursday = Could Cause Market Excitement .
Note: If Bitcoin touches $112,080, we should expect more pumping.
Please respect each other's ideas and express them politely if you agree or disagree.
Bitcoin Analyze (BTCUSDT), 1-hour time frame.
Be sure to follow the updated ideas.
Do not forget to put a Stop loss for your positions (For every position you want to open).
Please follow your strategy and updates; this is just my Idea, and I will gladly see your ideas in this post.
Please do not forget the ✅' like '✅ button 🙏😊 & Share it with your friends; thanks, and Trade safe.
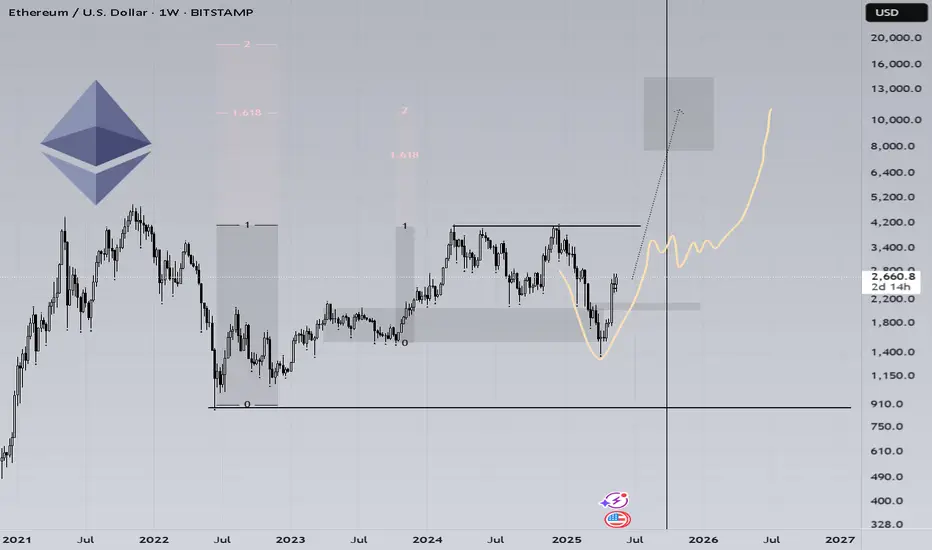
ETH 10 000$ soonAs for me, the fractial is the same)
Flashcrash in the preles of accumulation, the same good fast V-shaped reversal. BTC made 1.6 and 2 fib level, if copy paste it on ETH, it could be 10k$ easily. The dominance on the TOP, ETH/BTC on historical bottom. The cyclicality of the cryptocurrency market persists.
I would like to see June growth, going sideways at higher values closer to August. And starting in the fall to make the final movement.
Bitcoin (BTC/USDT) – Flag Breakout Points to $114KHello guys!
Bitcoin continues to respect the bullish structure within its ascending channel, and we just got a clean breakout from a textbook bull flag.
After a solid move higher earlier this month, BTC cooled off inside a tight flag pattern, consolidating above $106K. That pullback helped reset momentum, and now we’ve broken out with conviction.
You can read about it here:
We’re currently hovering around $ 109.8 K. A short-term retest of the breakout zone near $108K–$108.5K wouldn’t be surprising. it could even offer a great entry opportunity before the next leg up.
If momentum holds, the projected target from this flag pattern lands in the $113.5K–$114K zone.
watch these:
Support: $107.5K–$108.5K
Target: $114K
Invalidation: Break below $107K
Bias remains bullish unless we lose the channel structure.

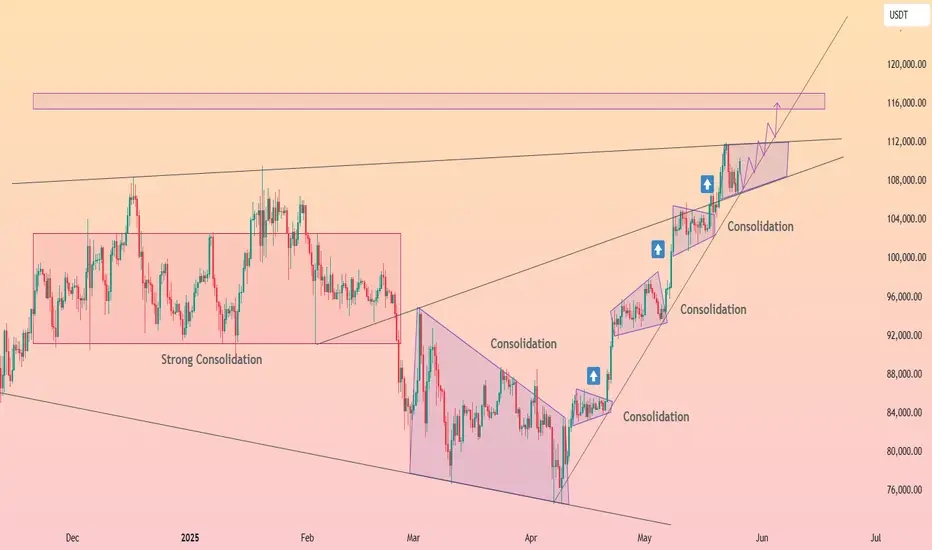
Bitcoin can continue to grow inside upward channelHello traders, I want share with you my opinion about Bitcoin. If we looks at this chart we can see how the price, after a healthy correction, the price started rising steadily within an upward channel. Along the way, price broke through the first key level and, after some consolidation, managed to overcome the second one as well. Currently, the price is trading just below the resistance line of the ascending channel. This structure shows that buyers remain in control, and bullish momentum is holding strong despite occasional pullbacks. The overall trend remains upward, and the asset respects the lower boundary of the channel as dynamic support. At the moment, I expect a minor downward move as a short-term correction. This would allow BTC to retest the local support area, strengthening the base before the next leg up. After that, I anticipate further growth, and a breakout toward the upper boundary of the channel is likely. That’s why my TP 1 is set at 115800 points - a potential new ATH aligned with the resistance line of the current structure. Please share this idea with your friends and click Boost 🚀

GBPUSD BULLISH OR BEARISH DETAILED ANALYSISGBPUSD has played out exactly as forecasted, completing a clean bullish leg from the Fibonacci confluence zones and breaking through the key 1.3430 resistance level. The structure remains strongly bullish, and after this minor retest, I’m anticipating another impulsive wave to the upside, with the next target sitting firmly at the 1.3900 level. The pair continues to respect both structure and momentum, showing consistent demand on dips.
Fundamentally, the British pound continues to gain strength backed by sticky inflation data and hawkish tone from the Bank of England. With UK CPI remaining elevated and core services inflation running hot, the BoE is being forced to hold its tightening bias. This contrasts sharply with the Federal Reserve, where recent data shows signs of softening labor markets and cooling price pressure, bringing rate cut expectations back on the table for the second half of 2025.
Technically, GBPUSD has cleanly respected all key fib levels from the previous correction. The breakout above 1.3430 has flipped structure into bullish continuation, and the market has already begun forming higher highs and higher lows on both daily and 4H timeframes. As long as price holds above the 1.3430–1.3450 retest zone, the bullish outlook remains intact with high-probability momentum toward 1.3900.
In current market sentiment, GBPUSD remains one of the strongest trending pairs, with institutions adding to long exposure as the dollar index weakens. As a professional trader, I remain long-biased and look to scale in on lower timeframe retracements. This is a textbook continuation play backed by both technicals and macro momentum. Let the trend work—bulls remain in full control.

HelenP. I Bitcoin will start to decline and break trend lineHi folks today I'm prepared for you Bitcoin analytics. Observing this chart, we can see how the price dropped from support 2, which coincided with the support zone and reached the trned line. Then it turned around and started to grow, and soon reached the 83700 support level again and even broke it. Next, price some time traded near this level and after a retest, it turned around and made an impulse up, after which it turned around and then declined to the trend line, after which it rose to support 1, which coincided with one more support zone. Soon, BTC broke the 101400 level and then repeated movement when it traded near the support 2 level. Price, after trading near the 101400 level, rebounded from the trend line and rose to new ARH 112000 points and then went into correction. At the moment, I expect that BTCUSDT will start to decline, break the trend line, and continue to fall to the support zone. That's why I set my goal near this area, at the 102700 points. If you like my analytics you may support me with your like/comment ❤️

BTC Dominance forecast until the end of August 2025It is a reversal now.
From now on until the end of August 2025 BTC.D will travel south. Downtrend will be in waves with major dates in the end of June and end of August 2025.
Major correction up will happen from 59.4% to 61.67%
The end of altseason will be at the level of 57.75%
Beware of major dates. Don't get driven away by profits, because the real fortunes are made in bear markets.
For more check my profile

BITCOIN repeating every Cycle's final rally!Bitcoin (BTCUSD) has been on a strong rally since the April 2025 bottom on the 1W MA50 (blue trend-line) and that's perfectly aligned with the 1W MA50 rebound it had on the previous two Cycles in June 2021 and June 2017.
As you can see, those (blue circles) where the All Time High (ATH) Pivot trend-line test before the final (parabolic) rally of the Cycle started, which was its most aggressive part.
In 2017 it was much stronger and the price rallied much higher, which is natural as the market was much less mature (institutionally) than today, but it is not improbable to get a rally similar to July - November 2021.
Can that be enough to push BTC to $150k and beyond? Feel free to let us know in the comments section below!
-------------------------------------------------------------------------------
** Please LIKE 👍, FOLLOW ✅, SHARE 🙌 and COMMENT ✍ if you enjoy this idea! Also share your ideas and charts in the comments section below! This is best way to keep it relevant, support us, keep the content here free and allow the idea to reach as many people as possible. **
-------------------------------------------------------------------------------
💸💸💸💸💸💸
👇 👇 👇 👇 👇 👇

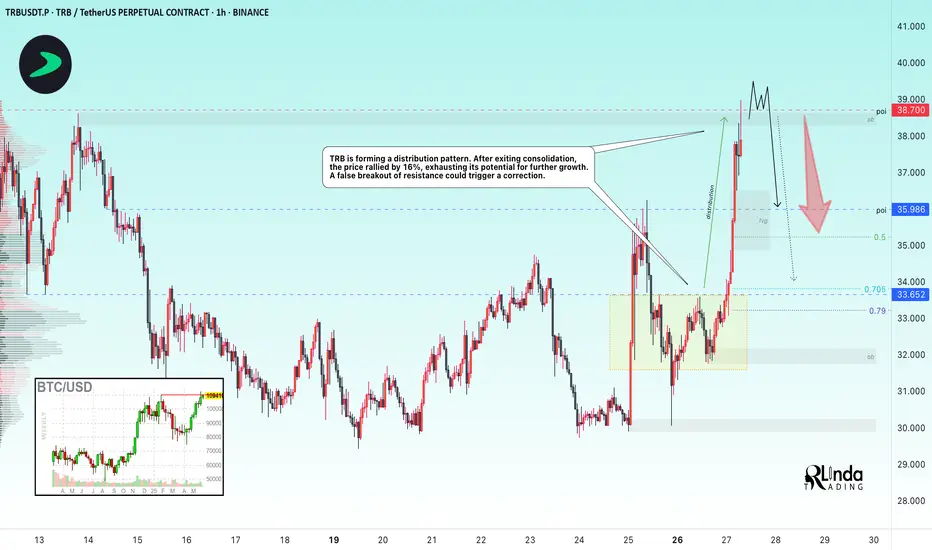
TRBUSDT → High probability of a false breakoutBINANCE:TRBUSDT.P is testing resistance in the 38,700 range as part of a rally. The current strong movement may end in a false breakout...
TRB is forming a distribution pattern. After exiting consolidation, the price rallied 16%, exhausting its potential for further growth.
A false breakout of resistance could trigger a correction.
Bitcoin looks controversial in the overall situation. After a false breakout of the 110K resistance, the price is consolidating below the level. If the flagship correction begins, it may also trigger a correction in altcoins...
Resistance levels: 38,700
Support levels: 35.98, 33.65
If the price fails to consolidate above the level and continue to rise, this will confirm the absence of bullish potential. A false breakout and price consolidation below 38.700 will trigger a correction to 36 - 33
Best regards, R. Linda!
Perfect Up —Mental TA, Predicting Bitcoin's price with your MindI get, I get it... You don't like it when I publish too many Bitcoin ideas.
You just don't like it when I continue to publish every single day. Since I love you and your continued support, I stopped publishing daily but I still get to publish ok? Ok!
Phew! I needed to get that stuff out of my system. All is good now thank you for reading more support and the comments about the TOP10 TOP Altcoins.
No bearish signals is a bullish signal.
Bullish signals are bullish signals.
Upgrade update improve mental programs. Bitcoin is not a mind but it was created through a mind. Everything starts first in the mind, think about it. You see? In order to conceive an idea or just to be able to grasp what I mean you have to think. Thinking happens in the mind right?
How does that sound for you?
Does it resonates with your thinking?
Makes sense?
If everything is in the mind and starts from a mind, a mind-point, then we can ask this same mind; where is Bitcoin headed next?
Information can come from three places only:
1) Your own individual conscious mind.
2) The personal unconscious.
3) The collective mind (the collective unconscious in CJung terminology).
If you mix your personal unconscious with the collective unconscious this can lead to mistakes. That's why some people get it right through intuition while others have it mixed. The problem is that information is mixed from the collective mind, your conscious mind and the personal unconscious. So you know that you know things that there is no way you can know. Sometimes you get it right and sometimes you get it wrong. The few times you get it right it is enough to confirm that the system is real and exist. When you get it wrong is because the information becomes mixed.
Lots of practice can solve this and you win.
Now that you've gained full access to your unconscious mind, ask the question, "Where is Bitcoin headed next."
Detach... Relax, do not interrupt just breathe and let the answer come in whatever way.
Practice, and based on the results you will know what's the meaning of the mental impressions you see.
Some people get it straight up. "Bitcoin is going up."
Some people get images of something positive and this needs to be interpreted. Other people hear sounds, others feelings, on and on.
» Technical analysis
The fact that Bitcoin continues rising moving up never down is as bullish as it gets. Remember, when there is a drop coming it drops, there is no in-between. When there is consolidation at resistance it means the bulls are in.
The bulls are in means the next major move is up. There can be swings short-term but ignore and bet on the bigger move. You know the next move is a rise, 100% confirmed, based on the chart, price action and candlestick, so you can always win betting on this move because it has the highest probability.
Bitcoin can't move any higher after hitting a top, think November 2021.
After hitting bottom, Bitcoin can only grow. The bottom was hit in early April.
Thanks a lot for your continued support.
Namaste.

BTCUSD: Urgently needs to break above this trendline!Bitcoin is bullish on its 1D technical outlook (RSI = 65.624, MACD = 4011.100, ADX = 25.476) but not overbought anymore as the aggressive weekly rallies since the 1W MA50 rebound have been decelerated. The next heavy obstacle is the HH trendline that runs on top of the January 20th 2025 and December 16th 2024 Highs and got hit last week. So far the price hasn't crossed above it but it needs to urgently in order to avoid a rejection with snowball effects.
The last time Bitcoin faced a similar HH trendline Resistance was on the October 23rd 2023 1W candle and it succesfully smashed through it, completing a +79.23% rise before consolidating again. If it breaks again above it, we expect the same minimum rally, which gives us a TP = 133,500.
## If you like our free content follow our profile to get more daily ideas. ##
## Comments and likes are greatly appreciated. ##

Bitcoin - This time different ?In 2021-22 bitcoin formed a higher high on weekly chart and then bear run of 2022 started, if we look at the bitcoin current chart the same pattern being formed.
Do you think bitcoin will form the similar pattern ? In my opinion it is highly unlikely that bitcoin will see similar pattern, in 2022 the second push was due to overall market euphoria which pushed the price to new high even though bear market was already on (Bitcoin hit new ATH after crashing 55% which is unusual)
If we look at the current pattern bitcoin had -30% crash, which is normal between bull runs, so its highly unlikely that bitcoin will similar fate as 2021.
Follow Our TradingView Account for More Technical Analysis Updates, | Like, Share and Comment Your thoughts.
Cheers
GreenCrypto

Bitcoin : Impulse up or Flat Trap!?If you find this information inspiring/helpful, please consider a boost and follow! Any questions or comments, please leave a comment!
BTC has staged a solid move off the May 25 low — but the context matters. We’re facing two distinct, high-stakes scenarios here: one bullish, one bearish. What happens next hinges on whether the May 25 rally is the start of a new impulse or the final leg (C wave) of an expanded flat off the all-time high.
Structure Breakdown
Bearish View: We’re completing a textbook expanded flat from the ATH:
A wave started May 23
B wave pushed to a lower low.
C wave began May 25 and is likely wrapping up now
If valid, this sets the stage for a powerful Wave 3 down.
Bullish View: The May 25 low marked the end of a corrective phase:
Rally from that low is an impulsive Wave 1
A pullback to the 108k golden zone would represent Wave 2
Wave 3/C up could follow from that base
What to Watch
The area around 108,000–107,100 is a magnet. If price retraces into this zone with a corrective look and holds, bulls could be in control. But if we roll over hard from here, it supports the expanded flat thesis — and a much deeper move likely follows.
Outlook
This is a moment for sharpen focus. The chart structure is clean, but the outcome isn't binary until we see what kind of retrace (if any) forms.
Watch 108k like a hawk. If bulls defend it, there’s room to talk new highs. If we break impulsively from here, expect acceleration lower — fast.
Trade safe, trade smart, trade clarity.

GBPJPY BULLISH OR BEARISH DETAILED ANALYSISGBPJPY has successfully broken out of a long-term descending trendline on the 3D timeframe, which had capped price action for months. The breakout is now confirmed with multiple candle closes above the trendline and a retest holding firm around 190.500. This shift in structure signals a major bullish reversal, and I’m now targeting the 199.600 level as the next potential upside objective.
From a fundamental perspective, the British pound is strengthening amid persistent inflationary pressures in the UK, which are keeping the Bank of England firmly in the hawkish camp. With CPI still elevated and wage growth remaining sticky, the BoE has little room to cut rates aggressively anytime soon. In contrast, the Bank of Japan continues to hold a dovish tone with ultra-accommodative monetary policy, offering a wide interest rate differential that favors GBP longs, especially in carry trade setups.
Technically, this setup offers a clean risk-reward profile. The breakout above the descending structure combined with a strong support zone around 190.500 gives this move a solid foundation. We’re seeing momentum build with higher highs and higher lows forming across multiple timeframes. As long as GBPJPY holds above the 190.000 zone, the bullish bias remains valid and the path toward 199.600 looks open and sustainable.
Traders should keep a close eye on short-term pullbacks as potential re-entry zones. With a macro tailwind behind GBP strength and continued JPY weakness, this pair is primed for further upside. I’m riding this bullish wave with a medium-term outlook and adjusting my position based on intraday market behavior.

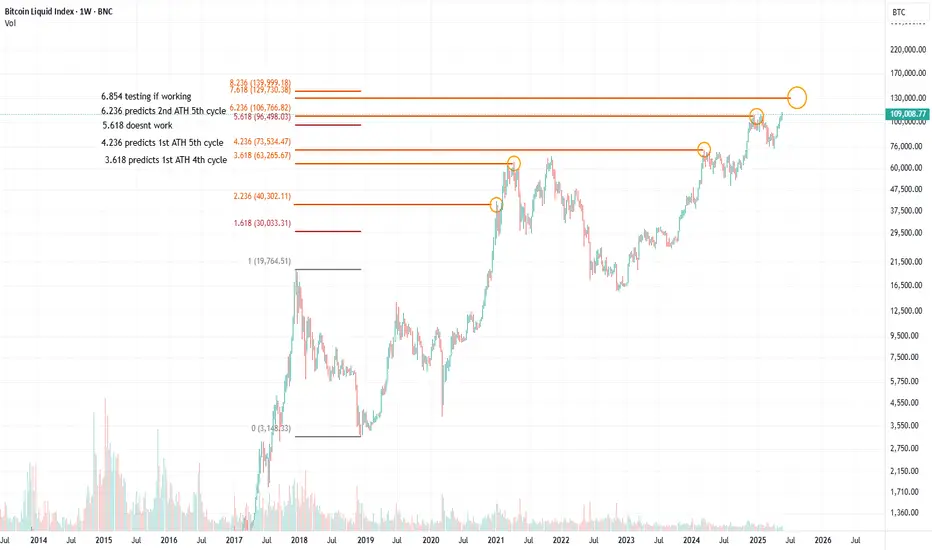
BITCOIN IS A SOLVED GAME. AND I SOLVED IT WITH 1 FIB PULLOne single fib pull to rule them all. From top to bottom in 2018 we can clearly see how many significant levels we get:
The 2.236 level gives us the first ATH in 2021. After that we face a 30% pullback.
The 3.618 level gives us the 63k top in 2021, again to the absolute dollar.
The 4.236 level gives us the first ATH of 2024, after which we faced 230+ days of sideway nothingness.
The 6.236 level gives us the exact ATH at the end of 2024
Following the logic of these numbers the next levels we should look for are: 7.618 and 8.236
BTC Crypto Futures Trade Plan 2025-05-26BTC Crypto Analysis Summary (2025-05-26)
Comprehensive Summary of Each Model
Grok/xAI Report
BTC at $109,553, trading above all major MAs (20/50/200 SMAs, 9/21 EMAs) → strong bullish trend RSI 67.02 (approaching overbought), MACD positive but slight bearish divergence Volume declining → possible consolidation or reduced buying interest Funding rate low (0.0002%) → not overleveraged long Trade suggested: long at $110,000, SL $107,000, TP1 $113,000, TP2 $115,000, size 1% equity, confidence 80%
Claude/Anthropic Report
Confirms price above all key MAs, RSI approaching overbought, MACD divergence Price near upper Bollinger Band → resistance Concludes short-term momentum weakening → moderately bearish bias Recommends no trade (confidence 72%), waits for break above $111,800 or below $105,000
Llama/Meta Report
Bullish MA alignment, RSI slightly overbought, price near upper BB Funding rate neutral, sentiment generally positive Trade suggested: long on pullback to SMA20 at $105,295.59, SL $103,000, TP $110,000, size = 2–3% equity, confidence 80%
Gemini/Google Report
Strong bullish trend (EMA9 > EMA21 > SMA20 > SMA50 > SMA200), RSI 67, BB upper ~$111,724 MACD bearish crossover → potential short-term pullback Recommends long at ~$109,550, SL $107,700, TP $113,100, size 1 BTC, confidence 75%
DeepSeek Report
Price near upper Bollinger Band, MACD bearish crossover, RSI divergence Countertrend short trade: entry $109,553, SL $111,725, TP $105,295, size 1 BTC, confidence 75% Areas of Agreement and Disagreement
Agreement
BTC is in a strong uptrend, trading above all major moving averages RSI ~67 suggests rising momentum but nearing overbought MACD shows a bearish divergence or crossover, warning of short-term momentum loss Price is close to the upper Bollinger Band → stretched conditions
Disagreement
Directional bias: Grok, Llama, and Gemini bullish; Claude is cautious/no-trade; DeepSeek bearish countertrend Entry levels: ranges from pullbacks to 105k (Llama) to market price ~109.55k (Gemini/Grok) Risk appetite: varying leverage and position-sizing recommendations Trade/no-trade: Claude advises holding; others recommend active positions Conclusion and Trade Recommendation
Overall Market Direction Consensus
Moderately Bullish: the dominant trend is up, supported by MA structure and recent performance, despite short-term momentum warnings.
Recommended Trade
Direction: Long BTC futures Entry Range: Near current market (109,500–109,600) or immediate retest of EMA9 (~109,550) Stop Loss: 107,700 (below EMA9 and minor support) Take Profit: 113,100 (just above recent swing highs/upper BB) Position Size: 1 BTC (adjust per account to risk ~1–2%) Confidence Level: 78%
Key Risks and Considerations
Momentum Divergence: MACD bearish crossover and RSI near overbought may trigger a pullback Volatility Spikes: leverage can amplify slippage and liquidation risk Broader Crypto Moves: altcoin correlation or market-wide news can quickly shift prices Funding Rate Shifts: a sudden spike could accelerate long-side liquidations
TRADE_DETAILS (JSON Format) { "instrument": "BTC", "direction": "long", "entry_price": 109550.0, "stop_loss": 107700.0, "take_profit": 113100.0, "size": 1, "confidence": 0.78, "entry_timing": "market_open" }
📊 TRADE DETAILS 📊 🎯 Instrument: BTC 📈 Direction: LONG 💰 Entry Price: 109550.0 🛑 Stop Loss: 107700.0 🎯 Take Profit: 113100.0 📊 Size: 1 💪 Confidence: 78% ⏰ Entry Timing: market_open
Disclaimer: This newsletter is not trading or investment advice but for general informational purposes only. This newsletter represents my personal opinions based on proprietary research which I am sharing publicly as my personal blog. Futures, stocks, and options trading of any kind involves a lot of risk. No guarantee of any profit whatsoever is made. In fact, you may lose everything you have. So be very careful. I guarantee no profit whatsoever, You assume the entire cost and risk of any trading or investing activities you choose to undertake. You are solely responsible for making your own investment decisions. Owners/authors of this newsletter, its representatives, its principals, its moderators, and its members, are NOT registered as securities broker-dealers or investment advisors either with the U.S. Securities and Exchange Commission, CFTC, or with any other securities/regulatory authority. Consult with a registered investment advisor, broker-dealer, and/or financial advisor. By reading and using this newsletter or any of my publications, you are agreeing to these terms. Any screenshots used here are courtesy of TradingView. I am just an end user with no affiliations with them. Information and quotes shared in this blog can be 100% wrong. Markets are risky and can go to 0 at any time. Furthermore, you will not share or copy any content in this blog as it is the authors' IP. By reading this blog, you accept these terms of conditions and acknowledge I am sharing this blog as my personal trading journal, nothing more.
