Bitcoin's Market Cycles — Are We Nearing the Top?Bitcoin is approaching a critical moment and the signs are everywhere.
After more than 900 days of steady bull market growth, BTC now flirts with all-time highs (ATH) while momentum stalls, liquidity thins, and emotions run hot. You might be asking:
Are we nearing the cycle top?
Is now the time to de-risk or double down?
What comes next?
This isn’t just a question of price. It’s about timing, structure, and psychology.
In this analysis, we’ll break down Bitcoin’s historical cycles, the current macro structure, the hidden signals from Fibonacci time extensions, and how to think like a professional when the crowd is chasing FOMO.
Let’s dive in.
📚 Educational Insight: Understanding Bitcoin Cycles
Bitcoin doesn’t move in straight lines, it moves in cycles.
Bull markets grow slowly, then explode. Bear markets fall fast, then grind sideways. These rhythms are driven by halving events, liquidity expansions, and most importantly: human emotion.
Here’s what history tells us:
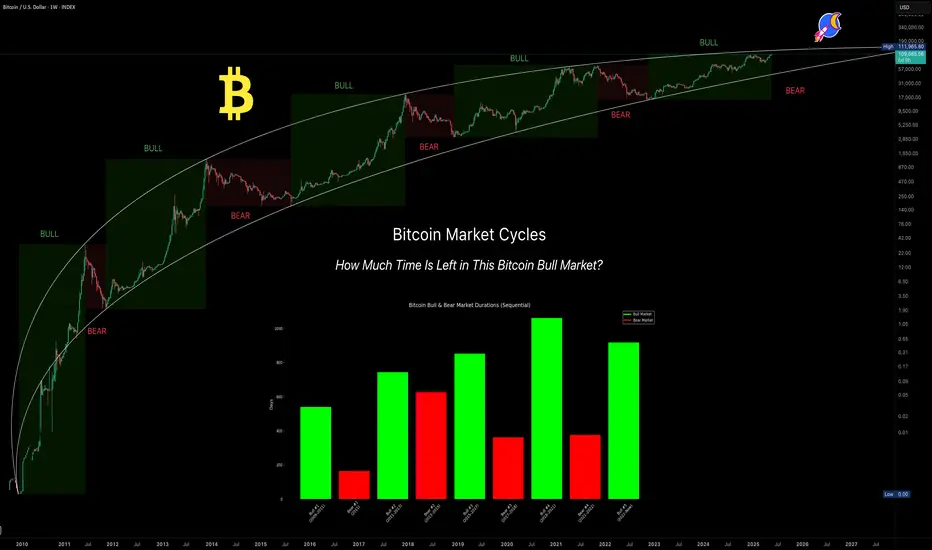
Historical Bull Markets:
2009–2011: 540 days (+5,189,598%)
2011–2013: 743 days (+62,086%)
2015–2017: 852 days (+12,125%)
2018–2021: 1061 days (+2,108%)
2022–Present: 917 days so far (+623%)
Bear Market Durations:
2011: 164 days (-93.73%)
2013–2015: 627 days (-86.96%)
2017–2018: 362 days (-84.22%)
2021–2022: 376 days (-77.57%)
💡 What does this tell us?
Bull markets are growing longer, while bear markets have remained consistently brutal. The current cycle has already surpassed the average bull run length of 885 days (cycles #2–#4) and is quickly approaching the 957-day average of the two most recent cycles (#3 and #4). That makes this the second-longest bull market in Bitcoin’s history.
⏳ 1:1 Fibonacci Time Extension — The Hidden Timing Signal
In time-based Fibonacci analysis, the 1.0 (1:1) extension means one simple thing: this cycle has now lasted the same amount of time as previous cycles — a perfect time symmetry.
Here’s how I measured it:
Average bull market length #2–#4(2011–2021): 885 days
Average bull market length #3–#4(2015–2021): 957 days
Today’s date: May 27, 2025 = Day 917
✅ Result: We are well inside the time window where Bitcoin historically tops out.
You don’t need to be a fortune teller to see that this is a zone of caution. Markets peak on euphoria, not logic and this timing confluence is a red flag worth watching.
🗓️ "Sell in May and Go Away" — Not Just a Meme
One of the oldest market adages is showing its teeth again.
Risk assets — including Bitcoin — tend to underperform in the summer months. Why?
Lower liquidity
Institutional rebalancing
Exhaustion from prior run-ups
Vacations and reduced trading volumes
And here we are:
Bitcoin is hovering near ATH
It's been in an uptrend for 917 days
We just entered the time-extension top zone
Liquidity is thinning across the board
You don’t need to panic. But you do need to think like a professional: secure profits, reduce exposure, and wait for structure.
😬 FOMO Is a Portfolio Killer
This is where most traders make their worst decisions.
FOMO (Fear of Missing Out) isn’t just a meme — it’s the reason so many people buy tops and sell bottoms.
Before entering any trade right now, ask yourself:
Where were you at $20K?
Did you have a plan?
Or are you reacting to headlines?
📌 Clear mind > urgent clicks
📌 Patience > chasing green candles
📌 Strategy > emotion
Let the herd FOMO in. You protect your capital.
Will This Bear Market Be Different?
Every past cycle saw BTC retrace between 77%–94%. That was then. But this time feels… different.
Here’s why:
Institutions are here — ETF flows, sovereign wealth funds, and major asset managers
Regulation is clearer — and risk capital feels safer deploying in crypto
Supply is tighter — much of BTC is now held off exchanges and in cold storage
While a massive crash like -80% is less likely, that doesn’t mean a correction isn’t coming. Even a 30%–40% drop from here would wreak havoc on overleveraged traders.
And that brings us to…
🚨 Altseason? Or Alt-bloodbath?
Here’s the hard truth:
If BTC corrects, altcoins will crash — not rally.
Most altcoins have already seen strong rallies from their cycle lows. But if BTC drops 30%, many alts could tumble 50–80%.
Altseason only happens when BTC cools off and ranges — not when it dumps. Don’t get caught holding the bag. Be tactical. Be disciplined.
So Where’s the Next Big Level?
You may be wondering: “If this is the top… where do we fall to?”
Let’s just say there’s a very important Fibonacci confluence aligning with several other key indicators. I’ll reveal it in my next analysis, so stay tuned.
🧭 What Should You Do Right Now? (Not Financial Advice)
✅ Up big? — Take some profits
✅ On the sidelines? — Wait for real setups
✅ Emotional? — Unplug, reassess
✅ Are you new to Trading? — study, learn (how to day trade) and prepare for the next cycle
The best trades come to the calm, not the impulsive.
💡 Final Words of Wisdom
Bitcoin rewards discipline. It punishes emotion.
Right now is not about catching the last 10% of upside — it’s about:
Watching structure for potential trend change
Measuring risk
Avoiding overexposure
Protecting what you’ve earned
📌 The edge isn’t in indicators. It’s in mindset. Stay prepared, stay sharp because in this market…
🔔 Remember: The market will always be there. Your capital won’t — unless you protect it.
The next big opportunity doesn’t go to the loudest.
It goes to the most ready.
_________________________________
Thanks for reading and following along! 🙏
Now the big question remains: Is a bear market just lurking around the corner?
What are your thoughts? Let me know in the comments. I’d love to hear your perspective.
_________________________________
If you found this helpful, leave a like and comment below! Got requests for the next technical analysis? Let me know.
BTC-M
Bitcoin's upward movement continuesThe upward movement that Bitcoin started at $74,550 has many similarities between its waves. Considering the similarity in price and the large time between waves A-C-E-G and waves B-D-F, it is clear that a diametric or symmetrical is forming.
Considering that the post-pattern movement after the g-wave has not passed, there are two scenarios:
1- Formation of an x-wave after the diametric
2- Formation of a symmetrical
However, considering that the post-pattern movement after the g-wave has not been confirmed and the high similarity in price in all waves, my opinion is that a symmetrical is forming and we will have another upward wave. This upward wave could end at $115,500 or $123,000.
Good luck
NEoWave Chart

Accumulate waiting for the next new ATH, BTC 💎 Update Plan BTC (May 26)
Notable news about BTC:
Bitcoin (BTC) is trading above $109,000 as of Monday, staging a solid rebound after Friday’s sharp pullback. The recovery has been largely driven by renewed optimism following US President Donald Trump’s decision to postpone the implementation of a 50% tariff on European Union imports. This move helped calm market jitters and reignited investor appetite for risk assets, including digital currencies.
Institutional interest in Bitcoin also appears to be gaining momentum, with the latest data showing the strongest weekly inflows since late April—an encouraging sign that confidence in the asset remains resilient despite recent volatility.
Trump’s tariff delay spurs BTC bounce
In a post on his Truth Social platform, President Trump announced an extension of the EU tariff deadline to July 9, backing away from the previously scheduled June 1 hike. This announcement came just days after he criticized the lack of progress in negotiations with Brussels, which had rattled markets and led to a 3.9% drop in BTC on Friday. The policy reversal helped restore calm and provided a tailwind for Bitcoin’s upward move to start the week.
Technical analysis angle
The question that investors most interested now is when BTC will have 120k?
Congratulations to the investors. BTC goes on our analysis. Although the price is sideways, we still earn 3000 prices from this coin.
Note that the 113k region can be an important price area for adjustment before 120k and even higher
🔥BTC 4H is currently in the adjustment phase, this time will cause a lot of traders, Future - Margin to lose money, this rhythm will last long
At this time, whether new or old, should spend more time to practice, load more knowledge about the PTKT, as well as find knowledge posts at the channel ..., to strengthen the solid foundation, as well as avoid losing money at this time offline
==> Comments for trend reference. Wishing investors successfully trading

Last. Chance yo meet profit. (EURUSD)
Trade Idea (Short-Term Setup):
1. Sell Setup (Short-term correction - Wave 4)
Entry: Near current price (1.13730), especially if bearish confirmation appears on a lower timeframe (like bearish engulfing, break of structure).
Target: Bullish OB zone around 1.12910–1.12867.
Stop Loss: Just above the recent high or red zone (~1.14127).
Risk-Reward: Looks favorable (~1:2 or more).

26/05/25 Weekly OutlookLast weeks high: $111,965.73
Last weeks low: $101,994.78
Midpoint: $106,980.26
New BTC ATHs! Well done to those who capitalized on the move and continue to believe in this Bitcoin.
For the last two weekly outlooks I have talked about the pattern of consolidation for 1 week --> expansion the next. Last week We got our expansion week right on queue and this time around BTC made a new ATH hitting just shy of $112,000.
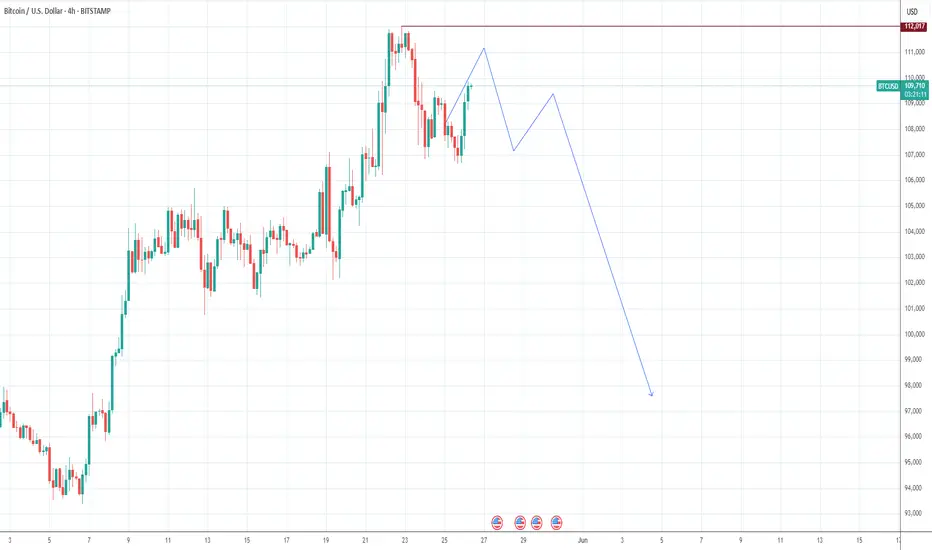
Should the pattern continue this week will be a week of consolidation/chop, however this week is different now that we're at ATH levels. My gut says a pullback is coming after such an aggressive move up with almost no pullbacks at all.
Should BTCs price drop below the Midpoint I think there will be a big struggle to continue this rally in the short term. Initially target would be weekly low and main HTF target would be $97,000 IMO. That would be a healthy pullback to continue the rally.
For the bulls you don't want momentum to stop in the short term, flipping $110,450 and weekly high would put BTC back into price discovery, once any asset is in price discovery it's very difficult to tell where the sell pressure will come from and so shorting becomes very risky.

Daily BTC OverviewThe daily chart in its simplest form can be broken down into this range. Since President Trumps inauguration, BTC has declined from a range high of $108,000 back to the lows of $74,500 closing the FVG caused by the US election rally. After a double bottom Bitcoin mean reverted back to the range midpoint which to me is the most important area on the entire chart because it decides if the bull run can continue or if it dies.
I like to keep a close eye on the 200 EMA on multiple timeframes but the 1D is important to gauge the momentum of the move. As the US election results came in a massive push away from this moving average causes the level to steepen in its climb showing strength. Since BTC spent quite some time in the top half of the range the 1D 200 EMA flattens out signaling a loss of momentum, once this level does become flat it no longer provides support. For a bullish cycle to be just that ideally the corrective moves do not spend too much time below this level before expanding above and beyond it once again starting the next leg of the move. A persistent move down below causes a rollover and the cycle looks to be over with a bear market beginning.
Bullish scenario - The correction is over and BTC consistently posts HH's & HLs bringing the 1D 200 EMA up with price and continues the previous bullish trend. I would want to see the retest of the midpoint be successful and then move to reclaim the next local high before targeting range high. The bull market correction looks to be over and bullish continuation resumes.
Bearish scenario - This move is nothing more than a LH, BTC wicks the supply above midpoint, swing fails back under and continues to make LH's & LL's back down to range low where the 1D 200EMA will have now rolled over providing more of a resistance level. The bear market looks to have begun.
I am not here to make a call on where BTC is going next as I do not have that answer, but I do have to plan for each eventuality and that is what I have done here from a TA pint of view. Now it is entirely possible that Geo-political news or an exchange hack etc throws TA out of the window and I have to rethink the plan but in a strictly chart structure perspective this is how I see it.
The indicator "TRADING ENVIRONMENT+V1.0" used in the Idea post is now publicly available for use, give it a try and leave your thoughts and suggestions on the post, thank you.

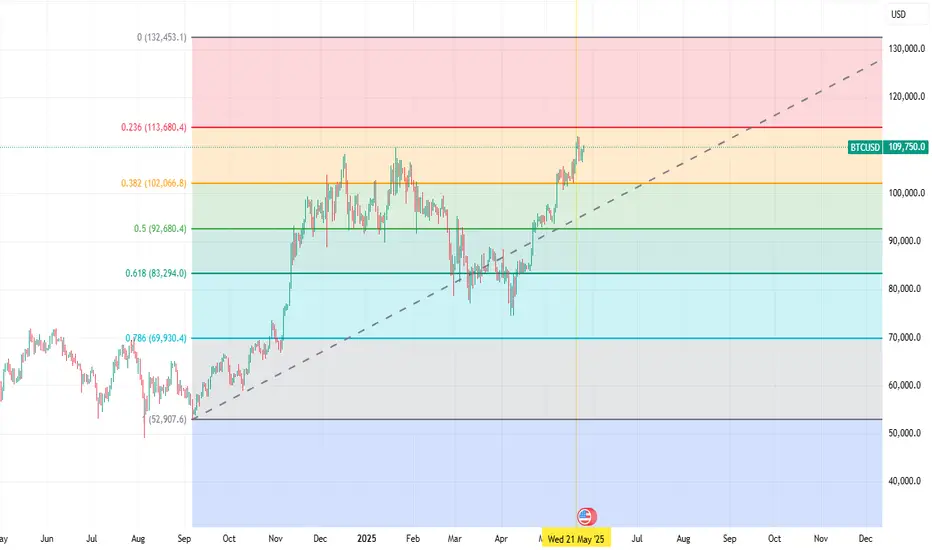
BTC could cross 132k in June to July 2025BTC is above moving average of 50 and 200 on day time frame. recently it made golden cross. It is expected that it will cross key level of 113,680 and 132,453 level within 2 months.
BITCOIN $119k coming shortlyBitcoin (BTCUSD) has been trading within a 6-week Channel Up and Friday's tariff threats led pull-back was its latest Bearish Leg. That pull-back hit the 4H MA50 (blue trend-line) yesterday and rebounded. As long as the 4H MA100 (green trend-line) which is directly below the Channel Up holds, the current rebound is technically the pattern's new Bullish Leg.
All 4 previous Bullish Legs have ended on fairly similar % rises but the weakest has been +11.41%. With the 4H MACD just now completing a Bullish Cross (which has always been a strong buy signal), a repeat of the +11.41% minimum, gives us an immediate $119000 Target.
Do you think that's coming shortly before the beginning of June? Feel free to let us know in the comments section below!
-------------------------------------------------------------------------------
** Please LIKE 👍, FOLLOW ✅, SHARE 🙌 and COMMENT ✍ if you enjoy this idea! Also share your ideas and charts in the comments section below! This is best way to keep it relevant, support us, keep the content here free and allow the idea to reach as many people as possible. **
-------------------------------------------------------------------------------
💸💸💸💸💸💸
👇 👇 👇 👇 👇 👇

BTC (Y25. P2.E3).AB=CD scenarioHi traders,
In the past, ATH's have made consistent pullbacks soon after with 14%.
This time round I do expect the same, to shake out before we do new highs.
Macro wise, I still have the Cup and Handle targets.
Short term, this aligns well with my support levels.
For now, the VAL or neckline is likely to be resistance.
We had a obvious descending wedge breakout, its hit its target. and now we should range, consolidate here before price makes a decision.
For more updates, come to our forum.
All the best,
S.SAri

XMRUSDT broke resistance, waiting for consolidation XMRUSDT is consolidating against the background of an upward (bullish) trend. The coin reacted weakly to yesterday's bitcoin pullback and is testing consolidation resistance with the aim of continuing growth
Scenario: at the moment the price makes a breakout of 401.65. Consolidation of the price above the level will confirm the intentions of buyers to go to the intermediate target of 440.0. Price consolidation above the consolidation will strengthen buying, which may trigger growth

BITCOIN New Update (4H)This analysis is an update of the analysis you see in the "Related publications" section
In the previous analysis, we mentioned that you should avoid looking for sell/short positions, as Bitcoin's price pattern was designed to trap short positions. The price followed the direction of the previous yellow arrow as anticipated.
Currently, the major resistance zone for Bitcoin on the chart is the red area. In this zone, a complete bullish pattern could potentially form | or at the very least, one leg of a bullish pattern may be completed.
Let’s see how it plays out.
For risk management, please don't forget stop loss and capital management
Comment if you have any questions
Thank You

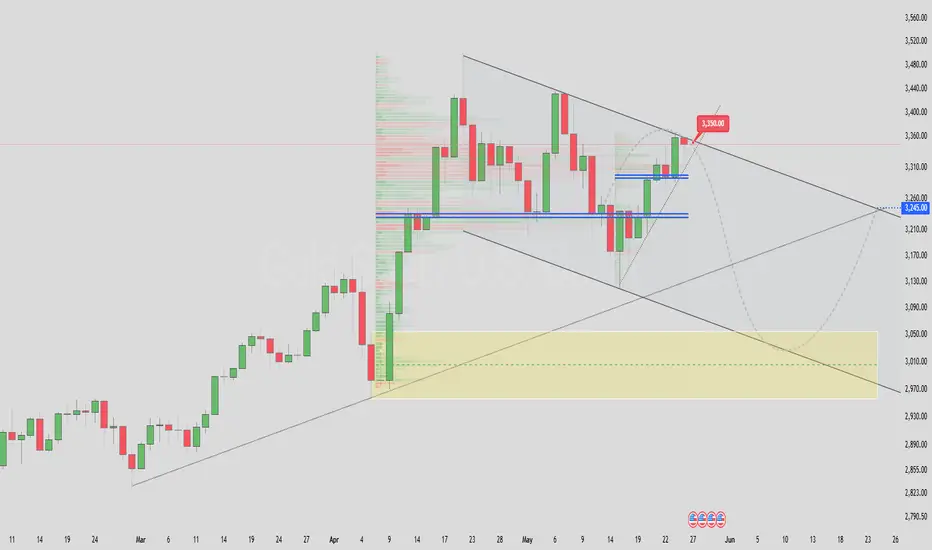
Gold Price Forecast: May - June 2025Gold is currently trading at $3,345.02. The recommendation is to sell now, targeting a bearish move down to $3,050. This outlook is supported by the formation of a rising wedge pattern in confluence with a 3rd retest on the daily chart, a technical setup that often signals a downward price movement. After reaching the target of $3,046, expect a retracement back to $3,242, where the price is likely to retest the long-term bullish trend.
bitcoin needs a long term downward correction Bitcoin right now is in a overbought condition. technically it already gives sign for a downward correction . wait for the marking position. here you need to find the sell confirmation.
Next Step $155,600, Bitcoin Closes 7th Week Green +AltcoinsThe next target and major All-Time High has been confirmed as $155,601.73 for Bitcoin and this isn't likely to be the end of the bull market. This target is now confirmed after Bitcoin wicked lower on the weekly timeframe to test support but ended up closing green, the 7th consecutive week Bitcoin closes green.
This is a major, major bullish signal. It means one thing only, the demand for Bitcoin is just too strong. So strong, that nobody is willing to sell, at least not for longer than a few hours or a few days.
Sold at 100K? Good! Buy back in but higher.
Sold at 105K? Bad! Bitcoin continues rising.
Bought below $80,000? Congratulations, you are a genius and you are holding a great position, you have months and months of bullish action yet ahead of you.
Bought below $90,000? You are still good, you are wise, you are great. You have to congratulate yourself and know that all the gains you receive you deserve. You bought when the time was right, you bought regardless of what the others said.
Bought at $95,000 or lower? There was higher risk because resistance was strong right in front, 100K-110K, and yet, you took action, now you will be rewarded for being brave. The market will bless you with tons of profits and continued success.
Missed the Bitcoin bus? There is absolutely no need to worry, at all, because the Altcoins market is still trading near its bottom and is soon to grow; What one does, the rest follows.
The Altcoins market will follow Bitcoin. The Altcoins will move to strong highs, new heights and new All-Time Highs.
It is not too late... Crypto (Bitcoin & The Altcoins) is going up!
Namaste.

SUSDTAfter forming a Diametric pattern and then correcting after that, the price is now ready to move to the specified range...

73 days looks to be spot on73 Day Lag to the Global M2 Money Supply looks to be spot on for the last year. If it is, this is good news with the M2 still climbing.
If I am right, we will have a dip within 24 hours of May 28th, only to get another pump to the upside withing 24 hours of June 2nd.
(I tried inputting all this data to Grok in order for him to give me some price targets. They were close to where I think the price will be but using the M2 for price targets still needs some work.)
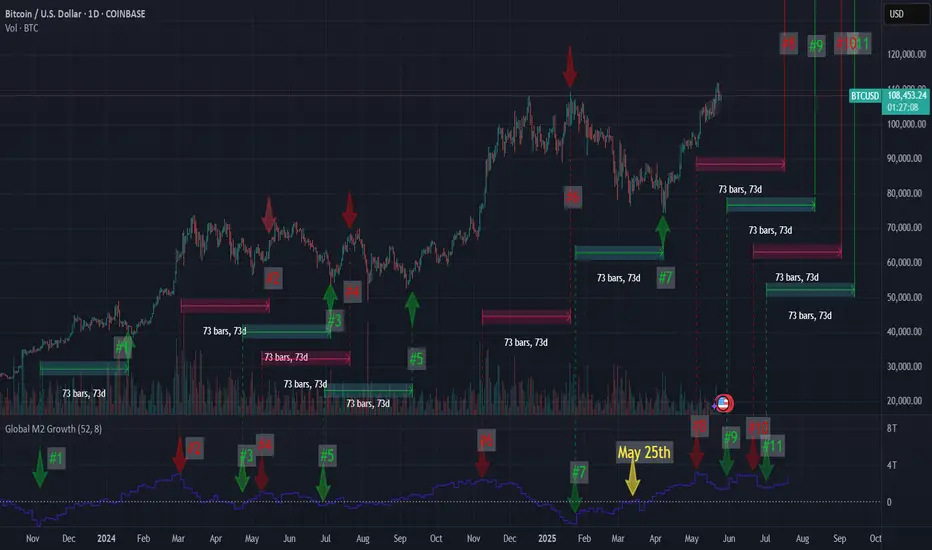
Volatility Period: Up to May 29
Hello, traders.
If you "Follow", you can always get the latest information quickly.
Have a nice day today.
-------------------------------------
(BTCUSDT 1D chart)
It is showing a downward trend below the previous ATH range.
Accordingly, we need to see if it can rise to around 109588.0 and receive support.
However, since it is currently going through a period of volatility, we need to be careful about trading until May 28th.
-
If it falls further, we need to check if it can receive support near the Fibonacci ratio range of 1.902 (101784.54) ~ 2 (106178.85).
In particular, whether it can receive support near the M-Signal indicator on the 1D chart is key.
If it falls below the M-Signal indicator on the 1D chart, there is a possibility that it will touch the M-Signal indicator on the 1W chart, so we need to think about a response plan for this.
Therefore, if it shows support near the M-Signal indicator on the 1D chart, there is a possibility that it will show a pull back pattern.
The HA-High indicator of the 1D chart is formed at 102302.08, so it is important to see if there is support around this point.
-
The OBV indicator shows that OBV is falling below the High Line, and the StochRSI indicator is also showing that it has switched to a state of K < D.
Therefore, it is necessary to check whether OBV can touch the previous High Line or OBV EMA and rise.
If it falls below that, it is highly likely to lead to further decline.
I compared the previous OBV movements, that is, A, B, C, and the current movement, and the difference can be distinguished by whether it fell below the previous candle or not.
You can see that there is a difference from the previous movement because it is highly likely to close below the previous candle.
Therefore, the point to watch is whether it falls below 102302.08 after the volatility period or rises above 109588.0-110787.38.
If it falls below 102302.08 and receives resistance, it will turn into a short-term downtrend, and if it rises above 109588.0-110797.38, it is likely that the uptrend will resume, so it is a meaningful section.
-
Thank you for reading to the end.
I hope you have a successful trade.
--------------------------------------------------
- This is an explanation of the big picture.
(3-year bull market, 1-year bear market pattern)
I will explain more details when the bear market starts.
------------------------------------------------------

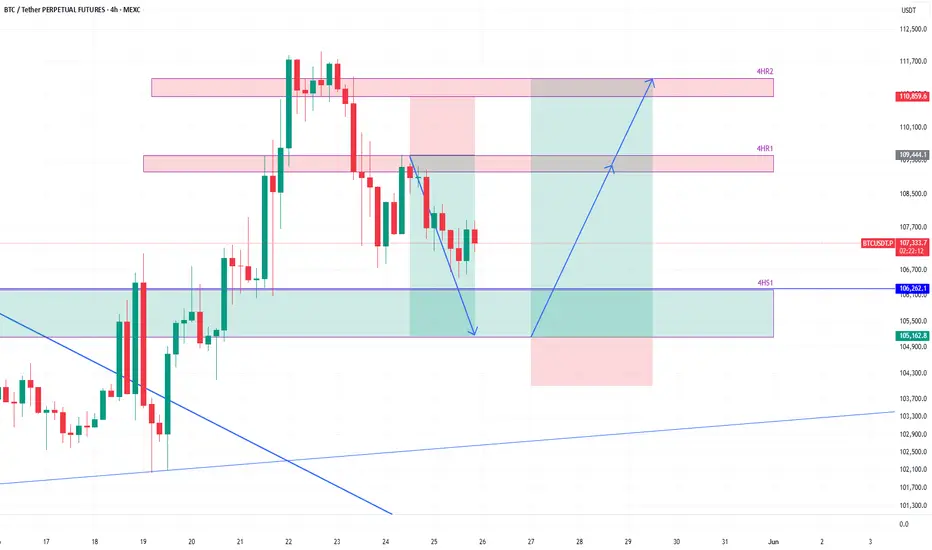
BTCUSDT to bounce from 4h supportHere is an idea for trade on BTCUSDT. The price is coming close to the 4h support zone 4HS1.
It is likely that it will find support there and bounce from there towards 4h resistance 4HR1 and possibly towards 4HR2.
We will take some profit at 4HR1 level if the price reaches there and look to refill the position on any pullback.
We will also reevaluate if the price is really heading towards 4HR2 or likely to go around 96k-97k before fueling up for upward move.
Bullish bounce?The Bitcoin (BTC/USD) is falling towards the pivot and could bounce to the 1st resistance.
Pivot: 105,255.25
1st Support: 101,983.62
1st Resistance: 111,758.60
Risk Warning:
Trading Forex and CFDs carries a high level of risk to your capital and you should only trade with money you can afford to lose. Trading Forex and CFDs may not be suitable for all investors, so please ensure that you fully understand the risks involved and seek independent advice if necessary.
Disclaimer:
The above opinions given constitute general market commentary, and do not constitute the opinion or advice of IC Markets or any form of personal or investment advice.
Any opinions, news, research, analyses, prices, other information, or links to third-party sites contained on this website are provided on an "as-is" basis, are intended only to be informative, is not an advice nor a recommendation, nor research, or a record of our trading prices, or an offer of, or solicitation for a transaction in any financial instrument and thus should not be treated as such. The information provided does not involve any specific investment objectives, financial situation and needs of any specific person who may receive it. Please be aware, that past performance is not a reliable indicator of future performance and/or results. Past Performance or Forward-looking scenarios based upon the reasonable beliefs of the third-party provider are not a guarantee of future performance. Actual results may differ materially from those anticipated in forward-looking or past performance statements. IC Markets makes no representation or warranty and assumes no liability as to the accuracy or completeness of the information provided, nor any loss arising from any investment based on a recommendation, forecast or any information supplied by any third-party.

BRIEFING Week #21 : Watch out for ComoditiesHere's your weekly update ! Brought to you each weekend with years of track-record history..
Don't forget to hit the like/follow button if you feel like this post deserves it ;)
That's the best way to support me and help pushing this content to other users.
Kindly,
Phil

"BTC - Time to buy again!" (Update)As mentioned in the previous analysis, the price reached the top of the wedge and broke out with a price increase. Now that Bitcoin's price is above the wedge, it can be said that with a slight price correction, it could follow the pattern and make a measured move where AB = CD.
PREVIOUS ANALYSIS
Give me some energy !!
✨We spend hours finding potential opportunities and writing useful ideas, we would be happy if you support us.
Best regards CobraVanguard.💚
_ _ _ _ __ _ _ _ _ _ _ _ _ _ _ _ _ _ _ _ _ _ _ _ _ _ _ _ _ _ _ _
✅Thank you, and for more ideas, hit ❤️Like❤️ and 🌟Follow🌟!
⚠️Things can change...
The markets are always changing and even with all these signals, the market changes tend to be strong and fast!!

Bitcoin: Too Early To Buy The Retrace.Bitcoin may be entering a brief corrective formation within the broader bullish trend. The large red candle that rejected the 113K resistance (see my previous article), could be the beginning of a retrace that can take price as low as the 102,500 to 100K area IF bearish momentum persists. The mistake to avoid is buying this pullback too early, especially since there is no bullish confirmation on this time frame.
The red candle off the 113K area is what I like to refer to as the "mother bar". As you will notice, the following candle is a bearish pin bar which failed to break back above the 50% point of the mother bar (see blue arrow). This is a "mini" lower high and is typically a bearish sign for those operating on smaller time frames. A break below 106,500 would confirm a sell signal on this time frame as well as smaller time frames like 4H and 1H. This can be attractive for aggressive shorts, BUT it is very important to keep the broader trend in perspective.
This bearish development does NOT constitute a change in the broader trend. This means support levels are still more likely to hold, and resistances more likely to break. The higher probability scenarios in my opinion are bullish reversal patterns between the 102,500 - 100K area. Double bottoms, failed lows etc. on 1H, 4H or this time frame would be ideal for swing trade longs (see illustration). IF the bullish trend is going to stay intact, then a higher high is within reason which can see price test 113K or higher (120K is my next resistance).
Another VERY important consideration is the overall location of price. Currently in a Wave 5 (v) configuration which signifies limited potential in the near future. In other words, RISK is elevated and only continues to increase as price climbs higher. As "optimistic" as everyone may seem to be, this is a time to be more defensive, NOT aggressive. This can be accomplished by reducing expectations, operating on smaller time frames, and taking smaller positions. My Trade Scanner Pro helps to quantify risk which is especially helpful in rising risk environments such as this one.
In contrast, the location to be aggressively bullish was the 76K area low. Sure I can say this after the fact, BUT if you read my analysis and watch my streams from that time, I was pointing out the potential and the bullish signs as they were developing in real time.
Market situations like the one Bitcoin is in right now can be very confusing at times. Navigating this environment successfully depends on how you interpret price structures, trends and levels across multiple time frames and letting the MARKET validate ideas or not the other way around. Always consider arguments on both sides of the market and weigh those arguments against the style or strategy that you intend to deploy. And if confusion ensues, then the easiest thing to do is walk away. When potential is limited, there is nothing to fear in terms of missing out.
Thank you for considering my analysis and perspective.

ETHUSDT at 2511: Breakout or Breakdown at 2550?Ethereum (ETHUSDT) is currently trading at 2511 on the 4-hour timeframe, sitting in a consolidation phase after a recent uptrend. Over the past few days, the price has shown resilience, bouncing off a key support level around 2400 and now testing a critical resistance at 2550. This 2550 level is a make-or-break point: a clean break above it could spark a bullish move toward 2700, while rejection here might send the price back to retest 2400. The broader market vibe is cautiously positive, with Ethereum’s upcoming upgrades generating some buzz, though regulatory uncertainties could weigh things down if negative headlines hit. Volume has been tapering off during this consolidation, which is normal, but keep an eye out, a breakout with strong volume will carry more weight.
From a technical standpoint, the 50-period moving average (MA) sits at 2450, and the 200-period MA is at 2300, with the price comfortably above both. That’s a solid bullish sign for now, but the 50-period MA is starting to flatten out, hinting that the upward steam might be cooling off. The Relative Strength Index (RSI) is at 60, right in the neutral zone, not overbought or oversold, so there’s room for the price to swing either way. Over on the MACD, the line is above the signal line, showing bullish momentum, but the histogram bars are shrinking, which could mean that momentum is losing some juice. Traders should watch for a breakout or a MACD crossover to get a clearer sense of what’s next.
There’s also a potential pattern taking shape: an ascending triangle, with the flat resistance at 2550 and a rising support line from 2400. This setup is typically bullish, but it’s not a done deal until we see a confirmed break above 2550. If that happens, especially with a volume spike, it’s a green light for bulls. On the flip side, if the price slips below 2400, it could signal a short-term bearish shift. For now, 2550 is the level to watch, it’s where the action will heat up. Whether you’re trading the breakout or the rejection, this is a spot to plan your moves carefully!
