Bitcoin is still in an uptrend that is your friend.... but...BTC has taken a pullback after the orange swan event. Now that volatility has pushed down, I want to see the bullish response. If the bulls can't maintain the uptrend, the market structure defines a lower high. A CHOCH usually begins with a lower high followed by a lower low.
Full analysis: Link in the BIO
BTC-M

ETH cheaper than $1,500 already this SUMMER? Hi! While many are already predicting an alt-season and hundreds of X's, let's see if it's really so? 🤔
While bitcoin is updating ATH day by day. ETH is still trading almost 40% cheaper than its peak in this cycle . And on the low time frame it is already forming a double top pattern, signaling a downside risk in the near future.
With the current growth we have closed a small GAP at the level of 2,250 - 2,650. But there is still a GAP above us in the zone of 2,800 - 3,250. In addition, below us there is now a GAP formed in the range of 1,850 - 2,450. And as we know, 99% of GAPs tend to close sooner or later.
❓ But here's the question - which one will close sooner? Let's get to the bottom of it!
⚙️ Indicators and metrics:
MACD - has already given a bearish section, signaling a potential trend change.
Volume - since February 3, all further declines, the volume of ETH purchases has only declined, signaling a decline in interest in the asset. Even at 1400 and below, buying volumes were still disastrously low . Showing the lack of interest in the asset even at such prices.
VRVP - shows buying and selling volumes at price levels in relation to each other. It is noticeable that at the levels of 2,400 - 2,750 the trading volumes increase significantly , and in both directions. Showing that this level is still a strong resistance , and the mood in ETH is extremely speculative and few people are interested in it at 1,400, but at 2,500 it is good choice! 😁
📌 Conclusion:
In my opinion, this was a purely technical rebound for ETH after a long decline . As well as for the altcoin market as a whole. Those altcoins that were simply declining more rapidly than others are the ones that are growing fastest now.
Besides, I remind you that summer is coming soon and there will be less liquidity on the market. So unless the current market conditions push ETH to 3,000 and above . We can definitely not expect it in summer and the most probable scenario in my opinion is blue. I don't think we will see ETH at 1,500 and below (unless Trump does something weird), but it is possible to close GAP and go to 1,800.

Is BTC Poised for a Pullback or Continuation? Key Levels on 3D We’ve got a strong resistance level formed by the double top from Dec 14, 2024, and Jan 19, 2025.
✅ Price is above the 200MA, 50MA, and Bollinger Bands.
✅ MLR > SMA confirms the bullish momentum.
I don’t see any immediate reasons to panic. A pullback to the Bollinger Bands or even the 50MA could be in play, but the price action will depend heavily on macro conditions. 🌎
⚠️ If you're highly leveraged, consider risk management. Keep an eye on price action and stay cautious.
📈 Keep close, follow me for more insights, and thank you for reading! Stay safe. 🙏

BTCUSDT – Hitting resistance, is selling pressure returning?Bitcoin is showing signs of losing momentum after touching the resistance zone around 111,669. On the H4 timeframe, the previous bullish structure has stalled with a series of red candles and a clear pullback, bringing price back to test the EMA 34 zone.
In terms of news, although the market remains excited due to expectations surrounding a Bitcoin spot ETF, many large investors are starting to take profits after the recent sharp rally. This is causing selling pressure to slightly outweigh buying in the short term.
The most likely scenario now is that BTC could make a mild upward move to retest the 111,600 area – but if it fails to break above, a reversal back toward the support zone at 105,800 is highly probable. This area aligns with the EMA 89 and a previous accumulation zone.
Current strategy: don’t get caught in a false breakout. Instead, watch the 111,600 area and wait for a clear signal. If a reversal candlestick pattern appears, short-term sell entries may be considered with a target near the lower support.

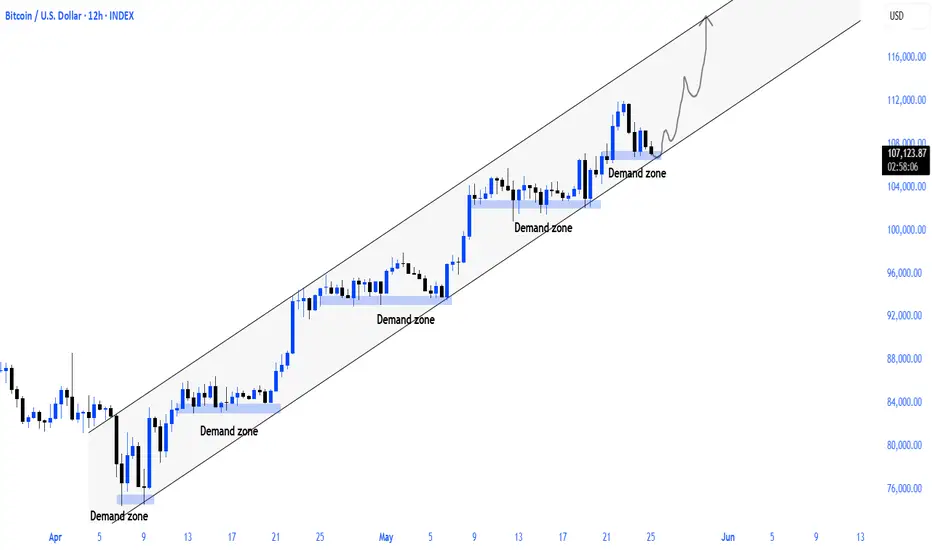
Bitcoin Double-Top & $60K Correction ExplainedPeople are showing Bitcoin producing a double-top or shy higher high and then crashing down to new lows. This is a strong fallacy. Here we can see Bitcoin trading above $102,000 for 12 days before moving higher, this creates a support zone. (Green on the chart.) Bitcoin can easily consolidate above this level before moving higher. All the action in mid-December 2024 and late January 2025 also makes this zone a very strong support zone.
Before Bitcoin trades at $60K or $70K for example, it needs to break below $100,000. For Bitcoin to break below $100,000, it first needs to challenge $102,000 which is a super strong long-term support.
For Bitcoin to move below $102,000, it needs to break below $105,000. What Bitcoin is doing now, is simply consolidating the last advance, preparing for additional growth.
Notice that there is no huge bear volume candle after the new ATH. Also notice that the red candle happened the day after the ATH and not the same day. Bitcoin is not set to crash. Bitcoin will continue growing.
Remember, the FED will lower interest rates next month and this will be the boom (catalyst) that will push the Cryptocurrency market to the stars.
Namaste.

#202521 - priceactiontds - weekly update - bitcoinGood Day and I hope you are well.
comment: Bulls finally got the breakout on Wednesday and we printed the new ath. My max upside target was around 115/116k and the high so far is 112k. Can we do more? Bull trend line is unbroken, so yeah. We have seen 3 clear legs up and betting on more is always a bad strategy. My broader bearish bias also includes btc and I expect another try above 110k but it can be a higher high or lower high, you never know in advance.
current market cycle: Broad bull channel on the weekly and monthly chart. Daily is in a tight bull channel that will likely break next week
key levels: 100k - 115k
bull case: Bulls are fine as long as the trend line holds and they stay above 100k. I don’t have any targets above 116k and I do think we are in the last stretches of this trend. So if you are looking for confirmation bias on your “btc to 1mil”, you have come to the wrong place.
Invalidation is below 100k.
bear case: Bears need the daily close below 100k and/or print a clear lower high. Right now we have one big bear bar from Friday with terrible follow-through. Bears are not doing enough so don’t be early. I expect btc to hit at least 80k again this year but for now there is not much more to comment on until bears come around. Worst case for bears would be sideways above 100k for 2-3 weeks because that would be huge confirmation and bulls could dream about prices above 120k.
Invalidation is above 116k.
short term: Neutral. Expecting another try above 100k but that should conclude this bull trend. Only interested in shorts once bears come around.
medium-long term - Update from 2025-05-25: Will update this next week but plan here is the same as other markets. I wait for this to top out and trade it back down to 80k over the summer.

btc 12hbitcoin continues to maintain its rising trend support starting with 74k. i think it will start to move upward from the trend support equivalent to the current demand zone
Intraday scenariosMorning folks,
Now we do not see yet any background for a "big game". Market needs time to manifest the next step. We said previously that it might be either direct upside action or big reverse H&S on weekly chart.
Now it is too few time passed to understand this. On a daily chart we have bearish context and engulfing pattern. So all that we have for Mon-Tue is an intraday downside AB=CD setup with ~104 and 101K targets.

ETH - Ethereum Weekly Chart🔍 Market Structure & Smart Money Analysis:
✅ Bullish Signs:
Recent CHoCH at $2,000: Suggests shift from bearish to bullish order flow
BOS above recent resistance: Confirms upward market structure
Stochastic Oscillator: Turning bullish from oversold area (momentum confirmation)
Volume Pickup: Suggests stronger buyer interest
🧠 Liquidity Zones:
Equal Lows (EQL) seen in 2023 and again near 2024 → were taken out → classic liquidity sweep before reversal
Weak High near $4,951: A future potential liquidity target
Supply Zone around $3,200–$3,700: Previously strong resistance, could act as a rejection point again
🧭 Trend Summary:
Macro Structure: Recovering from multi-month downtrend
Short-Term: Bullish momentum building post-reversal
Next Objectives:
Bullish target: $3,200–$3,700 (possible pause or reversal zone)
Bearish invalidation: Drop below $2,000 with strong candle body
📝 Conclusion & Outlook:
ETH has likely confirmed a bullish shift on the weekly timeframe with the CHoCH and BOS above $2K.
Immediate upside targets are within the $3,200–$3,700 region before facing stronger resistance.
This could be the beginning of a longer-term accumulation → markup cycle, targeting the $4,950+ liquidity zone eventually.
Keep monitoring weekly closes and volume, and watch for divergence or rejection signals near supply zones.
-------------------
----------------------------
Low Market Cap #RWA #RealEstate #Tokenization Platforms by FDV
SQRB $100K on PROBIT
$RNB $310K
$HTS $1.9M
$STBU $3.5M
LAND $3.6M
-----
Not for recommendations to BUY SELL any stocks, cryptos, FX or securities
Not for Financial Advise
DYOR

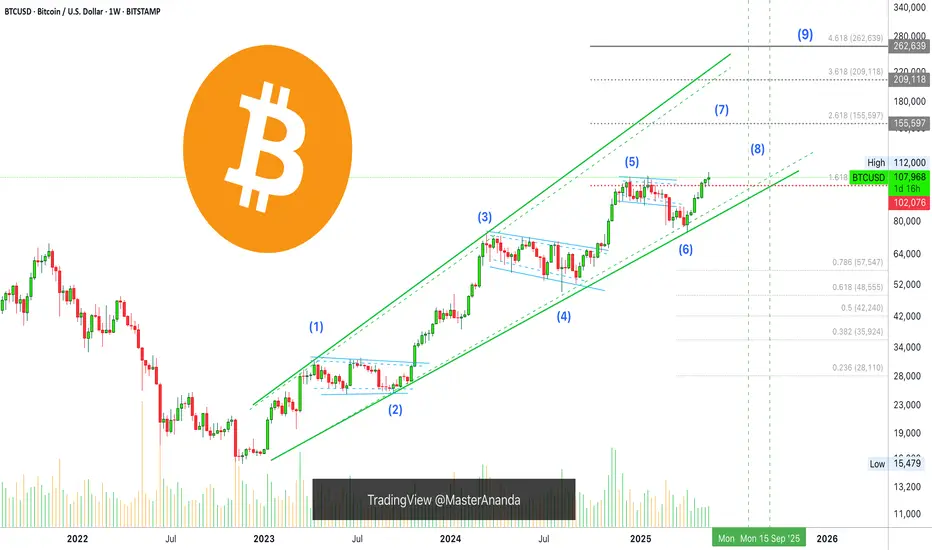
9-Up Waves—Extended Bullish Impulse—Bitcoin's 2025 Bull MarketIn Elliot Wave Theory, a bullish impulse has a total count of 5 waves but this isn't all. There is something called an "extension." Extensions can lead not only to 9 total waves but even 13 waves.
We can easily see this happen if we consider Bitcoin's bull market based on the long-term chart structure, starting in November 2022, see the chart above.
A bull market is defined as a sequence of higher highs and higher lows. This is perfectly visible on this chart. Contrary to many Altcoins, Bitcoin is in a long-term bull market.
If we consider even some of the big Altcoins projects, we can see that no long-term bull market is present, many are producing lower lows, but at the same time, others are producing long-term uptrends like Tron. So there are variations.
Seeing a perfect long-term 5 waves pattern completed when Bitcoin hit $110,000 in January 2025, seeing a strong higher low and the continuation of this trend, we can easily conclude that an extension is taking place.
Will this extension end at 9 waves or 13 waves?
Bitcoin is going up. It is already happening. There will be more.
Thank you for reading.
Namaste.
Bitcoin Hits New High Thanks Mars & Saturn: Bearish Or Bullish?Based on new data that is available just now, the daily action and the Altcoins market is Bitcoin considered to be bullish or bearish coming from TA?
Bitcoin just produced a new ATH based on candle close, 20-May, higher than 18-May at $106,855. Resistance continues to be challenged, the more challenge the weaker it becomes.
Market conditions are bullish of course, we have now the same situation as in late April and in late April we were witnessing a bullish continuation and prices moved up. Remember late May? That's the time when everything Crypto goes bullish and bullish it is already just hyper-bullish not yet.
A new All-Time High is bullish enough I guess but Bitcoin will continue growing we have very good dates 22 and 24 May. And then the rest of the month for additional growth. This is only the start.
But, will Bitcoin continue straight up or is there room for a retrace?
That's being a bit too greedy but ok, let's study the chart an answer. There is room for a small retrace but this type of retrace is low probability, why? Many people would be waiting for such a move and since this is easy to see and expect the market movers tend to move in a way that people cannot predict, which means straight up. Most people would think that straight up is too much, there must be some relief and so, instead of betting up they bet down short-term but this never works because all the bears are thinking the same. The whales are smart and know how to play. Once the "go" button is on, it is on and Bitcoin grows non-stop until the next major resistance zone.
I identified for you the most strong support level ultra long-term, based on numbers from 2022-2021 and that's $102,000. This level cannot fail weekly/monthly timeframes.
Now, my idea is that Bitcoin will continue growing straight up. There is just no time for retrace, Bitcoin is being magnetized by an incredible force. Bitcoin is being guided by Mars and Saturn and both of these planets are saying up!
Namaste.

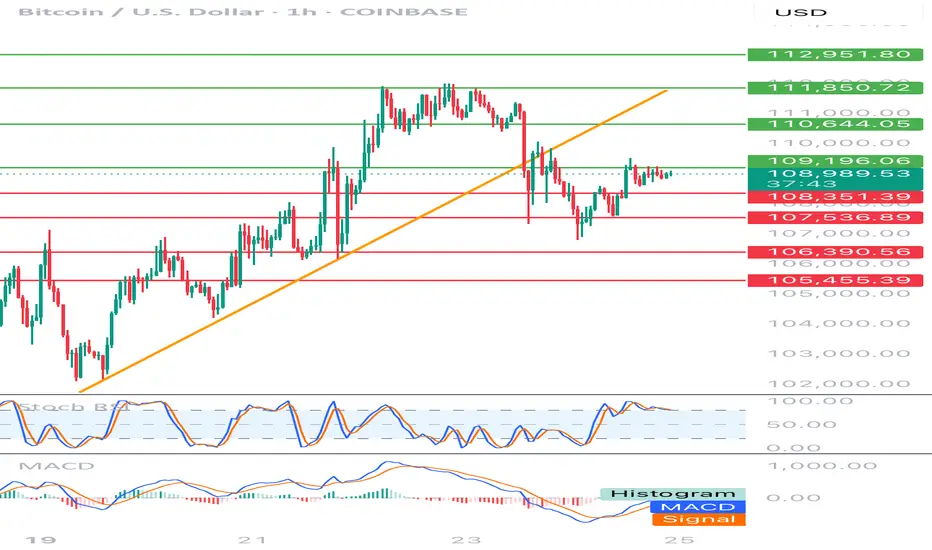
BTC-USD 1h chart targets and stoplossHello everyone, let's look at the 1H BTC chart to USD, in this situation we can see how the price dropped below the local upward trend line. Going further, let's check the places of potential target for the price:
T1 = 109196 $
T2 = 110644 $
Т3 = 111850 $ t4 = 112951 $
Let's go to Stop-Loss now in case of further declines on the market:
SL1 = 108351 $
SL2 = 107537 $
SL3 = 106390 $
SL4 = 105455 $
Looking at the RSI indicator, we see staying over the upper limit, which can give price drops, while the MacD indicator lasts at the bottom of the range and is close to returning to the upward trend.
Bitcoin: LEVELS LOOKOUT!If you find this information inspiring/helpful, please consider a boost and follow! Any questions or comments, please leave a comment!
BTC on Watch: Short-Term Levels That May Show the Market’s Hand
#Bitcoin is hovering around all-time highs, but traders should be on high alert. There’s a visible level just beneath price that’s acting as the current line in the sand.
What to Look At
Rather than overanalyze, just focus on the chart. A clean level around $100k is marked — if that gives way, it may not just be a smaller degree pullback on news. It could be the start of something more revealing and deeper.
What Comes Next?
If price breaks that 107k zone, watch what the market prints in response. Does it flush impulsively? Does it grind? Those reactions will show intent — and possibly confirm or deny a larger corrective wave unfolding.
Outlook
We’re not guessing the future — we’re waiting to observe the market’s decision point. Eyes on that level. If it breaks, the chart will speak louder than words.
Trade Safe!
Trade Clarity!

The Greatest Chainlink Bar Pattern in History: The Crystal Ball For over 700 days now, following this Chainlink bar pattern has been the most profitable bar pattern I have ever found since I began this journey — it’s literally been a map of the future.
But for the first time, there has been a massive deviation. Let me explain.
We must go back to August 2020.
According to the bar pattern, we’ve just completed the same move from August 2020 — but the big difference here is that this time, it’s taken over 100 days to complete, while in 2020 it took just 30 days.
So far this cycle, it's the biggest deviation yet. Which has me thinking: what if this cycle breaks the four-year cycle and we extend beyond the 1,064-day cycle that's supposed to complete in October 2025?
Without this recent deviation, Chainlink would have completed the cycle bar pattern in August 2025.
My Chainlink Time Fib has a hit on this time period — August 2025. Something could happen around this time. This Time Fib has had major calls before, although it has also failed in the past.
The new deviated timeline for the cycle top:
This is what it would look like if the deviated bar pattern was shifted. Could this be a major clue showing us the future again? Are we catching a glimpse of what’s to come?
According to this new timeline, Chainlink rallies slowly until October 2025 — which lines up with Bitcoin’s cycle completion date. Bitcoin has never passed 1,064 days in a bull market. The last two cycles took exactly that long. So it’s interesting that price appears to grind upward to that date and then roll over.
It continues to roll over and apparently has a major retest of the lows:
This shows a retest of $10 in December 2025 — forming what could be the biggest bear trap in history — before a massive rally in 2026 leading to a March 2027 top.
I’ll be watching Chainlink like a hawk this year. So far, it has led the way for me and made this cycle pretty easy to read. Is it possible that the major run happens in 2026?
Stay safe, marines. 🫡

Bitcoin - Confirmed Breakout#BTC/USDT #Analysis
Description
---------------------------------------------------------------
+ Bitcoin has successfully broken out from the resistance, this is the third time bitcoin has broken out from the resistance line, in the previous two breakouts bitcoin had significant growth and we can expect similar growth this time.
+ the next target for bitcoin is around 150k and this is an easy target for bitcoin.
+ Bitcoin can see some consolidation around previous resistance (around 109k) but this can be broken easily.
+ Lets see how this plays out.
---------------------------------------------------------------
Enhance, Trade, Grow
---------------------------------------------------------------
Feel free to share your thoughts and insights. Don't forget to like and follow us for more trading ideas and discussions.
Best Regards,
VectorAlgo

Bitcoin Lines- What you can see if you remove Bars and replace them by Lines ?
- Congratulation, you just removed the noise in the chart.
- Everything is in graph.
- Covid19 Black Swan included.
- Not a price prediction.🤷♂️.
Happy Tr4Ding !

Bitcoin Be Setting Bull Trap?_Breakout Without High VolumeBitcoin ( BINANCE:BTCUSDT ) started to fall yesterday after forming a new All-Time High(ATH) with high volume , but started to rise again. One of the reasons for Bitcoin’s sudden drop yesterday was the sharp drop in the S&P 500 ( SP:SPX ) index .
First of all, I must say that Bitcoin’s situation is a bit complicated and difficult to analyze , so pay more attention to money management. Be prepared for any scenario.
Bitcoin is trading above the Resistance zone($109,588-$105,820) and near the Resistance lines and Cumulative Short Liquidation Leverage($113,020-$111,833) . What is worrying is that the break of the Resistance zone($109,588-$105,820) was NOT accompanied by high volume , suggesting a bull trap is possible .
I see a correction to at least Cumulative Long Liquidation Leverage($109,972-$108,609) given the low breakout volume for Bitcoin and the large sell orders in the upper prices for Bitcoin .
--------------------------------------------
Today, the Flash PMI data from the U.S . came in stronger than expected:
Flash Manufacturing PMI: 52.3 (vs. forecast 49.9, previous 50.2)
Flash Services PMI: 52.3 (vs. forecast 51.0, previous 50.8)
Analysis :
Both numbers exceeded expectations, signaling stronger economic activity in the U.S. This is bullish for the USD( TVC:DXY ) and could put short-term downward pressure on Bitcoin, as it lowers the chances of near-term Fed rate cuts.
--------------------------------------------
Do you think Bitcoin is completing a Bull Trap or should we expect Bitcoin to increase further?
Note: If Bitcoin breaks above $114,500 with high momentum, we can expect Bitcoin to rise to near $119,000.
Please respect each other's ideas and express them politely if you agree or disagree.
Bitcoin Analyze (BTCUSDT), 1-hour time frame.
Be sure to follow the updated ideas.
Do not forget to put a Stop loss for your positions (For every position you want to open).
Please follow your strategy and updates; this is just my Idea, and I will gladly see your ideas in this post.
Please do not forget the ✅' like '✅ button 🙏😊 & Share it with your friends; thanks, and Trade safe.

BTC BULLISH SETUPBTCUSDT is looking for a reversal and to take the bullish trend extended towards the FVG formed on top. Under the lower timeframes we have a valid reversal indication identified.

BITCOIN - Price will continue to grow inside rising channelHi guys, this is my overview for BTCUSDT, feel free to check it and write your feedback in comments👊
Price started to grow inside rising channel, where it declined to support line and then bounced up to $93100 level.
BTC broke this level at once and then some time traded near, after which bounced and continued to grow.
Soon BTC made a correction, but quickly turned around and later rose to $104900 level, after which started to decline.
After price fell a little, it made an upward impulse to resistance line of channel, breaking $104900 level.
But not long time ago, BTC bounced from this line and started to decline, so I think that price can continue to fall.
Also, I expect that price will fall to support area and then turn around and continue to grow in channel to $113700
If this post is useful to you, you can support me with like/boost and advice in comments❤️

BTC - LOOSING STEAM BTC HAS BROKEN 2 TREND CHANNELS, RED , YELLOW. AND BADLY DAMAGED THE PRIMARY, BLUE.
Its taking out support after support on 1st touch.
If BTC penetrates again thru blue, BTC will begin a larger correction.
BTC must stop falling at $105,600 - $105,000.
The downside target is not yet defined.

Bitcoin Closes Red! Is The Bull Market Over?The end of the bull market and the start of a strong bearish cycle is now confirmed? That's the question that I received from one of my new followers based on much news all across the Cryptocurrency market.
How far down is Bitcoin going in this long-term, very strong, hard and surely-highly confirmed marketwide ultra-bearish correction? None.
I have news good for you, there is no correction, Bitcoin closed one day red. Yesterday's candle produced a 4.4% drop right after Bitcoin hit $112,000, a new All-Time High.
The truth is that Bitcoin just hit a new All-Time High and this reinforces the bullish bias for this Cryptocurrency market, it bolster the Altcoins market; Everything is set to continue growing.
What does $500,000,000 in liquidations, a new ATH and a 4% drop have in common?
Over-leveraged traders.
These are the only losers right now. In order to be liquidated after such a very small move it means that you were trading with more than 15X. That's it. The rest of the market is solid, everything else is strong and there is no need to fear; remember, retraces and corrections and an opportunity to buy-in, rebuy and reload.
Just wanted to tell you that all is well, the rise is not over, this is just a minor pause. Look back to late April, early May, mid-May and so on, the market can and does produces red days, it never moves straight down but neither straight up.
A new bear market now? FALSE.
Bitcoin will continue growing long-term. The Altcoins are on the same train.
A retrace can last a few days just as it can last a few weeks.
A correction can last a few weeks just as it can last a few months.
A bull market can go on for years, and we are in bull market territory now, so be ready and prepared for additional growth. Bitcoin is going up!
Rest easy and hold strong.
Continue to buy and accumulate the Altcoins.
This is not the end, it is only the start.
Namaste.

BTC/USD IS A STRATEGIC CORRECTION OR A NEW RALLY AHEAD?BTC/USD 24 MAY – IS A STRATEGIC CORRECTION OR A NEW RALLY AHEAD?
🌐 MACRO & FUNDAMENTAL CONTEXT
Federal Reserve Outlook: Recent statements from Fed officials remain hawkish, signaling that interest rate cuts may not arrive soon. Inflation data remains sticky, adding pressure on risk-on assets like crypto in the short term.
Market Sentiment: Investors are cautious, with capital flowing back into safer assets amid global uncertainty. However, long-term sentiment on BTC remains strong, supported by fundamentals.
On-Chain Metrics: Wallet activity and hash rate growth continue to reflect strong underlying demand. This suggests accumulation despite short-term price pressure.
📉 TECHNICAL STRUCTURE (H1 CHART)
BTC/USD is currently correcting after reaching the 111,947 resistance area. Price bounced from the 106,831 support zone and is now approaching the mid-range levels again.
Chart Formation: A possible "bull trap" pattern is forming. Price may retest the 110,000 – 111,947 supply zone before deciding the next move.
EMA Signals: Short-term EMAs have crossed downward on the H1 timeframe, indicating a weakening bullish momentum.
🎯 TRADE SETUPS FOR TODAY
🔻 SCALP SELL ZONE:
Entry: 111,800 – 111,950
Stop Loss: 112,200
Targets: 110,000 → 108,500 → 106,800 → 102,567
🔺 BUY ZONE (PULLBACK SUPPORT):
Entry: 106,800 – 106,600
Stop Loss: 106,200
Targets: 107,800 → 109,000 → 110,000
🔍 TECHNICAL KEY LEVELS
Resistance Zone: 111,947 – 112,000
Support Zone: 106,831 → 106,600 → 102,567
FIBO Key Levels: 0.5 – 109,393 | 0.382 – 108,763
⚠️ STRATEGY OUTLOOK
If BTC breaks above 112,000 with strong volume, expect a bullish continuation toward 114,000+ levels.
However, if price fails to hold above 110,000 and drops below 106,800, a deeper correction to 102,500 may follow.
📌 CONCLUSION
"BTC is at a decision point, trading between macro hawkish pressure and technical liquidity zones. Stay flexible and wait for confirmation before committing heavily."
Watch the US Jobless Claims data tonight for volatility triggers.
Avoid emotional trades. Use strict risk management.
Follow this profile for more real-time plans and updates.

$BTC to Retest .786 Fib Next ~$102k - BTFD!timberrrrr
the crypto gods shall giveth one last chance.
buy the fckn dip!!!
