BTC Bullish Deep CrabAn idea to display an potential Deep Crab idea. This might hit the support line at 98k that was the last resistance from the last rally. Whether this holds is another story. Thank you
BTC-M

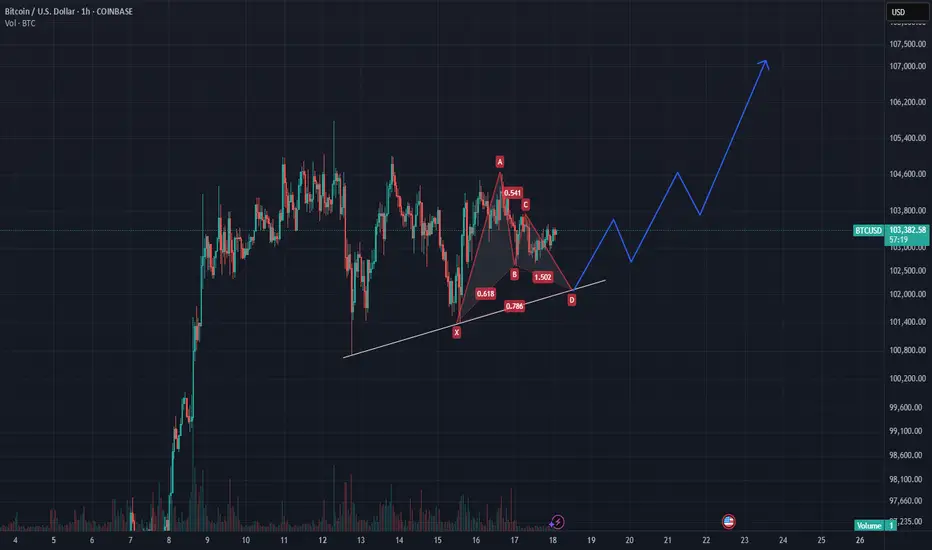
BTC Bullish GartleyAn idea to display an potential Gartley idea. This might hit the trendline that is upsloping. Whether this holds is another story. Thank you
BTCUSD 19.05.2025 Bitcoin Navigator: BTC Update (May 2025)So the offline tournament is over, I took third place, and I just got back into work mode
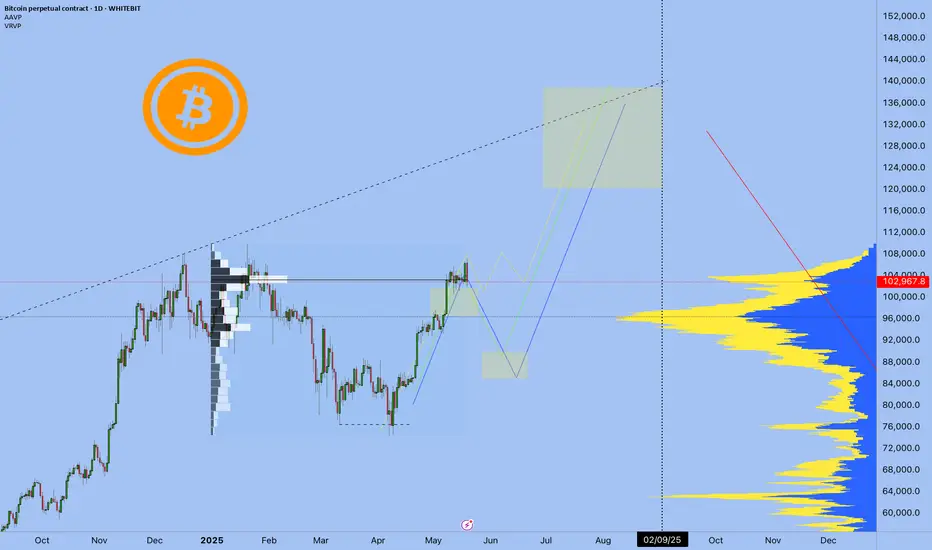
In my previous publication ( link ), I outlined possible scenarios for Bitcoin’s price action, leaning towards a correction from around the $98-101k zone down to approximately $88k.
However, the current market situation demonstrates the most optimistic scenario (highlighted in yellow on the chart). At the moment, we're seeing Bitcoin consolidating within a clear range, likely preparing for an upward breakout without a significant correction. This scenario is certainly the most bullish one, yet my inherent skepticism doesn't exclude the possibility of a correction before we reach a new all-time high (ATH).
📌 Key points in the current market situation:
The main question now is not whether we'll achieve a new ATH (as this seems almost inevitable) but rather how we'll get there.
Two scenarios are on the table: a smooth upward trajectory without substantial corrections, or an initial correction followed by a strong breakout.
🔖 Profit Maximization Strategy:
Many traders are shifting their attention towards altcoins, tempted by potentially greater returns. However, it's crucial to remember that higher upside potential also means significantly higher risks (low liquidity, increased manipulation, higher volatility).
I have already chosen the tokens that I am interested in for long time
Also now a new narrative has appeared, Internet Capital Markets (ICM) tokens. If you are interested, write in the comments "interesting ICM"
Best regards EXCAVO
BRIEFING Week #20 : ETH Reversed, WTI Next ?!Here's your weekly update ! Brought to you each weekend with years of track-record history..
Don't forget to hit the like/follow button if you feel like this post deserves it ;)
That's the best way to support me and help pushing this content to other users.
Kindly,
Phil

BTCUSDT - fractal from ATH I think this is a classic pattern now, and we are repeating the situation in the same price range that we had half a year ago when the ATX was forming. That is, we will not update the high or will do it a little bit, and after that we will go to the zone of 93 thousand plus minus and from there will be a significant reversal to 102 thousand, after that it is difficult to predict what will happen next. Either strongly down or strongly up, until then we can safely work on the fractal and after that I will give an update of the idea.

19/05/25 Weekly OutlookLast weeks high: $105,46
Last weeks low: $100,751.75
Midpoint: $103,372.10
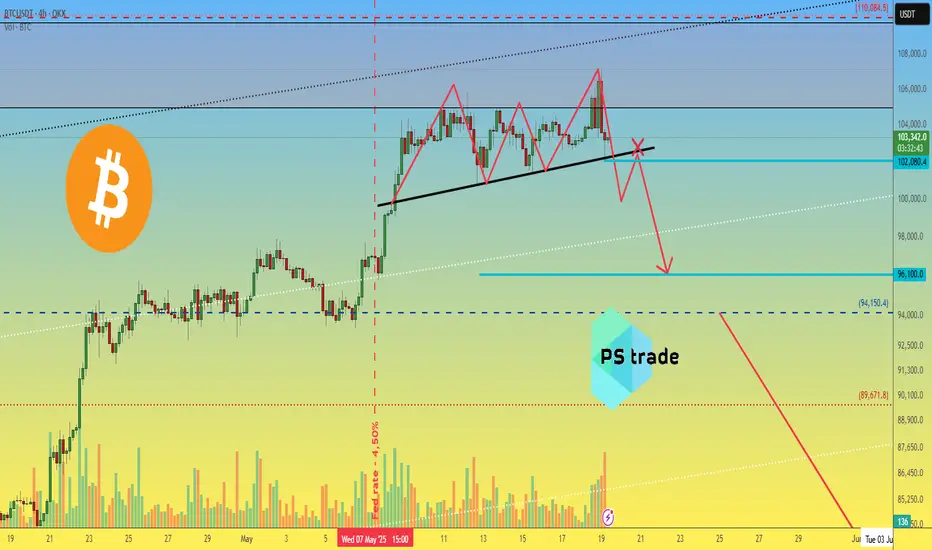
In my weekly outlook post from last week I mentioned how there was a clear pattern of consolidation with a tight range for a week with a week of expansion that followed, and that if the pattern were to continue we would see BTC consolidate around the weekly high. The theory was proven correct on this occasion with a tight range between weekly high and the 0.75 line, as theorized with only momentary dips below the 0.75 line. Now if the pattern were to continue this week would be expansion week, but for me this time it's slightly different as BTC approaches ATH there is a massive level of resistance just above this weeks weekly high. We've seen an initial early attempt to breakout above weekly high and that attempt has so far failed quite aggressively, which leads me to believe there will be volatility this week as both bulls and bears contest this very important area of the chart.
For the bulls maintaining momentum and breaking into price discovery with acceptance above $109,000 would be incredibly, the headlines will read new ATH, FOMO kicks in and retail follows etc, we know the drill. For the bears the objective is to hold the line and reject weekly high ($106,000) at all costs and print a strong SFP and unfortunately this does seem viable with $97,000 being the target area IMO. RSI on the daily is around the overbought level, combined with key resistance level a pullback would make sense.
For me this week I want to see how ETH and other major alts react to any pullback, do they get bought up with purpose? Is the structure strong to maintain this move or is this a HTF lower high? An interesting week coming up I'm sure.
Good luck this week!

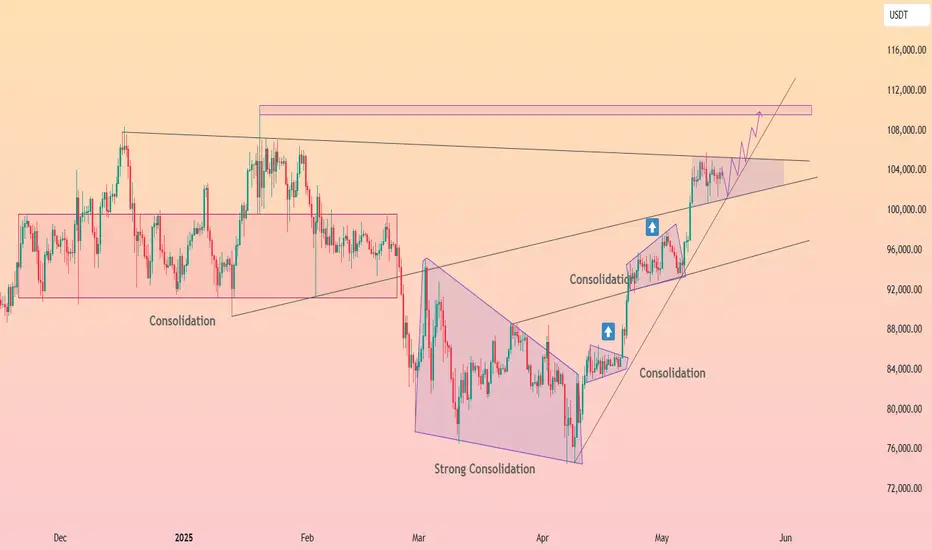
HolderStat┆BTCUSD channel grind toward 110 kCRYPTOCAP:BTC price has stair-stepped out of March’s strong consolidation triangle and is now travelling inside a neat rising channel. Each mini flag has resolved higher, with the latest squeeze holding the mid-line near 102 k. As long as that trend-line underbelly and the diagonal support from April lows remain intact, bulls retain control and can probe the 108-110 k supply zone highlighted on the chart. Only a daily close back inside the lower rail would threaten the current bullish momentum.
BTC/USDT Breakout Signals Bullish Continuationhello guys!
BTC/USDT broke out of a symmetrical triangle on the 1H chart, signaling a bullish continuation. Price is currently around $105,471, with a projected move toward the $106,500 resistance zone. A retest of the breakout area ($104,500–$104,800) is possible before further upside.

BITCOIN forming 1st 1D Golden Cross in 7 months! New ATH ahead??Bitcoin (BTCUSD) is about to form its first Golden Cross on the 1D time-frame in 7 months (since October 27 2024). This comes with the price very close to its $109k All Time High (ATH), following a relentless rebound and recovery from the Trade War correction.
Within the Bull Cycle's 2.5-year Channel Up, all 1D Golden Crosses have delivered higher prices instantly and the minimum % rise one has given before a new 1D MA50 (blue trend-line) pull-back, has been +33.11%.
This gives us an immediate Target of $135000 and is very much in line with a number of previous projections that the date show within this Target Region. Notice also how on all 3 last 1D Golden Crosses, a 1W MACD Bullish Cross precedes it. Basically that is the double confirmation of the medium-term bullish extension.
So do you think this 1D Golden Cross is such a strong buy signal and if yes, is $135k the bare minimum Target short-term? Feel free to let us know in the comments section below!
-------------------------------------------------------------------------------
** Please LIKE 👍, FOLLOW ✅, SHARE 🙌 and COMMENT ✍ if you enjoy this idea! Also share your ideas and charts in the comments section below! This is best way to keep it relevant, support us, keep the content here free and allow the idea to reach as many people as possible. **
-------------------------------------------------------------------------------
💸💸💸💸💸💸
👇 👇 👇 👇 👇 👇

Bitcoin - Bitcoin is Fighting Its Previous High!Bitcoin is above the EMA50 and EMA200 on the four-hour timeframe and is in its medium-term ascending channel. A break of the drawn trend line will lead to a decline in Bitcoin. If Bitcoin moves downwards towards the specified demand zone, we can look for its next buying opportunities. If Bitcoin is above the resistance range, it will lead to it reaching Bitcoin's previous ATH.
It should be noted that there is a possibility of heavy fluctuations and shadows due to the movement of whales in the market and observing capital management in the cryptocurrency market will be more important. If the downward trend continues, we can buy within the demand range.
According to data from Bitwise, corporate purchases of Bitcoin in 2025 have exceeded newly mined Bitcoin by a factor of 3.3. This significant gap between supply and demand signals a rising interest from institutional players in acquiring Bitcoin.
After reclaiming its $2 trillion market cap, Bitcoin surpassed Amazon and reentered the top five global financial assets. Just a week ago, Bitcoin was ranked seventh and only a month prior, it had barely managed to edge past Meta to secure a spot on the list.
The surge in Bitcoin’s price during late 2024 coincided with a sharp increase in the number of new meme coins being launched. There appears to be a clear correlation between Bitcoin’s price action and the number of tokens launched via meme coin launchpads on the Solana network.
Interestingly, this uptick in meme coin activity began in late March—well before Bitcoin’s price began its upward movement in mid-April. This early momentum is largely attributed to the rising popularity of newer launchpads such as Believe, LetsBonk, and Boop, which are now emerging as serious competitors to the well-known Pumpfun platform.

Bitcoin BTC price analysis - be careful📉 The cryptocurrency market is forming an "order" for "Red Monday".
On the OKX:BTCUSDT chart, the "Triple Top" pattern is probably nearing completion - its recognizable feature is the more lower central top and the right “powerful shake out” (for more details, if you are interested, you can read Encyclopedia of chart patterns/Thomas Bulkowski)
🆗 So, the minimum target for this pattern is $96100 per CRYPTOCAP:BTC
❗️ Confirmation of the "Triple Top" pattern development - after the base breakout and the inability to consolidate higher on the retest.
💰 Globally, we wrote our thoughts on the possible price of #Bitcoin in May/June a week earlier 👇
Also, to make trading decisions and determine which direction to trade, you need to analyze the situation on the charts:
1️⃣ BTC.D 👇
and
2️⃣ USDT.D 👇
_____________________
Did you like our analysis? Leave a comment, like, and follow to get more
btc . w4 . may . wOpen . LONGto catch everyone of guard, whom thinks we're crashing today:
. LONG: look for good tpo at nyOpen, of running aLow and pump to liquidate and grab liquidity
. SHORT: still on the table - but the LONG could be a runner

btc . w4 . may . wOpen . SHORTideally :
. good tpo and price not finding a floor during ny
SHORT
. ladder limits
. start pw.0.5
. end pwVAH - pdEQ
. withhold 30% of total order to add upon trade confirmation
. tp1 +1.5%
. tp 2 . mOpen . 94133.6 + 9%
- ride the momentum shift downwards

Bitcoin Not Looking Good At AllSome degree of 5 waves completed yesterday and reversal signs are there. Now, this 5 waves up could be just 1st leg of larger 5th or the 5th itself since this leg was 2.6 times of leg 1. Either way, we are heading towards 90K and if this was larger 5th that got complete then it's time for "serious worry", specially if you are a HODLer.

Bitcoin Entry & Risk Management Zones:
Entry Zone: 102,600 USDT (highlighted in orange)
Stop Loss (S/L): 101,500 USDT (red zone)
Take Profit (TP) Levels:
TP1: 103,750
TP2: 104,600
TP3: 105,500
TP4: 106,600
TP5: 108,200
------------------------------
After reaching TP1 - shift stop to entry

Deeper retracement is possible. 104-105.2 for short entryMorning folks,
So, last setup worked just partially - action started from 101K as suggested but BTC completed only 1.27 butterfly target, showing sharp reversal.
Current reversal is important because market is neither on some target, resistance or overbought. It means that reversal is driven by external factors. Although our long-term bullish view is still valid, with "at least" 110K target, the road to the target might be bumpy, with moderate pullback first.
It means that right now weekly/daily traders should sit on the hands and wait when retracement will be over. While daily/intraday traders could consider short entry from 104-105.2K resistance area by our view.
