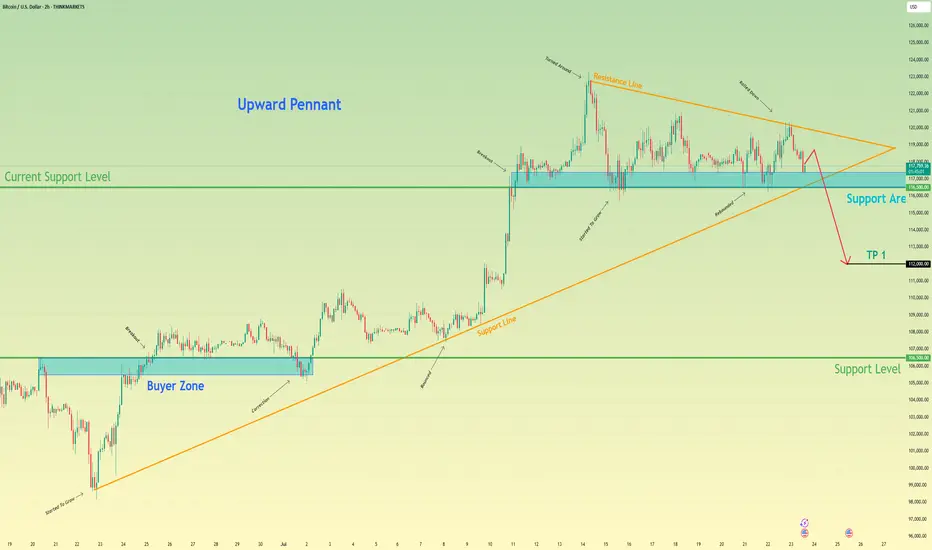
Bitcoin can start to decline and break support levelHello traders, I want share with you my opinion about Bitcoin. After completing a powerful upward impulse that originated from the buyer zone near 106500, the price action for BTC has transitioned into a corrective market phase. This consolidation has taken the form of an upward pennant, characterised by a narrowing trading range that suggests a significant directional move is forthcoming. Currently, the asset is undergoing a sequence of downward corrections within the pennant, exerting repeated pressure on the critical demand zone between 116500 and 117400. The importance of this zone is amplified by its confluence with the lower trend line of the formation itself. The primary working hypothesis is a bearish resolution, anticipating that persistent selling pressure will culminate in a decisive breakdown of this support. This event would act as a bearish breakout from the pennant, providing strong confirmation for the continuation of the downward impulsive momentum and shifting the local market structure. Therefore, the take-profit level is logically positioned at the 112000 mark. Please share this idea with your friends and click Boost 🚀
Disclaimer: As part of ThinkMarkets’ Influencer Program, I am sponsored to share and publish their charts in my analysis.
BTC-USD
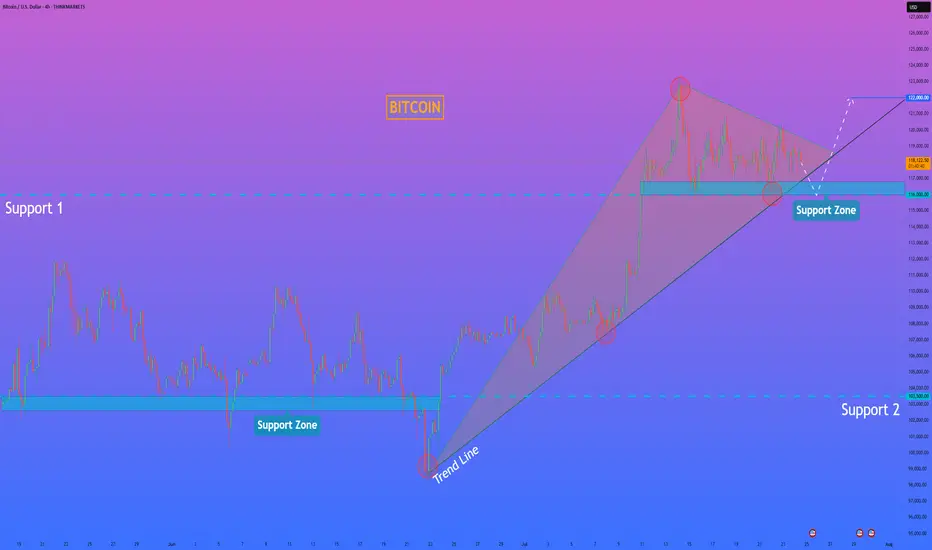
BITCOIN - Price can correct to support area and then start riseHi guys, this is my overview for BTCUSD, feel free to check it and write your feedback in comments👊
For a significant period, the price of Bitcoin was trading upwards within the confines of a rising channel.
Strong buying pressure led to a breakout above the channel's upper boundary, signaling an acceleration of the uptrend.
After this breakout, the upward momentum stalled, and the price entered a new phase of horizontal consolidation, forming a wide flat range.
The price recently tested the upper resistance of this range near $122800 and was rejected.
As a result, the asset is currently in a corrective move downwards, approaching the key support area located between $114000 and $115000
I expect that the price will find support at the bottom of this flat range, reverse its course, and begin a new rally back towards the top of the range at $122800
If this post is useful to you, you can support me with like/boost and advice in comments❤️
Disclaimer: As part of ThinkMarkets’ Influencer Program, I am sponsored to share and publish their charts in my analysis.

HelenP. I Bitcoin can fall to support zone and then start riseHi folks today I'm prepared for you Bitcoin analytics. If we look at the Bitcoin chart, the most prominent feature is the formation of a large bullish pennant following a strong upward impulse. This type of consolidation pattern typically suggests that the market is pausing to gather strength before continuing in the direction of the primary trend. The price is currently consolidating within the boundaries of this pennant, which are defined by an upper resistance line and a strong ascending trend line acting as the lower support. It is crucial to note the confluence of this ascending trend line with the horizontal support zone between 116000 and 116800, creating a powerful area of potential support. My analysis is based on the expectation that the price will make a final test of this key support confluence. I believe that a dip towards the 116000 - 116800 zone will be met with strong buying interest. A clear rejection from this area, confirming that buyers are defending both the horizontal and dynamic support, would be the critical condition validating a long position. A successful bounce should provide the catalyst for a bullish breakout from the top of the pennant, signaling the resumption of the uptrend. Therefore, I have set the primary goal for this subsequent upward move at the 122000 level, a logical target that would confirm the continuation of the bullish market structure. If you like my analytics you may support me with your like/comment ❤️
Disclaimer: As part of ThinkMarkets’ Influencer Program, I am sponsored to share and publish their charts in my analysis.
HelenP. I Bitcoin will rebound from trend line and rise to $123KHi folks today I'm prepared for you Bitcoin analytics. If we look at the chart, we can see a very clear and long-term bullish structure. The entire uptrend is supported by a major ascending trend line that has acted as a reliable foundation for the price for a significant amount of time. Currently, the price is consolidating above this crucial trend line and is interacting with the key support zone between 117500 and 116700 points. I believe that the most probable scenario here is a brief corrective move downwards for the price to properly retest the main ascending trend line. This type of retest is often a healthy sign in a strong trend, as it allows for the confirmation of support and gathers momentum for the next leg up. A strong rebound from this trend line would serve as a powerful signal that the buyers are still in control. Therefore, once the price confirms its bounce from this dynamic support, the path should be clear for a continuation of the uptrend. For this reason, my primary goal for this trade idea is set at the 123000 points. If you like my analytics you may support me with your like/comment ❤️
Disclaimer: As part of ThinkMarkets’ Influencer Program, I am sponsored to share and publish their charts in my analysis.

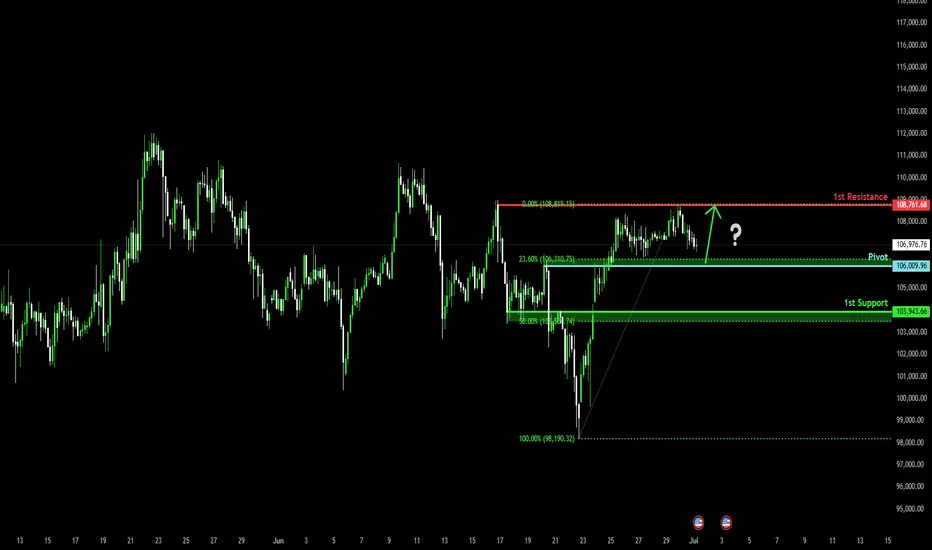
Bullish bounce?The Bitcoin (BTC/USD) is falling toward the pivot and could bounce to the 1st resistance.
Pivot: 111,241.55
1st Support: 98,383.98
1st Resistance: 127,752.45
Risk Warning:
Trading Forex and CFDs carries a high level of risk to your capital and you should only trade with money you can afford to lose. Trading Forex and CFDs may not be suitable for all investors, so please ensure that you fully understand the risks involved and seek independent advice if necessary.
Disclaimer:
The above opinions given constitute general market commentary, and do not constitute the opinion or advice of IC Markets or any form of personal or investment advice.
Any opinions, news, research, analyses, prices, other information, or links to third-party sites contained on this website are provided on an "as-is" basis, are intended only to be informative, is not an advice nor a recommendation, nor research, or a record of our trading prices, or an offer of, or solicitation for a transaction in any financial instrument and thus should not be treated as such. The information provided does not involve any specific investment objectives, financial situation and needs of any specific person who may receive it. Please be aware, that past performance is not a reliable indicator of future performance and/or results. Past Performance or Forward-looking scenarios based upon the reasonable beliefs of the third-party provider are not a guarantee of future performance. Actual results may differ materially from those anticipated in forward-looking or past performance statements. IC Markets makes no representation or warranty and assumes no liability as to the accuracy or completeness of the information provided, nor any loss arising from any investment based on a recommendation, forecast or any information supplied by any third-party.

BITCOIN - Price can bounce up from support line to $125000Hi guys, this is my overview for BTCUSD, feel free to check it and write your feedback in comments👊
For a long time, the price was trading sideways inside a wide flat range between the $99000 support area and the $112000 resistance level.
After accumulating volume, bitcoin made a strong upward impulse and performed a breakout, pushing above the top of the flat.
Following this movement, the price action began to form a rising wedge pattern, moving between its clear support and resistance lines.
Recently, price tested the resistance line of the wedge and then started a predictable correction back down towards support.
Now, BTC is approaching the support line of the wedge, which aligns with the important horizontal support area around $112000-$113500.
I expect that the price can test this support line and then bounce up to the $125000 resistance line of the wedge.
If this post is useful to you, you can support me with like/boost and advice in comments❤️
Disclaimer: As part of ThinkMarkets’ Influencer Program, I am sponsored to share and publish their charts in my analysis.

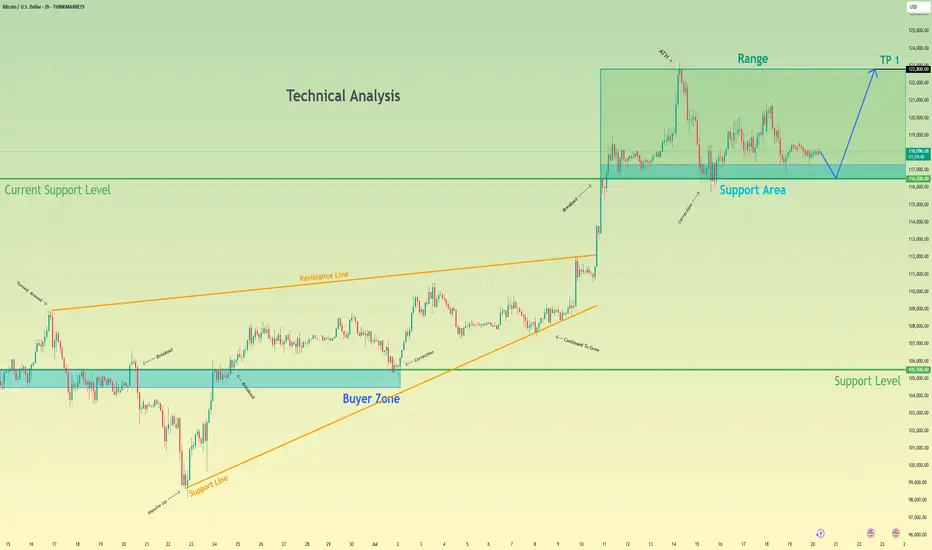
Bitcoin may bounce up from support area to 122800 pointsHello traders, I want share with you my opinion about Bitcoin. Analyzing the broader market context on the BTC chart, the past price action has carved out two significant technical structures: a wide trading range and a larger upward wedge pattern. The formation of this wedge indicates a generally positive market sentiment, though the narrowing price swings suggest a decrease in upward momentum. The foundation of the current structure was established around the buyer zone of 105500 - 104500, a level that has historically proven to be a robust floor. This historical behavior provides a critical reference for our hypothesis. Currently, we are observing bitcoin's price action closely, interacting with the current support area, located between 116500 and 117300. The character of the movement here is largely corrective and consolidative, pointing to a state of temporary equilibrium. This consolidation near the lower boundary of the wedge is a pivotal point. My thinking is that a final, brief dip to thoroughly test the 116500 - 117300 support area is a high-probability scenario. Such a move would effectively absorb remaining sell-side liquidity before a reversal. We can then anticipate an impulsive move upwards across the range. Therefore, the logical take-profit for this long position is set at 122800 points, as this level marks the upper resistance of the range and a natural target. Please share this idea with your friends and click Boost 🚀
Disclaimer: As part of ThinkMarkets’ Influencer Program, I am sponsored to share and publish their charts in my analysis.
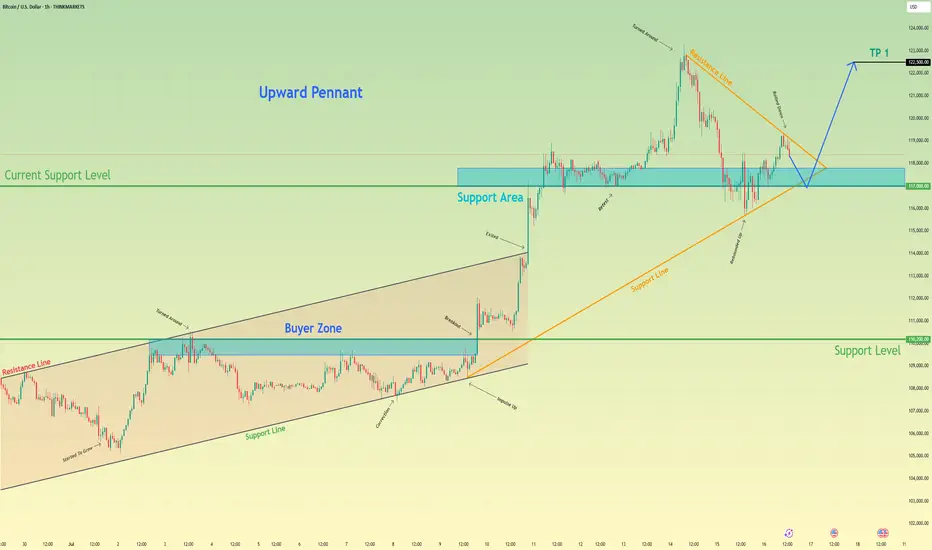
Bitcoin may exit of pennant and then rebound up of support areaHello traders, I want share with you my opinion about Bitcoin. Earlier, the price was moving inside an upward channel, respecting both the resistance and support boundaries. After reaching the buyer zone (110200–109500 points), BTC made a strong impulse up, breaking out of the channel and entering a new phase of growth. This breakout led to the formation of a bullish pennant, which often signals a continuation of the uptrend. Right now, the price is testing the support area between 117000 and 117800, which previously acted as a breakout zone and now serves as a current support level (117000). The structure shows that this level has already worked as a rebound zone multiple times. In my opinion, BTC may continue the correction toward this support area, potentially exiting the pennant to the downside for a short-term pull-back. After that, I expect a new upward movement, targeting the next local high. That’s why I set my TP at 122500 points, which is just below the recent ATH. Given the impulse move, strong support zone, breakout from the channel, and the bullish pennant pattern, I remain bullish and expect BTC to resume its upward trend soon. Please share this idea with your friends and click Boost 🚀
Disclaimer: As part of ThinkMarkets’ Influencer Program, I am sponsored to share and publish their charts in my analysis.
HelenP. I Bitcoin will go to a correction after a strong impulseHi folks today I'm prepared for you Bitcoin analytics. If we look at the chart, we can see that the price has recently made a powerful impulse upward, breaking out of a long consolidation range between 110500 and 102500. This range acted as a strong accumulation zone, where the price bounced multiple times from both support levels. After the breakout, Bitcoin gained momentum and pushed sharply toward the 122000 mark. Now, after this sharp rally, I believe a correction is highly probable. Often, after such strong bullish moves, the market tends to pull back to retest the trend line or previous breakout zones. In this case, the trend line has been respected several times and now aligns with the 117500 area, which also acts as local support. That’s why I consider this zone to be a logical target for the correction. I expect BTCUSD can drop from the current highs and retest the trend line near 117500 points - that is my main goal for this setup. If the trend line holds, buyers may return to the market and push price higher again. Given the strong impulse, the breakout from consolidation, and the importance of the trend line, I remain bearish short-term and expect a drop toward 117500 points. If you like my analytics you may support me with your like/comment ❤️
Disclaimer: As part of ThinkMarkets’ Influencer Program, I am sponsored to share and publish their charts in my analysis.

Bitcoin may make correction movement to support levelHello traders, I want share with you my opinion about Bitcoin. Price recently printed a new ATH at 118800 points and then began to show signs of correction. Before this breakout, the price was stuck in a long downward channel, where it bounced inside the buyer zone (103000–103800) several times and reversed upward. After the final breakout, BTC entered a range phase between the support level (103800) and the support area (110300–111300), building energy before the massive move. Once the price escaped this range, a strong impulse up followed, pushing BTC above all major levels and reaching a new high. However, after hitting the ATH, the price started to stall and consolidate. Currently, we can see signs of weakness at the top — the structure is forming lower highs and looks unstable, which may indicate a potential retracement. Now the price is trading above the support area, but I expect a corrective move back toward the current support level at 110300. This level aligns with the top of the previous range and now acts as strong demand. That’s why I’ve set my TP at 110300 level — right at the beginning of potential buyer interest. Please share this idea with your friends and click Boost 🚀
Disclaimer: As part of ThinkMarkets’ Influencer Program, I am sponsored to share and publish their charts in my analysis.

Bearish reversal off Fibonacci confluence?The Bitcoin (BTC/USD) is rising towards the pivot and could reverse to the 1st support which is a pullback support.
Pivot: 121,983.11
1st Support: 112,086.50
1st Resistance: 128,114.70
Risk Warning:
Trading Forex and CFDs carries a high level of risk to your capital and you should only trade with money you can afford to lose. Trading Forex and CFDs may not be suitable for all investors, so please ensure that you fully understand the risks involved and seek independent advice if necessary.
Disclaimer:
The above opinions given constitute general market commentary, and do not constitute the opinion or advice of IC Markets or any form of personal or investment advice.
Any opinions, news, research, analyses, prices, other information, or links to third-party sites contained on this website are provided on an "as-is" basis, are intended only to be informative, is not an advice nor a recommendation, nor research, or a record of our trading prices, or an offer of, or solicitation for a transaction in any financial instrument and thus should not be treated as such. The information provided does not involve any specific investment objectives, financial situation and needs of any specific person who may receive it. Please be aware, that past performance is not a reliable indicator of future performance and/or results. Past Performance or Forward-looking scenarios based upon the reasonable beliefs of the third-party provider are not a guarantee of future performance. Actual results may differ materially from those anticipated in forward-looking or past performance statements. IC Markets makes no representation or warranty and assumes no liability as to the accuracy or completeness of the information provided, nor any loss arising from any investment based on a recommendation, forecast or any information supplied by any third-party.

BTCUSDT – Bullish Momentum MaintainedBitcoin is maintaining a solid bullish structure after breaking out of its recent accumulation zone and filling the FVG gap around $110,400. On the H4 chart, BTCUSDT has just completed a successful retest near the dynamic support zone and is now aiming for the potential resistance at $112,949 – where it intersects with a long-term trendline. A breakout above this level could signal the start of a new expansion phase.
Major news from yesterday regarding new capital inflows into several approved spot Bitcoin ETFs, combined with rising expectations of a Fed rate cut later in Q3, are fueling strong buying momentum. This rally could gain even more strength if crypto markets continue to attract liquidity.

Bitcoin can rebound up from support line of upward wedgeHello traders, I want share with you my opinion about Bitcoin. In this chart, we can see how the price dropped from the 102800 support level, which coincided with the buyer zone, and later entered to wedge upward. In this pattern, price made an impulse up from the support line of the wedge pattern and broke the 102800 support level, after making a retest, and continued to move up. Bitcoin rose to the current support level, which coincided with a support area and even entered this area, but soon turned around and fell below. Next, price rose to this area again and then made a correction movement, after which it turned around and made an impulse up to the resistance line of the wedge, breaking the 108000 level. After this movement, the price bounced from this line and fell back to the current support level, where it some time traded in the support area. Later price rebounded and continued to move up. Now, I expect that BTC can correct to support line of the wedge and then rise to the resistance line of this pattern. That's why I set my TP at the 112600 points, which coincided with this line. Please share this idea with your friends and click Boost 🚀
Disclaimer: As part of ThinkMarkets’ Influencer Program, I am sponsored to share and publish their charts in my analysis.

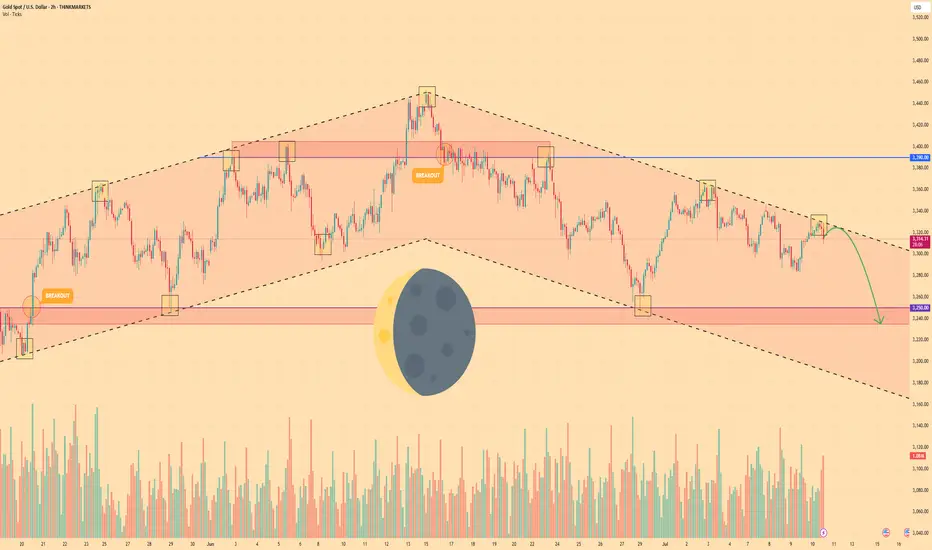
GOLD - Price can bounce down from resistance line of channelHi guys, this is my overview for XAUUSD, feel free to check it and write your feedback in comments👊
Gold broke out of its long-term rising channel and hit $3390 resistance level before momentum definitively stalled.
That failure marked a shift in control, as sellers forced price into a falling channel, establishing lower highs and lower lows.
Price fell to support level, after whcih it turned around and bounced up to resistance line of falling channel.
Now, Gold tests the upper boundary of the falling channel near $3318, where each bounce has been capped by declining volume.
Key support lies in the $3250 - $3235 area, aligned with multiple prior demand tests and the former rising-channel floor.
I expect Gold to reverse from the channel resistance and slide toward $3235, decisively breaking below the $3250 level.
If this post is useful to you, you can support me with like/boost and advice in comments❤️
Disclaimer: As part of ThinkMarkets’ Influencer Program, I am sponsored to share and publish their charts in my analysis.
HelenP. I Bitcoin can continue to fall and break support levelHi folks today I'm prepared for you Bitcoin analytics. If we look at the chart, we can see that Bitcoin has been trading inside a well-defined upward channel. The price recently touched the upper boundary of this channel for the second time and formed a clear reaction, indicating strong resistance. After this, BTCUSD started to pull back from the resistance zone around 110300 - 109800 points. At the moment, it is trading slightly above this support area, but momentum is already shifting downward. Given this structure, I believe Bitcoin is likely to continue its decline and break below the support zone. The previous upward impulse has already lost steam, and there are no signs of strong buying activity around the current levels. The next logical target in this scenario is the lower boundary of the channel, near the 107500 level, where the trend line acts as dynamic support. This level has historically served as a rebound point, and I expect it to do so again. My current idea is short, aiming for a move down toward the trend line. If BTCUSD breaks through the first support and confirms the weakness, the price could fall quickly and test the next support area around 105600 - 105000 points. But for now, I will be watching the 107500 level closely. If you like my analytics you may support me with your like/comment ❤️
Disclaimer: As part of ThinkMarkets’ Influencer Program, I am sponsored to share and publish their charts in my analysis.

BTCUSDT – Calm Before the BreakoutBitcoin is holding firmly above the ascending trendline, consolidating within the accumulation range of $98,000 to $117,000. The current structure suggests that buyers remain in control, especially after a strong rebound from the $98,450 support zone.
In terms of news, BTC has been slightly affected by market concerns over new U.S. tariffs. However, on-chain data still shows strong accumulation around the $108,000 level. If this base holds, BTCUSDT could break out toward the $117,424 target in the near term. Conversely, if the trendline fails, the $98,000 level will be the final stronghold for the bulls.

BTCUSDT – Ready to Launch from Accumulation Zone?BTCUSDT is consolidating around the $101,000 FVG zone – a previously strong launchpad. Price structure remains bullish, forming higher lows and showing a healthy throwback pattern.
If the $101,448 level holds, the next target could be $116,000 – a potential 14% rally in two weeks.
Fundamentals support the upside: expectations of Fed rate cuts and renewed ETF inflows are fueling fresh momentum for Bitcoin.
Still, watch for price action confirmation – and always manage your risk!

Bullish bounce for the Bitcoin?The price is falling towards the pivot which is a pullback support and could bounce to the 1st resistance.
Pivot: 108,797.87
1st Support: 106,083.15
1st Resistance: 112,003.20
Risk Warning:
Trading Forex and CFDs carries a high level of risk to your capital and you should only trade with money you can afford to lose. Trading Forex and CFDs may not be suitable for all investors, so please ensure that you fully understand the risks involved and seek independent advice if necessary.
Disclaimer:
The above opinions given constitute general market commentary, and do not constitute the opinion or advice of IC Markets or any form of personal or investment advice.
Any opinions, news, research, analyses, prices, other information, or links to third-party sites contained on this website are provided on an "as-is" basis, are intended only to be informative, is not an advice nor a recommendation, nor research, or a record of our trading prices, or an offer of, or solicitation for a transaction in any financial instrument and thus should not be treated as such. The information provided does not involve any specific investment objectives, financial situation and needs of any specific person who may receive it. Please be aware, that past performance is not a reliable indicator of future performance and/or results. Past Performance or Forward-looking scenarios based upon the reasonable beliefs of the third-party provider are not a guarantee of future performance. Actual results may differ materially from those anticipated in forward-looking or past performance statements. IC Markets makes no representation or warranty and assumes no liability as to the accuracy or completeness of the information provided, nor any loss arising from any investment based on a recommendation, forecast or any information supplied by any third-party.

Bitcoin will drop from resistance level and fall to 103500 levelHello traders, I want share with you my opinion about Bitcoin. Some days ago, price entered the pennant, where it turned around from the seller zone, which coincided with the resistance level, and dropped to the 103500 support level. Then it bounced and tried to grow, but soon failed and dropped below the 103500 support level, which coincided with the buyer zone and reached the support line of the pennant. Following this movement, BTC experienced an upward impulse, breaking the 103,500 support level and subsequently exiting the pennant pattern, before rising to the resistance level. Price broke this level and then started to decline inside another pennant pattern. In this pattern, the price dropped top 103500 support level again and then tried to bounce back, but failed and continued to decline. In a short time, it fell to the support level, broke it, and then fell to the support line of the pennant. Next, BTC turned around and repeated an impulse up to the resistance line of the pennant and exited from this pattern. Then it rose to the seller zone, where it rebounded from it and fell, but recently it rebounded and started to grow. Now, I expect that price will reach the resistance level and then drop to the 103500 support level. For this case, this level is my TP. Please share this idea with your friends and click Boost 🚀
Disclaimer: As part of ThinkMarkets’ Influencer Program, I am sponsored to share and publish their charts in my analysis.

HelenP. I Bitcoin may continue grow and break resistance levelHi folks today I'm prepared for you Bitcoin analytics. After looking at this chart, we can see how the price broke the resistance level, which coincided with the resistance zone, and continued to move down next. When the price almost reached the support level, it turned around and tried to grow, but failed and dropped to the support zone. After this movement, BTC turned around and made an impulse up to the resistance zone, breaking the resistance level one more time. Then it reached the trend line and started to decline in a broadening wedge, where it broke the resistance level again. Later, the price even declined below the support level, breaking this level too and falling to the support line of the wedge pattern. Next, price turned around and made a strong impulse up to the resistance level, thereby breaking the support level with the trend line, exiting from the broadening wedge too. Bitcoin made a retest of the trend line and then continued to grow. In my opinion, BTCUSD will correct to almost to trend line and then rise to the resistance level. Then it can break this level and continue to move up; therefore, I set my goal at 111000 points. If you like my analytics you may support me with your like/comment ❤️
Disclaimer: As part of ThinkMarkets’ Influencer Program, I am sponsored to share and publish their charts in my analysis.

Bullish bounce?The Bitcoin (BTC/USD) is falling towards the pivot which acts as a pullback support and could bounce to the 1st resistance.
Pivot: 106,009.96
1st Support: 103.943.66
1st Resistance: 108,761.68
Risk Warning:
Trading Forex and CFDs carries a high level of risk to your capital and you should only trade with money you can afford to lose. Trading Forex and CFDs may not be suitable for all investors, so please ensure that you fully understand the risks involved and seek independent advice if necessary.
Disclaimer:
The above opinions given constitute general market commentary, and do not constitute the opinion or advice of IC Markets or any form of personal or investment advice.
Any opinions, news, research, analyses, prices, other information, or links to third-party sites contained on this website are provided on an "as-is" basis, are intended only to be informative, is not an advice nor a recommendation, nor research, or a record of our trading prices, or an offer of, or solicitation for a transaction in any financial instrument and thus should not be treated as such. The information provided does not involve any specific investment objectives, financial situation and needs of any specific person who may receive it. Please be aware, that past performance is not a reliable indicator of future performance and/or results. Past Performance or Forward-looking scenarios based upon the reasonable beliefs of the third-party provider are not a guarantee of future performance. Actual results may differ materially from those anticipated in forward-looking or past performance statements. IC Markets makes no representation or warranty and assumes no liability as to the accuracy or completeness of the information provided, nor any loss arising from any investment based on a recommendation, forecast or any information supplied by any third-party.
HelenP. I Bitcoin can drop from resistance levelHi folks today I'm prepared for you Bitcoin analytics. If we examine the chart, we can see that the price has approached a significant resistance zone between 108200 and 108800. This area previously acted as a ceiling for the price, and now coincides with the retest of the broken trend line from above. After a strong bullish push from the support zone near 103000, the price is currently consolidating just below resistance, which often signals hesitation and potential reversal pressure. Earlier, we observed a period of consolidation around the support zone, followed by a breakout that broke above the trend line. However, the current structure suggests that the breakout may have been temporary. With multiple signs of slowing momentum and price failing to break convincingly through the resistance, a bearish move from this level becomes increasingly likely. Given the context, I expect BTCUSD to reject this resistance and move downward toward the 103000 support level again. That is my current goal, as I anticipate the price to complete a corrective wave in line with the overall structure. If you like my analytics you may support me with your like/comment ❤️
Disclaimer: As part of ThinkMarkets’ Influencer Program, I am sponsored to share and publish their charts in my analysis.

Bearish reversal?The Bitcoin (BTC/USD) is reacting off the pivot and could drop to the 1st support.
Pivot: 108,836.36
1st Support: 103,622.00
1st Resistance: 112,088.89
Risk Warning:
Trading Forex and CFDs carries a high level of risk to your capital and you should only trade with money you can afford to lose. Trading Forex and CFDs may not be suitable for all investors, so please ensure that you fully understand the risks involved and seek independent advice if necessary.
Disclaimer:
The above opinions given constitute general market commentary, and do not constitute the opinion or advice of IC Markets or any form of personal or investment advice.
Any opinions, news, research, analyses, prices, other information, or links to third-party sites contained on this website are provided on an "as-is" basis, are intended only to be informative, is not an advice nor a recommendation, nor research, or a record of our trading prices, or an offer of, or solicitation for a transaction in any financial instrument and thus should not be treated as such. The information provided does not involve any specific investment objectives, financial situation and needs of any specific person who may receive it. Please be aware, that past performance is not a reliable indicator of future performance and/or results. Past Performance or Forward-looking scenarios based upon the reasonable beliefs of the third-party provider are not a guarantee of future performance. Actual results may differ materially from those anticipated in forward-looking or past performance statements. IC Markets makes no representation or warranty and assumes no liability as to the accuracy or completeness of the information provided, nor any loss arising from any investment based on a recommendation, forecast or any information supplied by any third-party.
