BTCUSDT – Rebound from trendline, targeting 115,300On the daily chart, BTCUSDT has bounced from a confluence support zone around 105,200, where the rising trendline meets the FVG, confirming that the bullish structure remains intact. The current price pattern suggests a continuation of the uptrend, with a short-term target at the 115,300 resistance zone — a level that has previously rejected price multiple times.
If this level is broken, momentum could extend toward the 120,000 area in the medium term. As long as the price holds above the trendline, the bullish outlook remains valid.
On the news front, market sentiment is improving as Bitcoin spot ETFs in the U.S. show signs of renewed inflows, coupled with growing expectations that the Fed might pause rate hikes due to recent signs of economic weakness.
BTC-USD

Bullish bounce off pullback support?The Bitcoin (BTC/USD) is reacting off the pivot and could bounce to the 1st resistance which acts as a pullback resistance.
Pivot: 98,383.98
1st Support: 94,101.85
1st Resistance: 108,545.92
Risk Warning:
Trading Forex and CFDs carries a high level of risk to your capital and you should only trade with money you can afford to lose. Trading Forex and CFDs may not be suitable for all investors, so please ensure that you fully understand the risks involved and seek independent advice if necessary.
Disclaimer:
The above opinions given constitute general market commentary, and do not constitute the opinion or advice of IC Markets or any form of personal or investment advice.
Any opinions, news, research, analyses, prices, other information, or links to third-party sites contained on this website are provided on an "as-is" basis, are intended only to be informative, is not an advice nor a recommendation, nor research, or a record of our trading prices, or an offer of, or solicitation for a transaction in any financial instrument and thus should not be treated as such. The information provided does not involve any specific investment objectives, financial situation and needs of any specific person who may receive it. Please be aware, that past performance is not a reliable indicator of future performance and/or results. Past Performance or Forward-looking scenarios based upon the reasonable beliefs of the third-party provider are not a guarantee of future performance. Actual results may differ materially from those anticipated in forward-looking or past performance statements. IC Markets makes no representation or warranty and assumes no liability as to the accuracy or completeness of the information provided, nor any loss arising from any investment based on a recommendation, forecast or any information supplied by any third-party.

BTC goes wild. But there’s worse. With PipGuard.“BTC goes wild. But there’s worse. With PipGuard.”
Hola, hi my friends! How are you doing? Hope you're doing amaziiiing!
Today we’re having a little chat about Bitcoin, shall we?
I admit it: this time I messed up and took the USDT spot chart instead of USD… but heeey, I’m lazy and it doesn’t really matter. What counts is the trend, RIIIGHT?
But first… boost me and drop a comment <3
📈 The trend is your friend... until it messes with you
🔼 If it goes up, it goes up
BTC is still in a strong bullish trend long term.
Nothing new? Maybe, but if it keeps going… it’s aiming for new highs. Simple.
And if not today, then tomorrow. Your loss if you miss it.
🧠 Always keep one eye on assumptions and the other on objectivity. The market will thank you.
🔽 If it drops... better be ready
And if it decides to go down?
Here come the targets: 102k , 100k , and that delicious 94k I’d love to see.
Why? Because even crypto needs a break.
And each level is potentially a reversal point , you know that already, right?
🧱 Supports, resistances... and your debts
• Resistance: 109k (rounded like those 100€ you still owe me haha)
• Serious support: 78k
• Cuddly support: 88k
• The rest is noise.
• Trend still strong, yes. But if you’re not watching… someone else will watch your wallet.
🔥 The market today? On fire, as always
• BTC did its usual trick: touched 106k , then dropped below 103k
• Liquidations? BOOM 💣: over 450 million dollars in longs
• The market shook like a noob on their first short
🌍 War, hacks, and chaos: BTC loves it
• Israelis flying around Iran bombing targets
• Iranians firing back missiles
• Israeli hackers broke into Nobitex and BURNED 90M in crypto
• The White House is silent, but the US has a “Bitcoin Reserve”
• Result? BTC pumps, dumps, pumps again… you tell me
🐍 Juicy GOSSIP
• In New York, two crypto bros kidnapped an Italian guy from Rivoli and tortured him for 17 days to get his wallet password
• Electroshock. Power saw. “Wild” sessions with madams & friends
• All this between parties, bondage, and wheelchairs
• The guy, alive by miracle, is now the new symbol of “ never give your key to anyone ”
📊 Technical Recap
🧱 Resistance: 109k
🪨 Supports: 88k / 78k
💣 Liquidations: +450M long
📉 Price Range: 106k ➝ below 103k
🌍 Geopolitics: Real bombs & BTC
😈 Gossip: Crypto-bros under pressure 😱
😂 The curtain drops…
My fingers hurt. And not just from typing… oops, I said it? I did.
If you had fun, boost and comment .
If not… next time I’ll give you support at 69k, that’ll teach you.
A hug from your loyal lunatic, PipGuard 🤣🧨

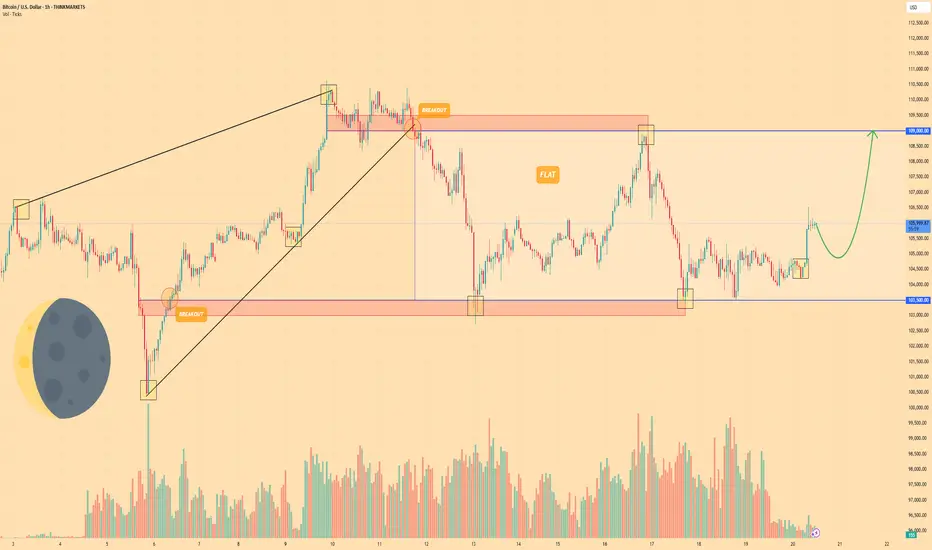
BITCOIN - Price can continue grow inside flat to $109000 levelHi guys, this is my overview for BTCUSD, feel free to check it and write your feedback in comments👊
A few days ago, the price entered a wedge, declining below the $103500 level and then making a strong impulse up.
Next, price broke $103500 level one more time and rose to resistance line of wedge, after which started to decline.
BTC broke $109000 level and started to trades inside a flat, where it declined to support level and then bounced up.
Price rose to resistance level, which is top part of flat, and then at once dropped back and started trading close.
But some time later, price bounced from this level and started to grow, and even now it continues to grow.
So, I think that BTC can make a small correction movement and then continue to grow to $109000 level.
If this post is useful to you, you can support me with like/boost and advice in comments❤️
Disclaimer: As part of ThinkMarkets’ Influencer Program, I am sponsored to share and publish their charts in my analysis.
BTCUSDT – Price Poised to Break Descending ChannelBTCUSDT has been maintaining a series of higher lows since early May, consistently rebounding from its dynamic support trendline. Currently, the price is consolidating just below the descending channel resistance around the 108,000 USDT level. A clear double-bottom pattern accompanied by solid recovery momentum suggests a potential breakout from the prolonged correction phase that has persisted throughout June.
If BTC breaks above the descending trendline, the next target could be the major resistance zone near 113,000 USDT.
On the news front, the market is reacting positively to BlackRock’s announcement of expanding investment in crypto ETF products. At the same time, recent soft U.S. inflation data has strengthened expectations that the Fed may halt its tightening cycle. This combination is improving investor sentiment and driving renewed interest in risk assets like Bitcoin.

Bearish reversal?The Bitcoin (BTC/USD) is rising towards the pivot which is a pullback support and could reverse to the 1st support which is also a pullback support.
Pivot: 106,391.59
1st Support: 103,654.27
1st Resistance: 108,761.68
Risk Warning:
Trading Forex and CFDs carries a high level of risk to your capital and you should only trade with money you can afford to lose. Trading Forex and CFDs may not be suitable for all investors, so please ensure that you fully understand the risks involved and seek independent advice if necessary.
Disclaimer:
The above opinions given constitute general market commentary, and do not constitute the opinion or advice of IC Markets or any form of personal or investment advice.
Any opinions, news, research, analyses, prices, other information, or links to third-party sites contained on this website are provided on an "as-is" basis, are intended only to be informative, is not an advice nor a recommendation, nor research, or a record of our trading prices, or an offer of, or solicitation for a transaction in any financial instrument and thus should not be treated as such. The information provided does not involve any specific investment objectives, financial situation and needs of any specific person who may receive it. Please be aware, that past performance is not a reliable indicator of future performance and/or results. Past Performance or Forward-looking scenarios based upon the reasonable beliefs of the third-party provider are not a guarantee of future performance. Actual results may differ materially from those anticipated in forward-looking or past performance statements. IC Markets makes no representation or warranty and assumes no liability as to the accuracy or completeness of the information provided, nor any loss arising from any investment based on a recommendation, forecast or any information supplied by any third-party.

BTC USD 180K BIG HOW?Trends and price targets is how, but realistically, it looks like 134k in the short term.
Drop is wicked if it were to occur, takes price to literally 12k, which you want to go all in if that occurs.
55k is another drop zone.
Otherwise, it looks fairly bullish.
buy zone marked in green,
sell in red.
watch the trends
and price targets are pretty accurate usually.
good luck!!
Custom charts by request.

Bullish bounce?The Bitcoin (BTC/USD) is falling towards the pivot and could bounce to the 1st resistance.
Pivot: 101,082.81
1st Support: 94,030.59
1st Resistance: 110,969.18
Risk Warning:
Trading Forex and CFDs carries a high level of risk to your capital and you should only trade with money you can afford to lose. Trading Forex and CFDs may not be suitable for all investors, so please ensure that you fully understand the risks involved and seek independent advice if necessary.
Disclaimer:
The above opinions given constitute general market commentary, and do not constitute the opinion or advice of IC Markets or any form of personal or investment advice.
Any opinions, news, research, analyses, prices, other information, or links to third-party sites contained on this website are provided on an "as-is" basis, are intended only to be informative, is not an advice nor a recommendation, nor research, or a record of our trading prices, or an offer of, or solicitation for a transaction in any financial instrument and thus should not be treated as such. The information provided does not involve any specific investment objectives, financial situation and needs of any specific person who may receive it. Please be aware, that past performance is not a reliable indicator of future performance and/or results. Past Performance or Forward-looking scenarios based upon the reasonable beliefs of the third-party provider are not a guarantee of future performance. Actual results may differ materially from those anticipated in forward-looking or past performance statements. IC Markets makes no representation or warranty and assumes no liability as to the accuracy or completeness of the information provided, nor any loss arising from any investment based on a recommendation, forecast or any information supplied by any third-party.

Weak Pullback, Bears in Control | Will the $100K Zone Hold? BTCUSD – Weak Pullback, Bears in Control | Will the $100K Zone Hold?
🌍 Macro & Fundamental Outlook
Bitcoin continues to face downside pressure after failing to hold above the key $108K resistance. Several macro factors are influencing sentiment:
📉 US bond yields are rising again, as markets expect the Fed to delay rate cuts. This adds pressure on risk assets like BTC.
🪙 Bitcoin Spot ETF inflows remain positive, but are currently not strong enough to counter short-term selling pressure.
💵 The DXY (US Dollar Index) is recovering, as investors flee to USD amid geopolitical volatility in the Middle East.
📊 Institutional liquidity is thinning across exchanges, adding to intraday volatility.
📉 Technical Analysis – H1 Chart
🔹 Trend Structure:
BTC is now firmly in a short-term downtrend, trading below the descending trendline and all key moving averages (EMA 34, 89, 200).
Rejection from every pullback suggests that sellers are still in control.
🔹 Key Price Zones:
Bearish FVG Resistance: 106,096 – 107,004
First Support Zone: 102,821
Major Support Zone: 101,539 → 100,419
A clean break below 100K could open the door to 98,000 and below
🔹 Momentum:
RSI is neutral, hovering around the mid-40s without strong divergence signals.
Selling volume is increasing but not yet explosive — indicating the market may be awaiting a macro catalyst.
🧠 Market Sentiment
Traders are currently in “wait-and-see” mode, eyeing the next round of macroeconomic data and potential Fed commentary.
Short-term profit-taking is dominant after last week’s sharp rally.
Overall sentiment: Bearish short-term – Neutral mid-term – Bullish long-term
🎯 Trade Setup Ideas
🔻 SELL if price retests FVG and gets rejected
Entry: 106,000 – 107,000
Stop-Loss: 107,500
Targets: 102,821 → 101,539 → 100,419
🔹 BUY if price reacts strongly from 100,419 – 101,500
Entry: 100,500 – 100,800
Stop-Loss: 99,800
Targets: 102,800 → 104,400 → 106,000
Preference is given to selling the rally in the short term. Buying should only be considered on confirmed reversal signals at key support.
✅ Conclusion
BTCUSD is currently in a corrective phase, with bears maintaining control. The key level to watch is the $100,419 support zone, which may determine whether Bitcoin maintains its medium-term bullish structure or breaks further. Discipline and confirmation are crucial in this volatile environment.
📌 Strategy Focus: Look to sell rallies toward resistance; buy only on confirmed bounce from strong support zones.

Potential bearish drop?The Bitcoin (BTC/USD) is rising towards the pivot and could drop to the 61.8% Fibonacci support.
Pivot: 107,000.93
1st Support: 104,300.41
1st Resistance: 108,341.47
Risk Warning:
Trading Forex and CFDs carries a high level of risk to your capital and you should only trade with money you can afford to lose. Trading Forex and CFDs may not be suitable for all investors, so please ensure that you fully understand the risks involved and seek independent advice if necessary.
Disclaimer:
The above opinions given constitute general market commentary, and do not constitute the opinion or advice of IC Markets or any form of personal or investment advice.
Any opinions, news, research, analyses, prices, other information, or links to third-party sites contained on this website are provided on an "as-is" basis, are intended only to be informative, is not an advice nor a recommendation, nor research, or a record of our trading prices, or an offer of, or solicitation for a transaction in any financial instrument and thus should not be treated as such. The information provided does not involve any specific investment objectives, financial situation and needs of any specific person who may receive it. Please be aware, that past performance is not a reliable indicator of future performance and/or results. Past Performance or Forward-looking scenarios based upon the reasonable beliefs of the third-party provider are not a guarantee of future performance. Actual results may differ materially from those anticipated in forward-looking or past performance statements. IC Markets makes no representation or warranty and assumes no liability as to the accuracy or completeness of the information provided, nor any loss arising from any investment based on a recommendation, forecast or any information supplied by any third-party.

Bullish bounce?Bitcoin (BTC/USD) has bounced off the pivot and oculd rise to the 1st resistance.
Pivot: 108,446.67
1st Support: 106,491.59
1st Resistance: 111,566.95
Risk Warning:
Trading Forex and CFDs carries a high level of risk to your capital and you should only trade with money you can afford to lose. Trading Forex and CFDs may not be suitable for all investors, so please ensure that you fully understand the risks involved and seek independent advice if necessary.
Disclaimer:
The above opinions given constitute general market commentary, and do not constitute the opinion or advice of IC Markets or any form of personal or investment advice.
Any opinions, news, research, analyses, prices, other information, or links to third-party sites contained on this website are provided on an "as-is" basis, are intended only to be informative, is not an advice nor a recommendation, nor research, or a record of our trading prices, or an offer of, or solicitation for a transaction in any financial instrument and thus should not be treated as such. The information provided does not involve any specific investment objectives, financial situation and needs of any specific person who may receive it. Please be aware, that past performance is not a reliable indicator of future performance and/or results. Past Performance or Forward-looking scenarios based upon the reasonable beliefs of the third-party provider are not a guarantee of future performance. Actual results may differ materially from those anticipated in forward-looking or past performance statements. IC Markets makes no representation or warranty and assumes no liability as to the accuracy or completeness of the information provided, nor any loss arising from any investment based on a recommendation, forecast or any information supplied by any third-party.

BTCUSDT – Uptrend Intact, Resistance Still in PlayBitcoin is currently moving within a healthy uptrend, showing a strong rebound from the 101,332 USDT support zone—aligned with the EMA 89 on the daily chart. Following an impressive recovery, the price is now approaching the 111,892 resistance area, which previously halted the bullish momentum and triggered a deep correction.
However, recent price action shows signs of stalling, suggesting a possible consolidation phase. If BTC fails to break above 111,892, a mild pullback toward the 104,000–101,000 zone may occur to build fresh momentum for the next bullish leg.
From a news perspective, the crypto market is buoyed by improving sentiment after weak U.S. job data, increasing the odds of an earlier-than-expected Fed rate cut. Additionally, continued capital inflows into Bitcoin ETFs are supporting medium-term upside potential for BTC.

Bullish momentum to extend?The Bitcoin (BTC/USD) is falling towards pivot and could bounce to the 1st resistance.
Pivot: 108,446.67
1st Support: 106,491.59
1st Resistance: 111.566.95
Risk Warning:
Trading Forex and CFDs carries a high level of risk to your capital and you should only trade with money you can afford to lose. Trading Forex and CFDs may not be suitable for all investors, so please ensure that you fully understand the risks involved and seek independent advice if necessary.
Disclaimer:
The above opinions given constitute general market commentary, and do not constitute the opinion or advice of IC Markets or any form of personal or investment advice.
Any opinions, news, research, analyses, prices, other information, or links to third-party sites contained on this website are provided on an "as-is" basis, are intended only to be informative, is not an advice nor a recommendation, nor research, or a record of our trading prices, or an offer of, or solicitation for a transaction in any financial instrument and thus should not be treated as such. The information provided does not involve any specific investment objectives, financial situation and needs of any specific person who may receive it. Please be aware, that past performance is not a reliable indicator of future performance and/or results. Past Performance or Forward-looking scenarios based upon the reasonable beliefs of the third-party provider are not a guarantee of future performance. Actual results may differ materially from those anticipated in forward-looking or past performance statements. IC Markets makes no representation or warranty and assumes no liability as to the accuracy or completeness of the information provided, nor any loss arising from any investment based on a recommendation, forecast or any information supplied by any third-party.

Bullish rise?The Bitcoin (BTC/USD) has bounced off the pivot and could rise to the 1st resistance.
Pivot: 101,052.23
1st Support: 94,702.53
1st Resistance: 110,959.87
Risk Warning:
Trading Forex and CFDs carries a high level of risk to your capital and you should only trade with money you can afford to lose. Trading Forex and CFDs may not be suitable for all investors, so please ensure that you fully understand the risks involved and seek independent advice if necessary.
Disclaimer:
The above opinions given constitute general market commentary, and do not constitute the opinion or advice of IC Markets or any form of personal or investment advice.
Any opinions, news, research, analyses, prices, other information, or links to third-party sites contained on this website are provided on an "as-is" basis, are intended only to be informative, is not an advice nor a recommendation, nor research, or a record of our trading prices, or an offer of, or solicitation for a transaction in any financial instrument and thus should not be treated as such. The information provided does not involve any specific investment objectives, financial situation and needs of any specific person who may receive it. Please be aware, that past performance is not a reliable indicator of future performance and/or results. Past Performance or Forward-looking scenarios based upon the reasonable beliefs of the third-party provider are not a guarantee of future performance. Actual results may differ materially from those anticipated in forward-looking or past performance statements. IC Markets makes no representation or warranty and assumes no liability as to the accuracy or completeness of the information provided, nor any loss arising from any investment based on a recommendation, forecast or any information supplied by any third-party.

Bitcoin Daily Technical Overview (BTC/USD)Currently, Bitcoin (BTC/USD) is trading around $104,800. Up slightly but still digesting a sharp reversal that rattled short-term bulls.
Recent Price Action: Rejection From $112K
Back on 22nd May, Bitcoin surged to a new high near $112,000, fueled by bullish momentum, institutional flows, and strong on-chain accumulation. However, that breakout was swiftly rejected, and BTC fell as low as $103,400.
This kind of "bull trap" reversal highlights a few key dynamics:
1) Overextended sentiment: The rally above $110K was not supported by volume or follow-through, suggesting exhaustion.
2) Profit-taking by large holders or institutions likely triggered a cascade of stop-losses, accelerating the decline.
3) Liquidation clusters in leveraged long positions likely exacerbated the drop.
Bitcoin is now attempting to reclaim stability around the $104K–$105K range.
🔍 Technical Snapshot
- Support Zones at $103,000 and $93,200
- Resistance Levels at $112,000 (ATH)
Price is still above the 50 & 200-day SMAs, which could be a bullish longer-term signal.
In addition, the price remains above the upper band of the cloud, but momentum is stalling. A decisive bounce off the cloud could reignite bullish sentiment. Or falling into the cloud could trigger more uncertainty and downside.
Macro tailwinds: Concerns over U.S. fiscal stability and potential Fed rate cuts could keep Bitcoin attractive as a non-sovereign asset.
📈 Projection Scenarios
Bullish Case:
If BTC consolidates above $107K, we could see another attempt and retest of $112K.
Bearish Case:
Failure to hold above $103K could see Bitcoin revisit $100K, and if that breaks, downside opens toward the $93K level.
🧭 Insight & Takeaway
The current reversal serves as a healthy reminder that no trend goes up in a straight line. Especially not in crypto.
It likely shook out overleveraged longs, reset sentiment, and may give the market room to breathe before the next leg up.
The long-term trend remains intact, but expect more volatility before any clean break to new highs.
Always DYOR and DYODD and manage your risk.

LRC, LOOPRING, HOW MANY LOOPRINGS DO YOU THINK SONIC COULD EAT?Something is going on with this coin on the technical side.
There is literally no downside target that I can see right now, so I just labeled in MASSIVE SUPPORT TREND.
It looks like it is really close to making a move to the upside.
Somewhere around .8
Then it will likely hit some resistance there, but has a lot of potential to keep building support and climbing.
This coin looks incredibly bullish right now.
Things can change fast and if they do it will likely be a break of this trend (green).
The run up can take it to .45 and maybe a little higher, but the buy the dip price looks to be around .245. which would then take price higher to over 1 and beyond.
I'm gonna go with 3684 looprings for sonic.
What even is a loopring?
I'll attach more crypto TA to this idea.
oh and don't follow the guideline, pay more attention to the trends and price zones.

Bearish reversal?The Bitcoin (BTC/USD) is rising towards the pivot and could reverse to the 1st support.
Pivot: 107,412.53
1st Support: 102,164.07
1st Resistance: 111,566.95
Risk Warning:
Trading Forex and CFDs carries a high level of risk to your capital and you should only trade with money you can afford to lose. Trading Forex and CFDs may not be suitable for all investors, so please ensure that you fully understand the risks involved and seek independent advice if necessary.
Disclaimer:
The above opinions given constitute general market commentary, and do not constitute the opinion or advice of IC Markets or any form of personal or investment advice.
Any opinions, news, research, analyses, prices, other information, or links to third-party sites contained on this website are provided on an "as-is" basis, are intended only to be informative, is not an advice nor a recommendation, nor research, or a record of our trading prices, or an offer of, or solicitation for a transaction in any financial instrument and thus should not be treated as such. The information provided does not involve any specific investment objectives, financial situation and needs of any specific person who may receive it. Please be aware, that past performance is not a reliable indicator of future performance and/or results. Past Performance or Forward-looking scenarios based upon the reasonable beliefs of the third-party provider are not a guarantee of future performance. Actual results may differ materially from those anticipated in forward-looking or past performance statements. IC Markets makes no representation or warranty and assumes no liability as to the accuracy or completeness of the information provided, nor any loss arising from any investment based on a recommendation, forecast or any information supplied by any third-party.

BTCUSDT – Risk of trend break, bearish signs emergingBTCUSDT is trading right at the lower boundary of its ascending channel, around the 108,800 mark. After several bounces from this trendline, price action now appears to be stalling—indicating that buying pressure is weakening. If the price breaks below the 107,500–106,500 support zone (marked by the 34 EMA and recent swing low), the short-term uptrend could be invalidated.
A confirmed break below 106,500 could trigger a further correction toward the 89 EMA around 102,800.
On the news front: Latest data shows Bitcoin’s dominance is slightly decreasing as capital rotates back into altcoins. Additionally, market uncertainty surrounding the Fed's monetary policy outlook is making investors more cautious about riskier assets like crypto.

Bearish drop?The Bitcoin (BTC/USD) has reacted off the pivot, which lines up with the 38.2% Fibonacci retracement, and could drop to the 1st support, which lines up with the 127.2% Fibonacci extension.
Pivot: 108,411.31
1st Support: 105,349.38
1st Resistance: 109,146.02
Risk Warning:
Trading Forex and CFDs carries a high level of risk to your capital and you should only trade with money you can afford to lose. Trading Forex and CFDs may not be suitable for all investors, so please ensure that you fully understand the risks involved and seek independent advice if necessary.
Disclaimer:
The above opinions given constitute general market commentary, and do not constitute the opinion or advice of IC Markets or any form of personal or investment advice.
Any opinions, news, research, analyses, prices, other information, or links to third-party sites contained on this website are provided on an "as-is" basis, are intended only to be informative, is not an advice nor a recommendation, nor research, or a record of our trading prices, or an offer of, or solicitation for a transaction in any financial instrument and thus should not be treated as such. The information provided does not involve any specific investment objectives, financial situation and needs of any specific person who may receive it. Please be aware, that past performance is not a reliable indicator of future performance and/or results. Past Performance or Forward-looking scenarios based upon the reasonable beliefs of the third-party provider are not a guarantee of future performance. Actual results may differ materially from those anticipated in forward-looking or past performance statements. IC Markets makes no representation or warranty and assumes no liability as to the accuracy or completeness of the information provided, nor any loss arising from any investment based on a recommendation, forecast or any information supplied by any third-party.

Bullish bounce?The Bitcoin (BTC/USD) is falling towards the pivot and could bounce to the 1st resistance.
Pivot: 105,255.25
1st Support: 101,983.62
1st Resistance: 111,758.60
Risk Warning:
Trading Forex and CFDs carries a high level of risk to your capital and you should only trade with money you can afford to lose. Trading Forex and CFDs may not be suitable for all investors, so please ensure that you fully understand the risks involved and seek independent advice if necessary.
Disclaimer:
The above opinions given constitute general market commentary, and do not constitute the opinion or advice of IC Markets or any form of personal or investment advice.
Any opinions, news, research, analyses, prices, other information, or links to third-party sites contained on this website are provided on an "as-is" basis, are intended only to be informative, is not an advice nor a recommendation, nor research, or a record of our trading prices, or an offer of, or solicitation for a transaction in any financial instrument and thus should not be treated as such. The information provided does not involve any specific investment objectives, financial situation and needs of any specific person who may receive it. Please be aware, that past performance is not a reliable indicator of future performance and/or results. Past Performance or Forward-looking scenarios based upon the reasonable beliefs of the third-party provider are not a guarantee of future performance. Actual results may differ materially from those anticipated in forward-looking or past performance statements. IC Markets makes no representation or warranty and assumes no liability as to the accuracy or completeness of the information provided, nor any loss arising from any investment based on a recommendation, forecast or any information supplied by any third-party.

BTCUSDT – Hitting resistance, is selling pressure returning?Bitcoin is showing signs of losing momentum after touching the resistance zone around 111,669. On the H4 timeframe, the previous bullish structure has stalled with a series of red candles and a clear pullback, bringing price back to test the EMA 34 zone.
In terms of news, although the market remains excited due to expectations surrounding a Bitcoin spot ETF, many large investors are starting to take profits after the recent sharp rally. This is causing selling pressure to slightly outweigh buying in the short term.
The most likely scenario now is that BTC could make a mild upward move to retest the 111,600 area – but if it fails to break above, a reversal back toward the support zone at 105,800 is highly probable. This area aligns with the EMA 89 and a previous accumulation zone.
Current strategy: don’t get caught in a false breakout. Instead, watch the 111,600 area and wait for a clear signal. If a reversal candlestick pattern appears, short-term sell entries may be considered with a target near the lower support.

BTCUSDT – Mild Pullback, Support Holds FirmBTCUSDT remains in a clear uptrend with a structure of higher highs and higher lows, after breaking out of a prolonged consolidation pattern since early May.
The price has surged from the 106,000 resistance zone and approached the technical target around 112,000 – an area that is currently triggering a slight pullback.
At the moment, the support zone around 106,700–107,800 aligns with a demand area and the EMA34, likely serving as a springboard for the next upward move.
If BTC continues to consolidate around this zone without breaking below 106,700, the 112,000 level could be breached, paving the way for a move toward higher targets.

Heading into pullback resistance?Bitcoin (BTC/USD) is rising towards the pivot which has been identified as a pullback resistance and could reverse to the 1st support which. is also a pullback support.
Pivot: 108,391.05
1st Support: 98,383.98
1st Resistance: 119,108.79
Risk Warning:
Trading Forex and CFDs carries a high level of risk to your capital and you should only trade with money you can afford to lose. Trading Forex and CFDs may not be suitable for all investors, so please ensure that you fully understand the risks involved and seek independent advice if necessary.
Disclaimer:
The above opinions given constitute general market commentary, and do not constitute the opinion or advice of IC Markets or any form of personal or investment advice.
Any opinions, news, research, analyses, prices, other information, or links to third-party sites contained on this website are provided on an "as-is" basis, are intended only to be informative, is not an advice nor a recommendation, nor research, or a record of our trading prices, or an offer of, or solicitation for a transaction in any financial instrument and thus should not be treated as such. The information provided does not involve any specific investment objectives, financial situation and needs of any specific person who may receive it. Please be aware, that past performance is not a reliable indicator of future performance and/or results. Past Performance or Forward-looking scenarios based upon the reasonable beliefs of the third-party provider are not a guarantee of future performance. Actual results may differ materially from those anticipated in forward-looking or past performance statements. IC Markets makes no representation or warranty and assumes no liability as to the accuracy or completeness of the information provided, nor any loss arising from any investment based on a recommendation, forecast or any information supplied by any third-party.
