BTC-USD

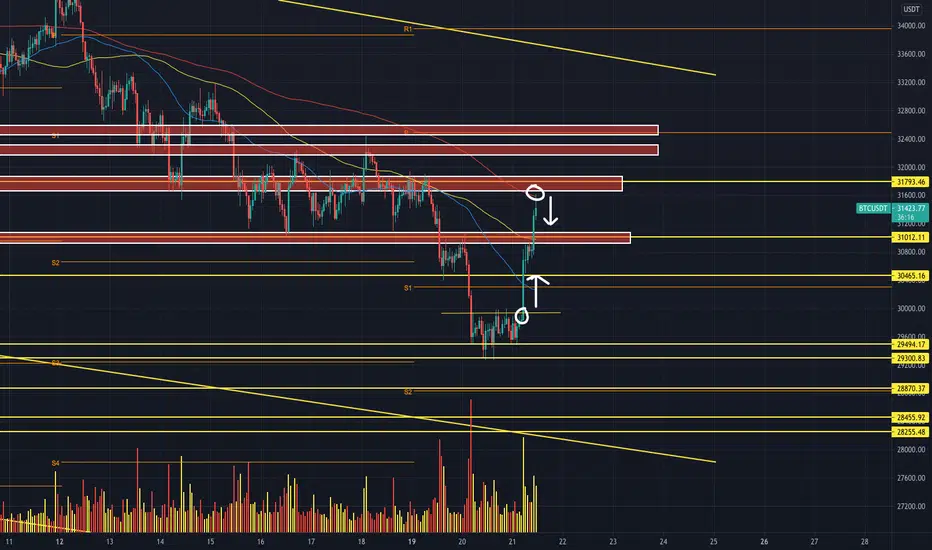
bearish wolfe wave BTCUSD Bybit I see a bearish wolfe wave at bitcon.
The Gundstruktur stands already, we have the High-Low-HH and HL, in the overbought area we were also already and have respected the limit for now.
In addition (not to be seen on the chart) we are in a strong resistance zone.
For more than 80 days, we are in a range after the big sell off in mid-May.
I doubt that we will break out of this without pullback to the top.
The target would be matching the middle of the range.
Definitely worth a trade.

BTC weeklyResistance at the 111 day moving average
Looking for back test of support at 30k
ultimately looking for it to fail

Simple but importantIf Bitcoin can stabilize above the $ 42,000 range, it can easily see the $ 47,000 target range, and if it has the strength to cross it, it will conquer the peak.


BTC ... The seige against SUPPLY!Evening all!
Back again after our absence last night!
We're having a discussion about what we think is going to happen & what we're LOOKING FOR when it comes to price action.
Make sure you let us know you're thoughts below!

$BTCUSDT UPDATE!!!Hi Traders,
So its only right if we also do a TA on $BTC. Prices have now rejected the 100MA Daily 2x, thats if todays close fails to break which is looking likely.
Not only has it rejected the 100MA but has also rejected the big order block it is currently in. Accumulation and manipulation has taken place in the last few days. However, it looks like the whales will need to capture more liquidity lower down.
There are 3 order block zones as seen below and we will be referring to them as zones for support for things to be sent back up towards the larger order block at $45,000-$42500.
Thanks
MS
⬇️⬇️⬇️⬇️⬇️⬇️⬇️⬇️⬇️⬇️⬇️⬇️⬇️⬇️⬇️⬇️⬇️⬇️⬇️⬇️⬇️⬇️⬇️⬇️⬇️⬇️⬇️⬇️⬇️⬇️⬇️⬇️⬇️⬇️⬇️⬇️⬇️⬇️⬇️⬇️⬇️⬇️⬇️⬇️⬇️⬇️⬇️⬇️⬇️⬇️⬇️⬇️⬇️⬇️⬇️⬇️⬇️⬇️⬇️⬇️⬇️⬇️⬇️⬇️⬇️⬇️⬇️⬇️


GBPUSD 7.27Potential setup for GU, we are look for 61.8% retracement then extension into target
Buy 1.381
TP 1.402
SL 1.386

BTCUSDT UPDATE!!!Hi Traders,
So we got a fakeout from the top resistance level, for a fail to close above the level and to then make a large move down. Prices found sensitivity at the the 50MA and sensitivity just above the confluence zone seen below. Prices are now currently rising towards a resistance level at $38,000, if prices reject this level as resistance we can expect prices to continue back down towards the confluence zone below.
However, if prices manage to break $38,000 and close above with increasing buy volume we will then expect prices to continue bullish or at least go into a range at the top. Buy volume is currently weak and will need to build to break $38,000
Thanks
MS
⬇️⬇️⬇️⬇️⬇️⬇️⬇️⬇️⬇️⬇️⬇️⬇️⬇️⬇️⬇️⬇️⬇️⬇️⬇️⬇️⬇️⬇️⬇️⬇️⬇️⬇️⬇️⬇️⬇️⬇️⬇️⬇️⬇️⬇️⬇️⬇️⬇️⬇️⬇️⬇️⬇️⬇️⬇️⬇️⬇️⬇️⬇️⬇️⬇️⬇️⬇️⬇️⬇️⬇️⬇️⬇️⬇️⬇️⬇️⬇️⬇️⬇️⬇️⬇️⬇️⬇️⬇️⬇️

BTC ... A COOL OFF on its WAY! 🧊❄️Evening all!
Back again on Tradingview, it's good to be here. If you didn't watch yesterdays update I encourage you to!
Tonight we talk about what we think is coming next - A COOL OFF!

BTC ... So what were we saying AGAIN???Evening everyone!!!
Well, here we are - Back at 40K!
It's been a good ride & might I add a predictable one - Steamroller, Supply & Demand and even RSI giving us the green light on multiple timeframes!
Let us know what you think and you think is going to happen in the comments!

BTC/USD - weekly Analytics + Altcoins 26.07.2021The "Bullish Engulfing" of the consolidation that started on April 19, 2021 is additionally confirmed by the impulse price surge, which is a strong long signal. The next confirmation of the long-term growth of quotations will be a breakthrough of the level of 40 ,000 dollars, in this case I will set further goals for the price movement.
Altcoins:
We single out TRON and HIVE as the most promising coins for the development of a stable growing trend. (the idea is confirmed by local growth impulses)

BTC/USD - weekly Analytics + Altcoins 26.07.2021The "Bullish Engulfing" of the consolidation that started on April 19, 2021 is additionally confirmed by the impulse price surge, which is a strong long signal. The next confirmation of the long-term growth of quotations will be a breakthrough of the level of 40,000 dollars, in this case I will set further goals for the price movement.
Altcoins:
We single out TRON and HIVE as the most promising coins for the development of a stable growing trend. (the idea is confirmed by local growth impulses)

$BTCUSDT UPDATE!!!Hi Traders,
So we've already kickstarted the week with over +1300% in our VIP channel! Yes I repeat +1300%!!! If you don't believe us make sure to go check us out!
But back to the important stuff! $BTC broke the channel that it was in since May and went up to the order block that we stated in our last post at $40,000 before finding resistance. Now we wait for restructuring. A break of R3 will take us down tot he order block seen below, however as there is little structure prices may still push higher. A break of the last candle close high will take prices to the last wick high, if bullish momentum is able to continue we could see a price break of the wick high and push towards the top of the order block or potentially even further to the next order block seen at $43,000-$45,500.
Thanks
MS
⬇️⬇️⬇️⬇️⬇️⬇️⬇️⬇️⬇️⬇️⬇️⬇️⬇️⬇️⬇️⬇️⬇️⬇️⬇️⬇️⬇️⬇️⬇️⬇️⬇️⬇️⬇️⬇️⬇️⬇️⬇️⬇️⬇️⬇️⬇️⬇️⬇️⬇️⬇️⬇️⬇️⬇️⬇️⬇️⬇️⬇️⬇️⬇️⬇️⬇️⬇️⬇️⬇️⬇️⬇️⬇️⬇️⬇️⬇️⬇️⬇️⬇️⬇️⬇️⬇️⬇️⬇️⬇️


My trading historyWell we've been volatile these last month or so whatever, I've been catching some swing-trades but maybe the swing-trade gravy train is at-end. With bullish momentum these last few days especially as we dip into the $31,800-29,500 region as kinda not expecting reversal structure at this time. I "hope" I can close this leveraged short at some profit and ride the remaining 95% of my portfolio to the upside.
But we may never know! Drink more alcohol!


$BTCUSDT UPDATE!!!!Hi Traders,
So we got two rejections of the $33,000 resistance level. Prices are now looking like they're going into a short term range, a break in either direction of the range will indicate to us which path $BTC will want to take for the short term and in doing so dictate the direction of the ALT market. There has been a slow down as seen from the gradient decrease of the chart. However, higher lows are still forming and prices are still rejection the support zone that its currently in. As it stands we're still bullish unless we get a strong break lower past the range and support zone.
Thanks
MS
⬇️⬇️⬇️⬇️⬇️⬇️⬇️⬇️⬇️⬇️⬇️⬇️⬇️⬇️⬇️⬇️⬇️⬇️⬇️⬇️⬇️⬇️⬇️⬇️⬇️⬇️⬇️⬇️⬇️⬇️⬇️⬇️⬇️⬇️⬇️⬇️⬇️⬇️⬇️⬇️⬇️⬇️⬇️⬇️⬇️⬇️⬇️⬇️⬇️⬇️⬇️⬇️⬇️⬇️⬇️⬇️⬇️⬇️⬇️⬇️⬇️⬇️⬇️⬇️⬇️⬇️⬇️⬇️


$BTCUSDT UPDATE!!!!!Hi Traders,
So $BTC prices were seen to be in a range last night where they then broke above and have pushed through some past support zones now as resistance. We are now rejecting the 200MA on the hourly timeframe. We would like to see short term fall in prices to test the $31,000 key level as support for prices to then push higher again tot eh $31,000 level or potentially higher into he two smaller zones at the top of the chart.
Thanks
MS
⬇️⬇️⬇️⬇️⬇️⬇️⬇️⬇️⬇️⬇️⬇️⬇️⬇️⬇️⬇️⬇️⬇️⬇️⬇️⬇️⬇️⬇️⬇️⬇️⬇️⬇️⬇️⬇️⬇️⬇️⬇️⬇️⬇️⬇️⬇️⬇️⬇️⬇️⬇️⬇️⬇️⬇️⬇️⬇️⬇️⬇️⬇️⬇️⬇️⬇️⬇️⬇️⬇️⬇️⬇️⬇️⬇️⬇️⬇️⬇️⬇️⬇️⬇️⬇️⬇️⬇️⬇️⬇️
BTC ... Following up on a CRITICAL MOVEEvening all!
Back again - A follow up on our thoughts from yesterdays video, be sure to check that one out!
Tonight we're looking to see if this Demand is destined to be broken ....
What do you all think??

$BTCUSDT UPDATE!!!!Hi Traders,
So on our last $BTC post we explained that prices would continue to make this way down towards the bottom of the channel and thats exactly what's happened over night. Prices still looking extremely bearish with very little buy volume entering the market as of yet.
We will be looking for a pullback in prices towards the zone where the 0.382 FIB can also been seen. if buy volume presents itself we could see an overshoot to the 0.618 FIB where theres a key level to be tested as resistance.
The next stop for $BTC prices once a break of the lower low is made will be the bottom of the channel after that $24,000-$20,000 has a large block where liquidity can be captured for prices to push back up.
Thanks
MS
⬇️⬇️⬇️⬇️⬇️⬇️⬇️⬇️⬇️⬇️⬇️⬇️⬇️⬇️⬇️⬇️⬇️⬇️⬇️⬇️⬇️⬇️⬇️⬇️⬇️⬇️⬇️⬇️⬇️⬇️⬇️⬇️⬇️⬇️⬇️⬇️⬇️⬇️⬇️⬇️⬇️⬇️⬇️⬇️⬇️⬇️⬇️⬇️⬇️⬇️⬇️⬇️⬇️⬇️⬇️⬇️⬇️⬇️⬇️⬇️⬇️⬇️⬇️⬇️⬇️⬇️⬇️⬇️
