$BTCUSDT UPDATE!!!!Hi Traders,
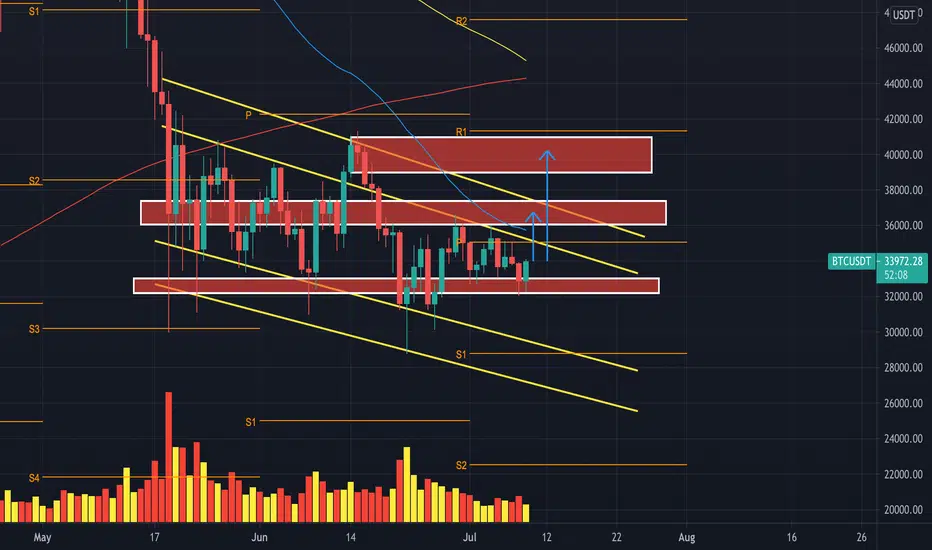
So this is the current structure BTC is playing within. A downward sloping channel with trap zone on either side. Price has currently rejecting the lower zone as support and is pushing higher. We will need to watch momentum and strength of the push up in prices as it edges closer to the 50MA and second confluence zone. If we manage to gain momentum and volume to break the second zone we will go higher to the top zone where we're likely to see small pullback, testing short term support to then take prices much higher.
On the other hand if we fail to break the 50MA and top of the channel then its likely for us to see a continuation to the bearish sentiment sending prices to the bottom of the channel with the chance of a breakout of the bottom taking us towards the sub $20k price levels.
Thanks
MS
⬇️⬇️⬇️⬇️⬇️⬇️⬇️⬇️⬇️⬇️⬇️⬇️⬇️⬇️⬇️⬇️⬇️⬇️⬇️⬇️⬇️⬇️⬇️⬇️⬇️⬇️⬇️⬇️⬇️⬇️⬇️⬇️⬇️⬇️⬇️⬇️⬇️⬇️⬇️⬇️⬇️⬇️⬇️⬇️⬇️⬇️⬇️⬇️⬇️⬇️⬇️⬇️⬇️⬇️⬇️⬇️⬇️⬇️⬇️⬇️⬇️⬇️⬇️⬇️⬇️⬇️⬇️⬇️
BTC-USD
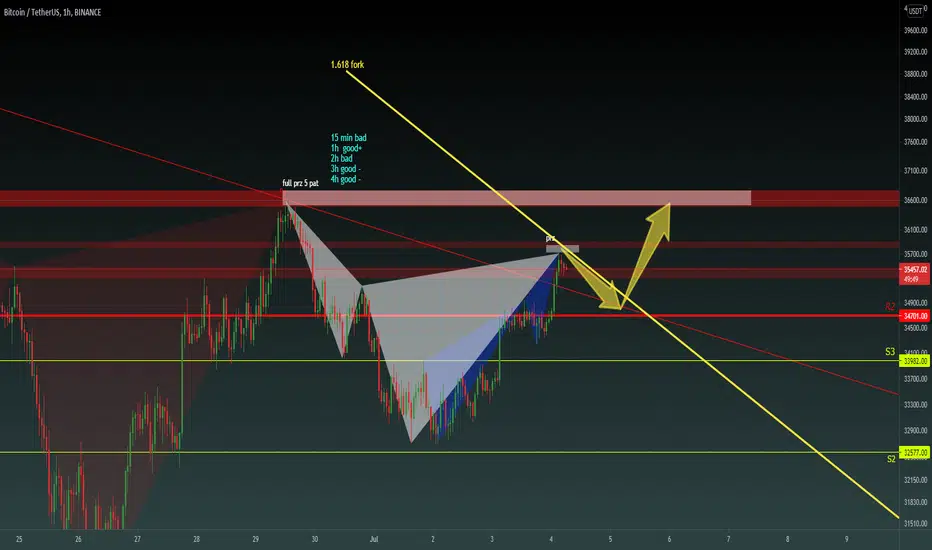
BTC Quick dip flipBTC Quick dip flip
sure this does not look good overall for BTC but it looks like this quick dip down will be bought up and return to the mid 30K's before moving back down lower.
a short term day trade for sure.
but an obvious pattern I have seen played out over and our again these past few months.

BTCUSDT UPDATE!!!Hi Traders,
So we've seen a push up in prices from the $34,000 level to $35,000 where prices have hit some resistance. If we fail to break the $35,000 then we'll be expecting prices to turn bearish at least in the short term and come back down towards the lower red zones. However, if we are able to gain momentum again and break the $35,000 level acting as resistance, we're more than likely to break the downtrending trend line seen on our chart. If we are able to break both level then the market turns into a strong bullish sentiment.
On the most recent leg up prices have rejected the $35,000 to come back down to the 0.382 FIB to then retest the $35,000. In addition, prices pulled back to the 100/200MA 1HR timeframe, however, as it stands its not been enough to break $35,000.
Thanks
MS
⬇️⬇️⬇️⬇️⬇️⬇️⬇️⬇️⬇️⬇️⬇️⬇️⬇️⬇️⬇️⬇️⬇️⬇️⬇️⬇️⬇️⬇️⬇️⬇️⬇️⬇️⬇️⬇️⬇️⬇️⬇️⬇️⬇️⬇️⬇️⬇️⬇️⬇️⬇️⬇️⬇️⬇️⬇️⬇️⬇️⬇️⬇️⬇️⬇️⬇️⬇️⬇️⬇️⬇️⬇️⬇️⬇️⬇️⬇️⬇️⬇️⬇️⬇️⬇️⬇️⬇️⬇️⬇️

BTCUSDT UPDATE!!!Hi Traders,
We're picking up from where we left behind so click on the last BTC post that we did at the bottom of this post.
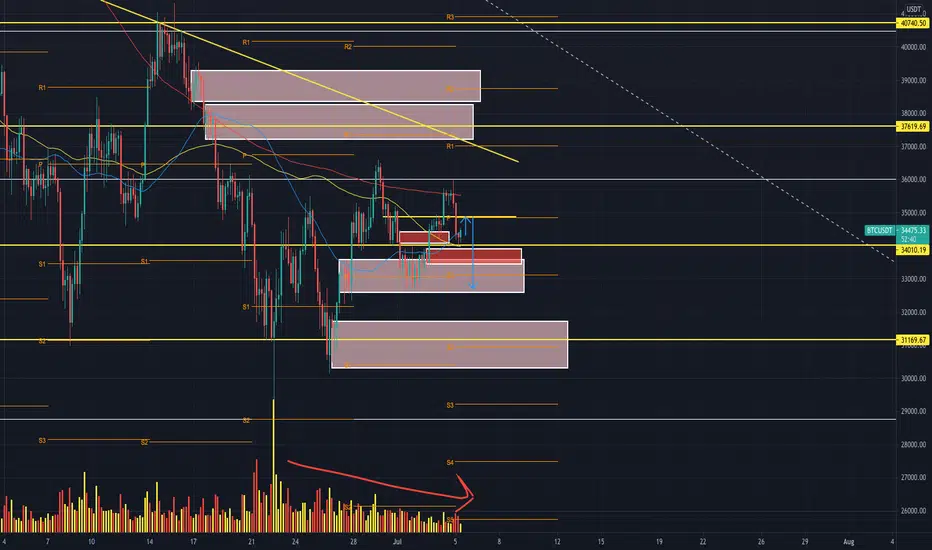
So we managed to break $34,000 and hit resistance at $35,000. Currently building bearish sentiment and it will continue to do so if prices fail to break and close above $34,000 and $35,000. So for now we look for support in the lower red zones. If we get a close below $33,000 and or $32,500 then expect prices to drop between $32,000-$30,000 which we spoke about on our last post.
As always if you enjoy the content don't forget to click the like button and make a comment on your opinion.
Thanks
MS
⬇️⬇️⬇️⬇️⬇️⬇️⬇️⬇️⬇️⬇️⬇️⬇️⬇️⬇️⬇️⬇️⬇️⬇️⬇️⬇️⬇️⬇️⬇️⬇️⬇️⬇️⬇️⬇️⬇️⬇️⬇️⬇️⬇️⬇️⬇️⬇️⬇️⬇️⬇️⬇️⬇️⬇️⬇️⬇️⬇️⬇️⬇️⬇️⬇️⬇️⬇️⬇️⬇️⬇️⬇️⬇️⬇️⬇️⬇️⬇️⬇️⬇️⬇️⬇️⬇️⬇️⬇️⬇️⬇️
BTC/USD - weekly Analytics + Altcoins 05.07.2021Bitcoin continues to stay in consolidation between the levels of 33.300 and 40 .000, a breakout of the upper boundary will significantly increase the chances of long-term growth of the instrument. Whereas, an impulse decrease under the level of 33.300 will increase the chances of a decline to the area of 20,000. Investor sentiment remains pessimistic, the next strong moves and exit from consolidation will determine future developments.
Altcoins:
We highlight TRON and HIVE as the most promising coins to develop a sustainable rising trend.

BTC/USD - weekly Analytics + Altcoins 05.07.2021Bitcoin continues to stay in consolidation between the levels of 33.300 and 40.000, a breakout of the upper boundary will significantly increase the chances of long-term growth of the instrument. Whereas, an impulse decrease under the level of 33.300 will increase the chances of a decline to the area of 20,000. Investor sentiment remains pessimistic, the next strong moves and exit from consolidation will determine future developments.
Altcoins:
We highlight TRON and HIVE as the most promising coins to develop a sustainable rising trend.

BTCUSDT UPDATE!!!Hi Traders,
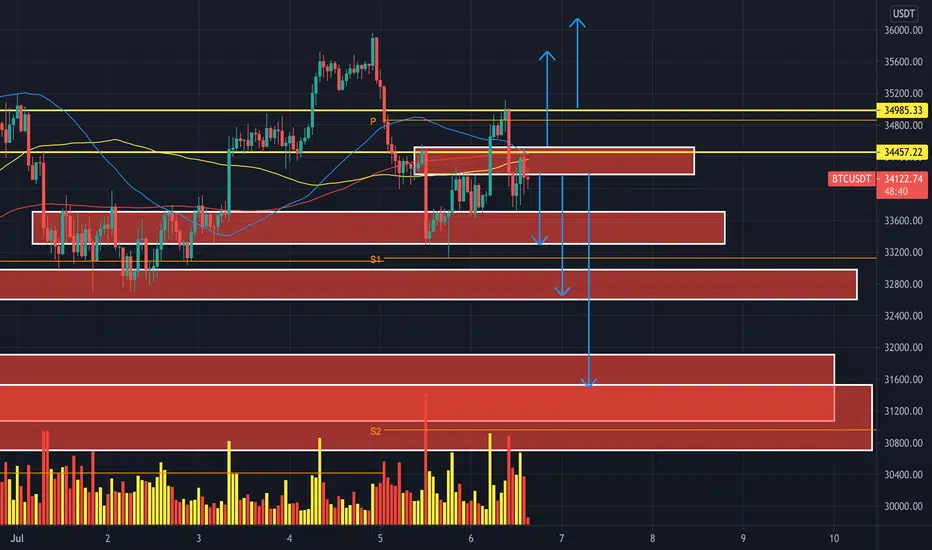
We're back with another BTC update!! So we've started the week with a small sell off and a retest of the $34,000 level. The sell off may continue in the short term if it fails to hold above the $34,000 level. Refer to the lower two grey zones for areas of next support.
As always if you enjoy the content don't forget to click the like button and make a comment on your opinion.
Thanks
MS
⬇️⬇️⬇️⬇️⬇️⬇️⬇️⬇️⬇️⬇️⬇️⬇️⬇️⬇️⬇️⬇️⬇️⬇️⬇️⬇️⬇️⬇️⬇️⬇️⬇️⬇️⬇️⬇️⬇️⬇️⬇️⬇️⬇️⬇️⬇️⬇️⬇️⬇️⬇️⬇️⬇️⬇️⬇️⬇️⬇️⬇️⬇️⬇️⬇️⬇️⬇️⬇️⬇️⬇️⬇️⬇️⬇️⬇️⬇️⬇️⬇️⬇️⬇️⬇️⬇️⬇️⬇️⬇️⬇️

ADA LONG!!Hey everyone!
Just some quick chart analytics for ada. As we can see ada has huge support around $1 and looks to be like alot of accumulation going on.
On the smaller time frames there is an inverse head and shoulders (hourly) inside the bigger trend which looks to be like a Wyckoff accumulation pattern.
Trade Idea
Enter: $1.25
SL: $1.15
TP1: $1.8 (47%)
TP: $2.47 (96%)
If your using leverage then please be careful and use a stop loss.
If this trade plays out on 10x leverage then thats a nice 960% gain!
Happy trading.

ETH Daily chart. GO LONGHey everyone!
the market has looked to have bottomed out. It also looks like we are in the last phase of the wyckoff pattern. On smaller time frames we have bullish divergence also. The last thing to look at was the falling wedge which now we are looking to break out of. The blacklines represent the trend and the neckline that we broke and now will become support.
Trade Idea
Enter 2000 - 2050
SL: 1700
TP: 3000
happy trading

BTC/USD - weekly Analytics + Altcoins 28.06.2021Bitcoin continues to stay in 3.688.212 - 4.347.782 trading range, its overcoming will be key for future movements of the instrument. Since investor sentiment is on the peaks of pessimism, we expect the overcoming of the level of 4.347.782 and fixation above it. In this case, we can count on long-term growth.
Altcoins:
Growth in quotations above the 0.082 level on TRX (TRON) will significantly increase the chances of further upside.

BTC/USD - weekly Analytics + Altcoins 28.06.2021Bitcoin continues to stay in 33.500 - 40.000 trading range, its overcoming will be key for future movements of the instrument. Since investor sentiment is on the peaks of pessimism, we expect the overcoming of the level of 40.000 and fixation above it. In this case, we can count on long-term growth.
Altcoins:
Growth in quotations above the 0.082 level on TRX (TRON) will significantly increase the chances of further upside.

💡Don't miss the great buy opportunity in BTCUSD @BitcoinTrading suggestion:
". There is a possibility of temporary retracement to the suggested support line (33600).
. if so, traders can set orders based on Price Action and expect to reach short-term targets."
Technical analysis:
. BTCUSD is in a range bound, and the beginning of an uptrend is expected.
. The price is below the 21-Day WEMA, which acts as a dynamic resistance.
. The RSI is at 57.
Take Profits:
TP1= @ 35080
TP2= @ 37220
TP3= @ 39300
TP4= @ 41740
TP5= @ 46050
SL= Break below S2
❤️ If you find this helpful and want more FREE forecasts in TradingView
. . . . . Please show your support back,
. . . . . . . . Hit the 👍 LIKE button,
. . . . . . . . . . Drop some feedback below in the comment!
❤️ Your support is very much 🙏 appreciated!❤️
💎 Want us to help you become a better Forex / Crypto trader?
Now, It's your turn!
Be sure to leave a comment; let us know how you see this opportunity and forecast.
Trade well, ❤️
ForecastCity English Support Team ❤️

💡Don't miss the great buy opportunity in BTCUSD @BitcoinTrading suggestion:
". There is a possibility of temporary retracement to the suggested support line (33600).
. if so, traders can set orders based on Price Action and expect to reach short-term targets."
Technical analysis:
. BTCUSD is in a range bound, and the beginning of an uptrend is expected.
. The price is below the 21-Day WEMA, which acts as a dynamic resistance.
. The RSI is at 57.
Take Profits:
TP1= @ 35080
TP2= @ 37220
TP3= @ 39300
TP4= @ 41740
TP5= @ 46050
SL= Break below S2
❤️ If you find this helpful and want more FREE forecasts in TradingView
. . . . . Please show your support back,
. . . . . . . . Hit the 👍 LIKE button,
. . . . . . . . . . Drop some feedback below in the comment!
❤️ Your support is very much 🙏 appreciated! ❤️
💎 Want us to help you become a better Forex / Crypto trader ?
Now, It's your turn !
Be sure to leave a comment; let us know how you see this opportunity and forecast.
Trade well, ❤️
ForecastCity English Support Team ❤️


BTC / new trend?The question is if we just are retesting resistence of the trend or we have ended the spring of Wyckoff.

BTC/USD-29900 support zone, entry point.
- If broke the line, way to go 1.
- If not go 2.
- Targets signed.
*Please share your opinion on it, write in the comments.
Teşekkürler.

Bitcoin to 8KBear Market Confirmed
Symmetrical contracting triangle on the weekly, broke out, retraced and initiated bull market,
PI Cycle top was April 11th signaling the end of bull market, this occurred during a massive ascending wedge.
Currently what I see is a massive head and shoulders on the weekly.
Combined with Metcalfe law fair value at around 8k range on the weekly.
Not financial advice always do your own research educational purposes only under the right of fair use.

BTC/USD - weekly Analytics + Altcoins 21.06.2021Bitcoin continues to stand in consolidation with support level 33.500 and resistance level 40 .000. The growth to the key resistance level will increase the chances of further strengthening, while trading under the support levels will shift the probability towards the fall of quotations. We will monitor the situation further.
Altcoins:
TRON and HIVE stand out as the most promising coins for the development of a sustainable rising trend.

BTC/USD - weekly Analytics + Altcoins 21.06.2021Bitcoin continues to stand in consolidation with support level 33.500 and resistance level 40.000. The growth to the key resistance level will increase the chances of further strengthening, while trading under the support levels will shift the probability towards the fall of quotations. We will monitor the situation further.
Altcoins:
TRON and HIVE stand out as the most promising coins for the development of a sustainable rising trend.

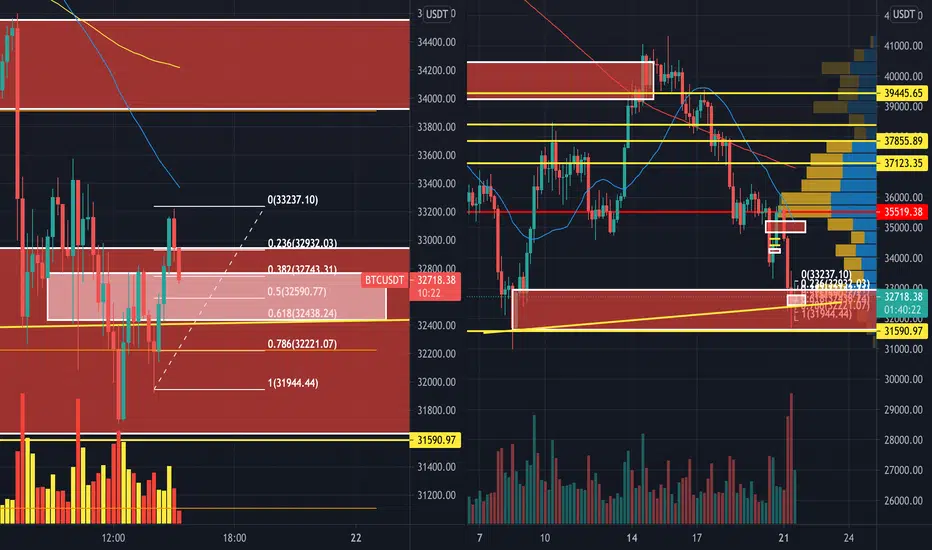
BTCUSDT UPDARTE!!!Hi Traders,
We have another $BTC update here! So on the right hand side you can see that a higher low has been formed with increased volume, so a lot of liquidity has been taken from that order block. We will continue to watch price action for confirmation of the bull taken over.
On the left hand side we take a look at the smaller timeframe for signs of bullish momentum. Currently price is testing the FIB Levels within the grey area.
Thanks
MS