BTCUSDT.1DBased on the provided market data, Bitcoin (BTC) is currently trading at $57,147 against USDT.
In the 4-hour chart, the Relative Strength Index (RSI) is at 88.21, which is significantly above the 70 threshold, indicating that the asset is currently overbought. The Moving Average Convergence Divergence (MACD) is at 1330.0, indicating bullish momentum. However, the Bollinger Band (Bb4h) at 57346.0 suggests that BTC is nearing its upper limit. The resistance levels are at $57,500, $59,400, and $60,400, while the support levels are at $49,012, $48,000, and $45,900.
On the daily chart, the RSI is at 87.16, still indicating overbought conditions. The MACD is at 2316.0, suggesting bullish momentum. The Bollinger Band (Bb1d) is at 57416.0, indicating that BTC is trading near its upper limit. Resistance levels are at $57,600, $64,000, and $65,300, while support levels are at $50,830, $41,419, and $36,600.
Lastly, on the 7-day chart, the RSI is at 84.24, suggesting the asset is overbought. The MACD is at 5383.0, indicating strong bullish momentum. The Bollinger Band (Bb7d) is at 57500.0, which means BTC is trading near its upper limit. Resistance levels are at $64,200, $69,400, and $72,300, while support levels are at $42,250, $29,900, and $25,900.
In conclusion, the market data suggests that BTC is currently overbought and trading near its upper limit across different time frames. This could indicate that a price correction might be imminent. However, the strong bullish momentum reflected in the MACD values across all time frames suggests that the upward trend might continue.
Please note that this analysis is based on historical data and does not guarantee future performance. It is always recommended to do your own research before making any investment decisions.
Btc-usdt

USDT DominanceGood morning friends,
Been taking a look into a lot of charts on the 3M lately.
Keeping my views.
Trade thirsty!

HelenP. I Bitcoin will rebound from trend line and continue growHi folks today I'm prepared for you Bitcoin analytics. Some days ago price rebounded from the trend line and rose to the support zone, which coincided with the 50650 support level, but at once BTC rebounded and made little correction. After correction, the price rose back to the support zone, and in a short time, BTC broke the 50650 support level and rose until to the resistance level, which coincided with the resistance zone, and also price started to trades inside consolidation. In consolidation, the price rebounded from the resistance level and declined to the support level, but soon it bounced and rose back to the 52800 level. After this movement, BTC turned around and started to decline to the support level, which coincided with the trend line, where recently it rebounded and started to grow. At the moment price continues to rise near this level in consolidation, so I expect that Bitcoin will correct to the trend line, after which it will rebound and continue to move up in consolidation. That's why I set my target at 52300 points. If you like my analytics you may support me with your like/comment ❤️

📌BTC vs USDT.D - Who Follows Whom? 👀Hello TradingView Family / Fellow Traders. This is Richard, also known as theSignalyst.
I always keep an eye on USDT.D to gauge the overall crypto market sentiment.
📚 Today, I want to demonstrate the correlation between BTC and USDT.D:
- Last month, BTC broke above the previous major high (shown in blue), while USDT.D broke the previous major low and initiated an impulse movement.
- BTC is currently fluctuating within a narrow range around the $53,000 resistance level, while USDT.D is hovering around the 5% support level and the round number.
- BTC is expected to maintain its bullish trend unless it breaks below the last major low at $50,500, which would correspond to USDT.D dropping below 5.29%.
And so on... the picture is self-explanatory.
The question is... Who Follows Whom?
📚 Always follow your trading plan regarding entry, risk management, and trade management.
Good luck!
All Strategies Are Good; If Managed Properly!
~Rich

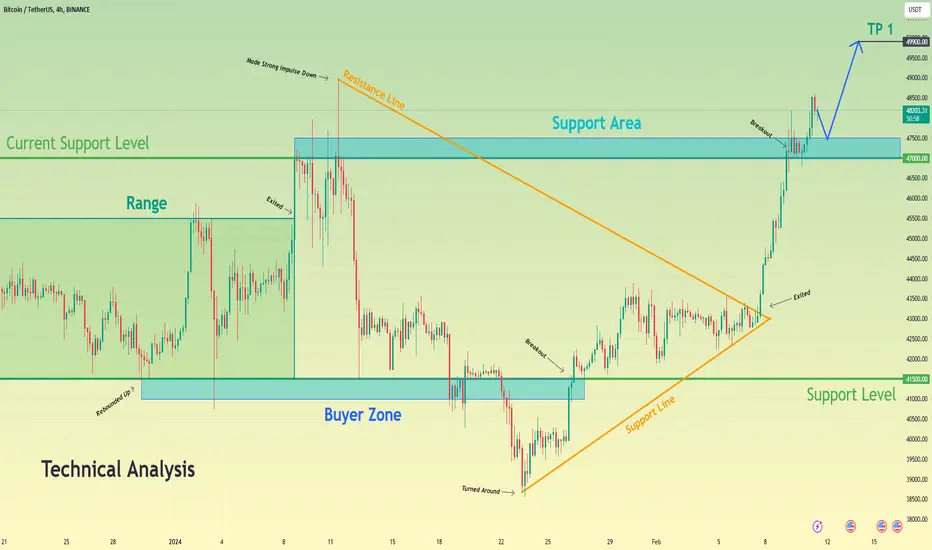
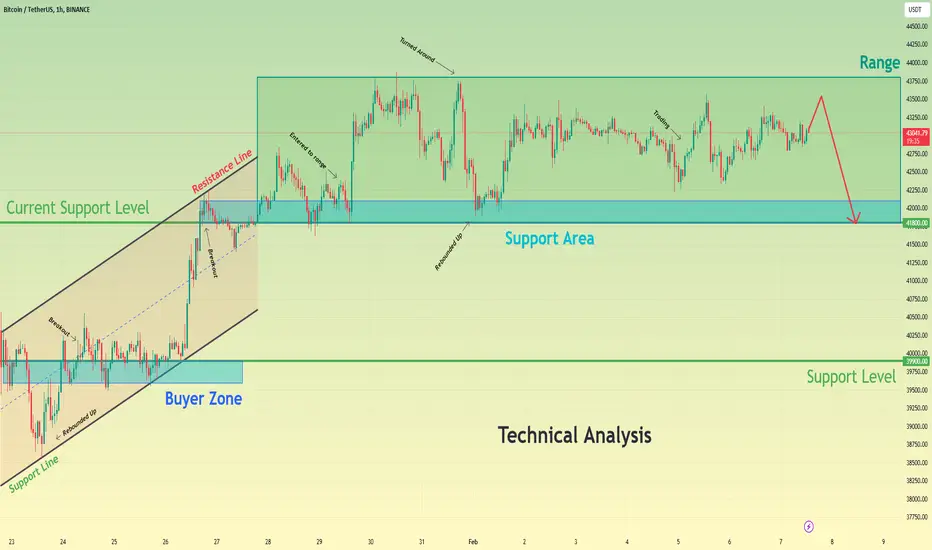
Bitcoin can grow from support area to resistance line of wedgeHello traders, I want share with you my opinion about Bitcoin. Looking at the chart, we can see how the price some days ago started to trades in the range, where firstly it declined to the support level, which coincided with the buyer zone and bottom part of the range. After this, the price rebounded up and rose to 48950 points, but then it turned around and started to decline. As well, the price entered to upward wedge, where it fell to the support line, thereby exiting from the range and breaking the 41700 level, but soon BTC turned around and started to move up. Soon, the price broke the 41700 level and later made little correction to the support line of the wedge, after which Bitcoin made a strong upward impulse to the resistance line, breaking the current support level, which coincided with the support area. But a not long time ago it rebounded and now the price trades near the support level in the support area inside the wedge. In my mind, BTC can decline to the support level and then rebound up to the resistance line of the wedge. For this reason, I set my target at the 54000 level, which coincided with the resistance line. Please share this idea with your friends and click Boost 🚀

Bitcoin: Fake Out Signal - Watch Out Bears!Bitcoin has been trading within a well-defined range since a week. A few days ago, the range has set a clear low around 50.600$. My expectation is, in case the yellow support area will fail, that BTC will make a fake out to trick the bears.
Longer-term time frames are still overly bullish, so the path of least resistance is up at this point. Ideally, we will see an hourly oversold reading on the RSI, which would further strengthen the bullish fake-out case.

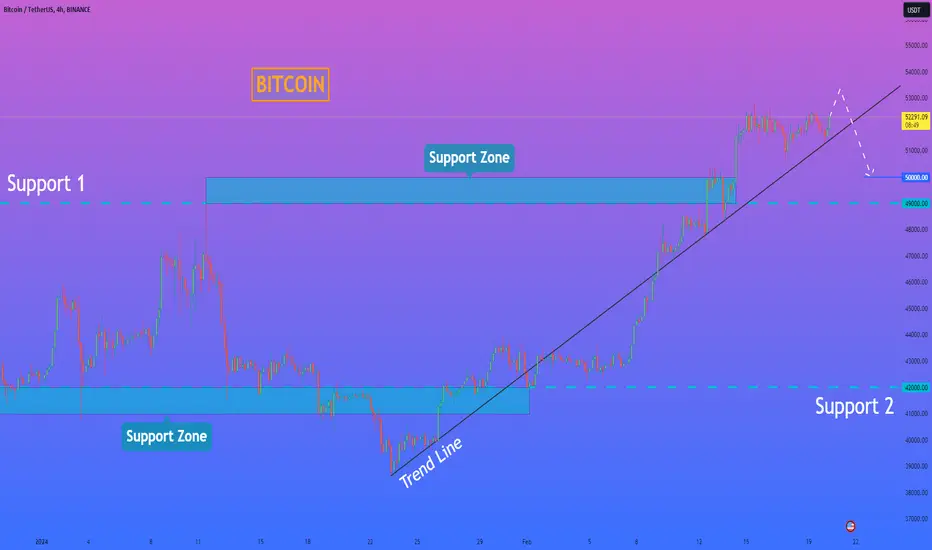
HelenP. I Bitcoin can rise a little and then start to declineHi folks today I'm prepared for you Bitcoin analytics. A not long time ago price traded near support 2, which coincided with the support zone, and then rebounded and started to move up to support 1, which coincided with one more support zone. But when BTC reached this level, it at once rebounded and in a short time declined to the trend line, thereby breaking support 2 with the 42000 - 41000 support zone. After this, the price bounced from the trend line and soon grew higher than support 2, breaking it again and later making a correction, lower the trend line. Then BTC rebounded from support 2 and rose to the trend line, broke this line, and continued to move up near this line to support 1. A short time later, the price reached support 1 and broke it, after which BTC made a correction to the trend line and then made impulse up to 52900 points. But recently, the price declined to the trend line and at the moment it trades close to this line. For my mind, Bitcoin will rise a little more to 53500 and then start to decline lower trend line. Therefore I set my target at 50000 points. If you like my analytics you may support me with your like/comment ❤️
WLDUSDT LIMIT ORDER!!BYBIT:WLDUSDT.P
Today I have WLD for a limit order I'm predicting this one to keep going for a continuation here as the weekly still looks strong and this chart is just too clean not to have a limit in, let's go!
Thanks guys!

Bitcoin can make correction movement to 48900, exiting of rangeHello traders, I want share with you my opinion about Bitcoin. Looking at the chart, we can see how the price a not long time ago made downward impulse from resistance line of the pennant to 41500 support level, which coincided with buyer zone. After this movement, BTC some time traded near this level, after which in a short time price broke this level and declined to support line of pennant. Then BTC turned around from support line and started to grow to 41500 support level. Soon, the price broke this level one more time and continued to move up to the resistance line of pennant, and after reached this line, BTC fell to the support line and then made a strong upward impulse to 48900 level, which coincided with the support area, thereby exiting from the pennant. In a short time later, price broke 48900 level, made retest and rose a little higher, but a not long time ago it started to trades in range, where price continues to trades to this day. In my mind, Bitcoin can decline to the bottom part of the range, then make little movement up, after which continue to fall to the current support level, thereby exiting from range. For this reason, I set two targets, first target at the 50600 level, and second - at the 48900 support level. Please share this idea with your friends and click Boost 🚀

BITCOIN - Price can make correction to $49000 support levelHi guys, this is my overview for BTCUSDT, feel free to check it and write your feedback in comments👊
When price started to trades in flat, price some time traded near $41300 level, which coincided with support area and bounced up.
After this, BTC rose to $49000 level, exiting from flat and entering to triangle, where price made downward impulse.
Price declined from resistance line to support line of triangle, breaking $41300 level, but soon price rose higher this level.
Next, Bitcoin made strong upward impulse to $49000 level, which coincided with support area, thereby exiting from triangle.
Also soon, price broke this level and recently rose higher support area, and now I think Bitcoin can little grow firstly.
Then price will turn around and start to decline to $49000 support level.
If this post is useful to you, you can support me with like/boost and advice in comments❤️

🔥 Bitcoin: Fibonacci Signals New All-Time High Soon 🚨In this analysis I want to compare the start of the previous two bull-cycles with the current one. Specifically, I want to look at the Fibonacci retracements drawn on the chart.
During the start of the bull-runs, the 0.618 (light blue) Fibonacci retracement has always played a key role. First, the price has always rejected once from the 0.618 area once (red arrows). However, the second time that the price reaches the 0.618 Fibonacci retracement it has always broken through.
This break out has always started a new bull-run with new all-time highs. If history will repeat, we can expect that BTC is going to see a few very bullish months ahead and will make new all-time highs in the near future.
Do you think that this is the bull-run that we've been waiting for? Share your thoughts🙏

Bitcoin can rebound down of resistance line to 48700 in channelHello traders, I want share with you my opinion about Bitcoin. By observing the chart, we can see that the price a not long time ago breakout the 42800 support level, which coincided with the buyer zone inside the upward channel and started to trades near this level. Some time BTC fell to the buyer zone, but at once it backing up, and later price finally rebounded from the support line and continued to move up in the channel. A few moments later BTC reached 50200 current support level, which coincided with the support area, but at once made little correction, after which the price turned around and rose back to this level. Soon, Bitcoin broke the 50200 level and even later rose higher than the support area and reached the resistance line of the channel. But recently price rolled down from this line and at the moment it trades near, so in my mind, Bitcoin can rise to the resistance line and then start to decline to the support line, thereby breaking the support level. For this reason, I set my target at 48700 points, which coincided with the support line of the upward channel. Please share this idea with your friends and click Boost 🚀

BTCUSDT.1DBased on the market data provided, the current price of Bitcoin (BTC) against Tether (USDT) is $52,089.
The Relative Strength Index (RSI) for 4 hours, 1 day and 7 days are 76.33, 84.40 and 80.84 respectively. These values indicate that BTC is currently in the overbought territory, suggesting that a price correction might be imminent.
The Moving Average Convergence Divergence (MACD) for 4 hours, 1 day and 7 days are 1163, 2323 and 5140 respectively. The positive MACD values indicate that the bulls are currently in control.
The Bollinger Bands (BB) for 4 hours, 1 day and 7 days are all at 53570, indicating a relatively stable price volatility.
The support levels for 4 hours, 1 day and 7 days are $51,056, $47,500 and $40,000 respectively, while the resistance levels for the same periods are $53,351, $53,230 and $53,800.
In my opinion, while the market is currently bullish, the high RSI values suggest that the market is overbought, and a price correction might be on the horizon. As such, it might be a good idea to exercise caution and consider taking profits or setting stop-loss orders to protect your investment. However, if BTC manages to break through the resistance levels, we could see further upside.
Keep in mind that this analysis is based on historical data and does not guarantee future results. Always do your own research and consider your financial situation and risk tolerance before making investment decisions.

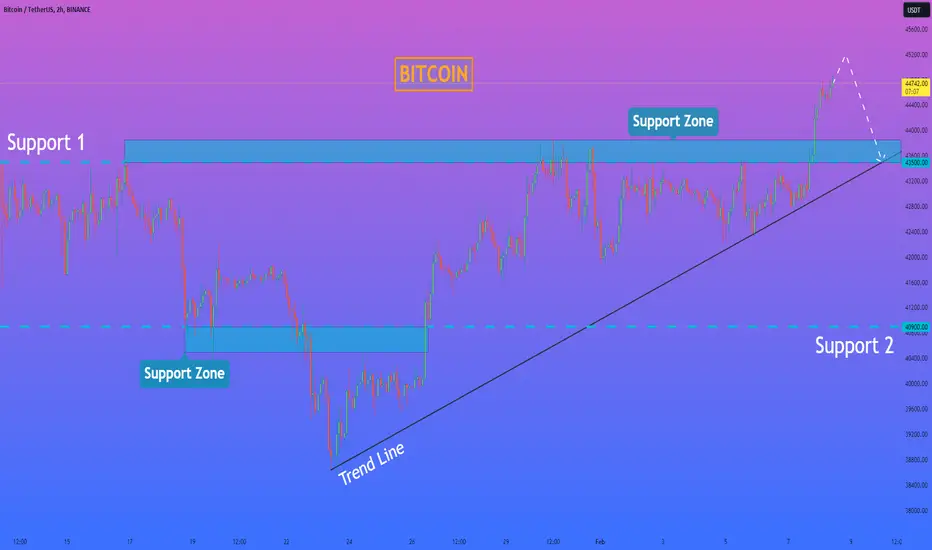
HelenP. I Bitcoin can make correction, after which continue growHi folks today I'm prepared for you Bitcoin analytics. A not long time ago price declined from support 2, which coincided with the support zone to the trend line, after which the price bounced and started to trades in the support zone. Some time later, BTC broke the trend line and support 2 again, and then the price started to rise to the trend line. When it reached this line, BTC broke it, made a retest, and then continued to move up to support 1, which coincided with one more support zone. Later, the price finally reached support 1, broke it, and little time trades in the support zone, but soon it made a correction below this level. Then BTC in a short time rose back and even recently grew higher than the support zone to 48600 points. But also, a not long time ago BTC stopped rising more, and now it trades near the support zone, so I expect that price can make little movement up, after which Bitcoin will decline to the trend line, which coincides with support 1 in support zone and then it can rebound up from this area. For this reason, I set my target at the 49200 level. If you like my analytics you may support me with your like/comment ❤️

Bitcoin can little correct and then continue to move upHello traders, I want share with you my opinion about Bitcoin. Observing the chart, we can see that the price some days ago traded in the range, where it firstly declined to the 41500 support level, which coincided with the buyer zone, but soon BTC turned around and made impulse up higher than the bottom part of the range, thereby exiting from it. Next, the price entered to the pennant, where it rose to the resistance line, after which it made a strong downward impulse to the support line, thereby breaking two levels - 47000 and 41500. Later price turned around from the support line and in a short time rose higher than the 41500 level, breaking it one more time and little time later BTC reached the resistance line of the pennant and broke it too, exiting from the pennant pattern. After this movement, Bitcoin rose to its current support level, which coincided with the support area, and recently broke it also, after which the price made a retest and continued to move up. At the moment, the price trades near the support area, and in my mind, Bitcoin can correct to the support area, and then BTC will bounce and continue to grow. For this case, I set my target at the 49900 level. Please share this idea with your friends and click Boost 🚀
HelenP. I After impulse up, BTC will make correction to $43500Hi folks today I'm prepared for you Bitcoin analytics. Some days ago price traded near support 1, but after a little correction, it rose back to this level and made a strong impulse down to the trend line, thereby breaking support 2, which coincided with the support zone. After this movement, BTC turned around from the trend line and in a short time rose to support 2, and soon broke this level again. Next, the price continued to move up and reached one more support zone, which coincided with support 1, but later it rebounded from this area and soon declined to the trend line. Some time later price rebounded from this line and made impulse up, breaking support 1. At the moment, the price trades higher than the support zone and I expect that Bitcoin will rise a little more, after which the price can make a correction to the 43500 support level. For this reason, I set my target at this level. If you like my analytics you may support me with your like/comment ❤️
BITCOIN - Price can make retest and then continue to move upHi guys, this is my overview for BTCUSDT, feel free to check it and write your feedback in comments👊
Some days ago price bounced from $41700 level and tried to rise, but failed and in a short time declined to support line of wedge.
Then BTC at once made strong upward impulse to resistance line, and soon fell to $41700 level, making fake breakout of $47200 level.
Price broke $41700 level again and continued to decline to support line, and later started to grow in rising channel.
Also, BTC exited of wedge, broke $41700 level, and continued to move up in channel to $47200 level.
Recently price exited from channel, reached $41700 level, broke it and now BTC trades in resistance area.
Possibly, Bitcoin can make retest of support level, after breakout and then continue to grow to $49500
If this post is useful to you, you can support me with like/boost and advice in comments❤️

Bitcoin can make little movement up, and then start to fallHello traders, I want share with you my opinion about Bitcoin. Observing the chart, we can see that the price a not long time ago started to trades inside the upward channel, where it first declined to the support line, after which it rebounded and rose to the 39900 support level, which coincided with the buyer zone. Next, the price some time traded near this level, and soon broke it, after which BTC rebounded up to the next level in the channel. In a short time price broke the 41800 level too, after which it started to trades inside from range, thereby exiting of upward channel. In range, BTC some time traded near the support area, which coincided with the bottom part and 41800 level, and later rebounded from this zone to top part of range. After this movement, Bitcoin turned around and made a correction back to the support area, but it at once bounced and continued to trades near the support area. Now, I think that Bitcoin can rise a little more, after which the price make correction to support the area again. For this case, I set my target at the current support level - 41800. Please share this idea with your friends and click Boost 🚀
BTC 44437 LONG#BTC
Mirror level
44437 LONG
1. Small bar approach
2. Consolidation along the level with compression
3. Near retest
4. Accumulation

🔥 Bitcoin Low Volatility Alert: Extreme Move Incoming!Bitcoin has seen some extremely low volatility over the last couple of days. Every time that the indicator flashed green (low volatility), a big move in price was coming rather sooner than later.
Over the last year, most of the low-volatility-alerts have signaled a bullish move. Only in July and August it preceded a bearish move.
Something will happen, but it remains uncertain which direction the price will go. I've been quite bearish on the price ever since the ETF top, so wouldn't be surprised if we go down further.

BITCOIN - Price can little correct and then bounce up to $45200Hi guys, this is my overview for BTCUSDT, feel free to check it and write your feedback in comments👊
Recently price entered to rising channel, where it rose to $45200 resistance level, which coincided with resistance area.
Then BTC corrected to support line and after this made upward impulse to $48700 points, thereby exiting from channel.
But soon, BTC turned around and made a strong downward impulse to $40550 level, breaking $45200 resistance level.
Soon, price broke support level to and fell to support line, but later price in a short time backed up higher this level.
After this, price formed pennant, where BTC rose to resistance line and recently broke it, exiting from this pattern.
Now, in my opinion, Bitcoin can correct and then it continues to move up to $45200 resistance level.
If this post is useful to you, you can support me with like/boost and advice in comments❤️

BTC a short idea...Evening fellas,
Mid term short idea.
I never liked BTC when it's just flirting with resistance, so to me it's worth the risk.
Gonna leave this chart as is and check in the future.
Trade thirsty my friends.

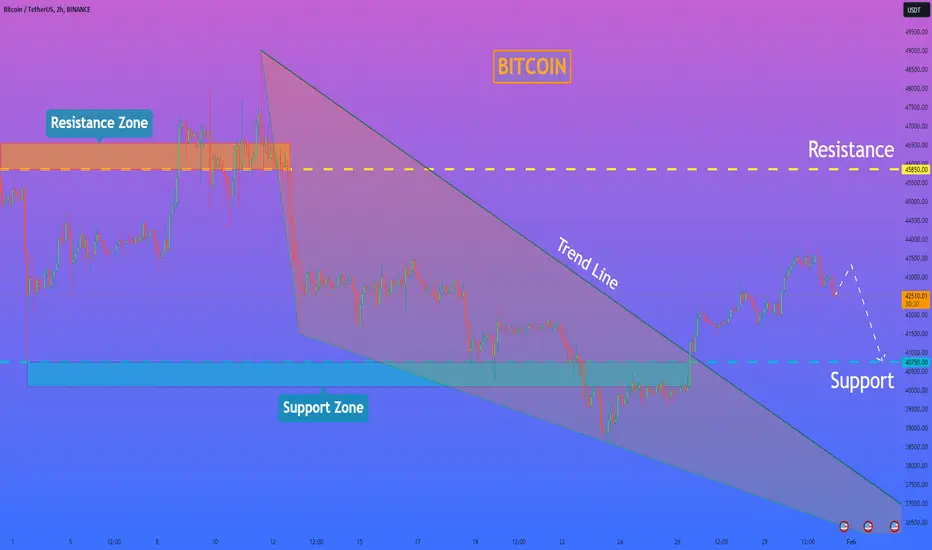
HelenP. I After rising moving, BTC can correct $40750Hi folks today I'm prepared for you Bitcoin analytics. A not long time ago price rebounded from the 45850 resistance level, which coincided with the resistance zone and made impulse down to the 40750 support level. But BTC at once rebounded from this line and in a short time rose back to the resistance level and even later rose higher than this level, thereby breaking it. Then BTC rose to the trend line, after which it bounced and made a strong impulse down to the support level, breaking 45850 one more time. Also, the price started to decline inside the wedge, where it declined even below a support level, breaking this level too. Some time later BTC turned around and in a short time rose to the trend line and broke it, thereby exiting from the wedge and breaking the 40750 support level, which coincided with the support zone. Now, the price continues to grow and for my mind, Bitcoin will rise a little more, after which it turn around and starts to decline to the support level. Therefore, I set up my target at the 40750 support level. If you like my analytics you may support me with your like/comment ❤️