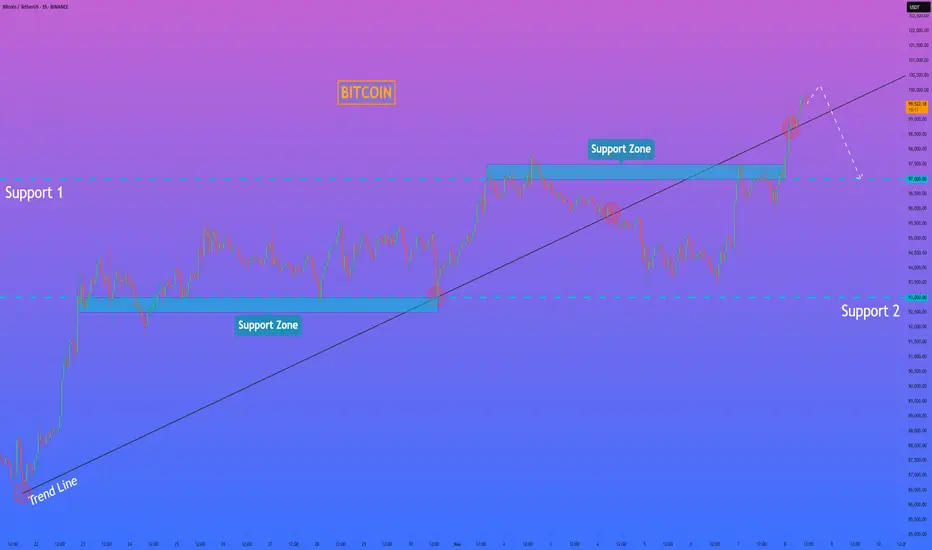
HelenP. I Bitcoin will fall to support zone and then start riseHi folks today I'm prepared for you Bitcoin analytics. This chart shows how the price continues to trade inside a rising channel, with the price currently hovering just above the support zone around 101000. After forming a clean consolidation phase near the upper boundary of the structure, the market is showing signs of a potential pullback toward this zone. However, the broader trend remains bullish, and as long as price holds within the ascending formation, this correction may act as a base for the next move higher. The consolidation structure formed at the top indicates that buyers are not rushing in aggressively, but they are also not allowing prices to drop sharply, a classic sign of accumulation. This aligns well with the previously confirmed trend line and horizontal support zone. If BTC holds this area and finds renewed momentum, I expect a breakout from the consolidation range to the upside. My goal remains at 107000 points, which sits a little higher than the projected top of the current channel. Given the strength of the structure, the higher lows, and the recent defense of support, I maintain a bullish bias and anticipate another upward wave from this level. If you like my analytics you may support me with your like/comment ❤️
Btc-usdt


BTC/USDT Short Side TradeEntry 102650
SL 102800
Target 101700
There is a strong selling pressure and also its a fibo zone

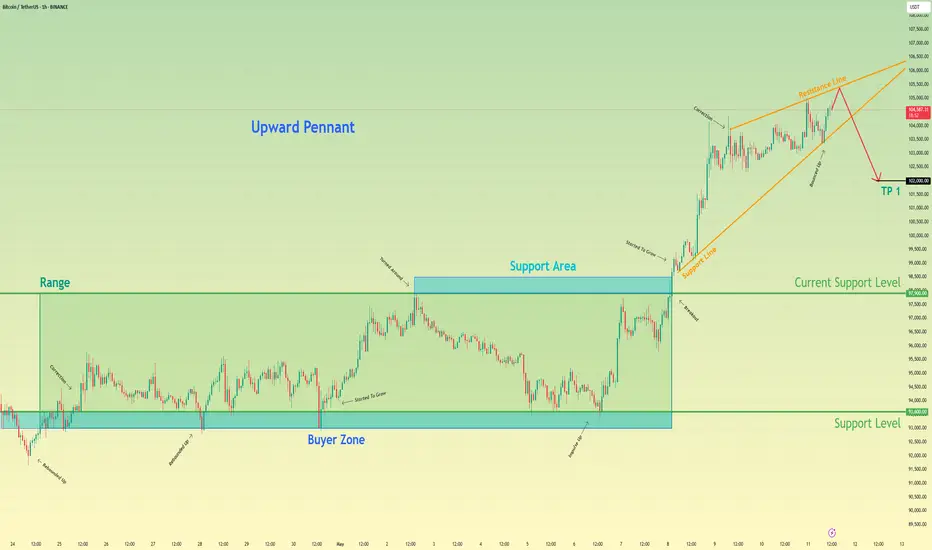
Bitcoin may drop to 102K points, exiting from pennantHello traders, I want share with you my opinion about Bitcoin. After breaking out of a multi-day range and launching a strong impulse from the buyer zone, the price has formed a clear upward pennant pattern. This technical formation often signals a potential slowdown in the bullish momentum, especially when it follows an aggressive move to the upside. The current price action shows that BTC has approached the resistance line of the pennant, but failed to generate further breakout strength. Each new impulse within the structure has weakened, and the market is starting to compress inside narrowing boundaries. The support area has been holding the structure temporarily, but the inability to push through the top of the pennant suggests growing exhaustion among buyers. This setup indicates that BTC may soon break downward from the pennant. So, I expect that it will make a correction that could drive the price down to the 102000 points, thereby exiting from pennant pattern. Please share this idea with your friends and click Boost 🚀
BITCOIN - Price can correct to support line of rising channelHi guys, this is my overview for BTCUSDT, feel free to check it and write your feedback in comments👊
Some days ago, the price entered a triangle, where it dropped to the support line, after which it rose briefly to the resistance line.
Then, price exited from the triangle pattern and made a retest at once, after which it corrected $81500 level.
Next, price some time traded near this level and later fell below, but soon turned around and started to grow inside a rising channel.
In channel BTC broke the $81500 level and later rose to the $93000 level, which broke soon too, and then made a retest.
Later price bounced and continued to grow, and now it trades near the resistance line of a rising channel.
Possibly, BTC can grow a little more and then make a correction movement to $99000
If this post is useful to you, you can support me with like/boost and advice in comments❤️

HelenP. I Bitcoin can break trend line and fall to support levelHi folks today I'm prepared for you Bitcoin analytics. After a strong rally, зкшсу has reached a critical zone, and the reaction here might become a key pivot for short-term price action. Price managed to break above the ascending trend line, but instead of continuation, we saw a clear rejection from the 99500 area, followed by a sharp drop back below the trend structure. This type of movement often indicates bull trap behavior. Breakout traders enter on momentum, but then get squeezed as the price fails to hold above the trend. At the same time, buyers are beginning to lose control, and sellers are regaining initiative near major resistance. Importantly, BTC is now pulling back toward a support zone between 97500 and 97000, which previously acted as a base for consolidation. If this level fails to hold, the next support lies around 93000, where the trend originally started. The structure is shifting. A trend line break followed by a failed retest often signals a trend reversal or, at least, a deeper correction. I expect BTCUSDT can drop to the 97000 level, breaking the trend line. If you like my analytics you may support me with your like/comment ❤️
HelenP. I Bitcoin may continue to grow inside upward channelHi folks today I'm prepared for you Bitcoin analytics. After bouncing from the lower boundary of the ascending channel and reacting strongly from the support zone near 92000, the price continues to respect the bullish structure. This level, which also aligns with the dynamic trend line, has acted as a powerful area of interest for buyers. Every touch to the trend line has resulted in a reversal to the upside, and this time may be no different. Previously, we saw a clear upward impulse that formed the base of the current trend channel. Then the market entered a consolidation with smaller pullbacks and held the 93000 zone with confidence. The recent retracement toward the trend line and support area is forming a higher low, which confirms buyer strength and sets the stage for another bullish leg. Given the strong support zone, the presence of an upward channel, and the steady bullish structure, I expect BTC to resume its upward move. My current goal is 99000 points. All elements signal bullish continuation. If you like my analytics you may support me with your like/comment ❤️

$BTC at the start of the next parabolic run!Bitcoin's parabolic run in 2017 continued on MA11 and with the breaking of the middle band of the mass index indicator, the second parabolic run continued and now we are at the same stage.

Bitcoin may rebound from seller zone and start to declineHello traders, I want share with you my opinion about Bitcoin. In the past, the price had been consolidating within a broad range, repeatedly rejecting support and resistance zones. The buyer zone between 79100 - 80300 provided a strong base, and from there, BTC began to grow, forming a bullish structure that led into an upward wedge. This growth accelerated once the price broke through the support area and continued upward until it approached the resistance level at 95500, which also overlaps with the seller zone. As the price moved inside the wedge, the bullish impulses weakened. Buyers lost strength near the resistance line of the wedge, and recent price action suggests that sellers are stepping in at the top. We’ve now seen multiple failed attempts to break higher, and the price is consolidating under resistance, forming pressure to the downside. This entire consolidation near the wedge resistance, especially inside a confirmed seller zone, indicates a likely reversal. The current structure shows signs of exhaustion, and if the support line of the wedge breaks, that would trigger a significant correction. Given this context, I expect BTC can make a bearish move toward TP1 at 91500 points. Please share this idea with your friends and click Boost 🚀

BITCOIN - Price can exit from wedge and rose to $102K pointsHi guys, this is my overview for BTCUSDT, feel free to check it and write your feedback in comments👊
Some days ago, the price declined to $81600 level, after which it bounced and rose to $88500 points and then started to fall.
Also price entered to wedge pattern, where it fell to support line, breaking support level, but soon turned around and bounced up.
Price broke $81600 level again and continued to grow next, but later it corrected to support line.
Then, BTC rose from this line to $93000 level, broke it, and reached resistance line of wedge, after which corrected.
After correction, BTC fell to $93000 level and then rose back to resistance line of wedge, where it trades close.
In my mind, price can correct to support line and then bounce up to $102000 points, exiting from a wedge.
If this post is useful to you, you can support me with like/boost and advice in comments❤️

Bitcoin may little correct and then continue to grow in wedgeHello traders, I want share with you my opinion about Bitcoin. Analysing the current chart, the market behaviour becomes much more understandable. Initially, Bitcoin was moving inside a clean upward channel, showing steady growth with rebounds from the support line and multiple corrective phases. After a strong breakout above the buyer zone, the price maintained bullish momentum and reached the current support level at 88500. Later, BTC consolidated within the support area, confirming its role as a springboard for the next impulse move. The price eventually broke higher, leaving the channel behind and forming a new structure, an upward wedge. This wedge is a natural development after a strong uptrend, often suggesting that the price may continue climbing toward the upper boundary before any potential reversals occur. At the moment, BTC is trading between the wedge's support and resistance lines, precisely respecting both structures. Small corrective pull-backs have already been observed, but buyers quickly defended the support area, keeping the bullish structure intact. Given the clear market structure, the strong breakout momentum from the support area, and the continuation pattern in the form of the upward wedge, I expect Bitcoin to continue moving higher toward the 97000 points, which aligns with the resistance line of the wedge. This level also serves as my TP1 for the current bullish move. Please share this idea with your friends and click Boost 🚀

BITCOIN - Price can exit from wedge and rise to $100K levelHi guys, this is my overview for BTCUSDT, feel free to check it and write your feedback in comments👊
Some days ago price reached resistance line of triangle and then, in a short time, declined to $80300 level.
Price broke $92000 level and then some time traded inside triangle, where it reached this level again and then corrected.
Later BTC exited from triangle and entered to wedge, where it first declined below $80300 level, but later turned back.
Then it continued to move up inside wegde, where it later made correction to support line and then rose to $92000 level.
Soon, price broke this level and even reached resistance line of wegde, after which it corrected and continues to rise.
Possibly, price can bounce up from support area to $100K, thereby exiting from wedge pattern.
If this post is useful to you, you can support me with like/boost and advice in comments❤️

Bitcoin can make small correction and then continue to growHello traders, I want share with you my opinion about Bitcoin. Earlier, the price of price was consolidating for quite some time inside a broad upward wedge. The market found consistent support near the buyer zone, forming a solid foundation for future growth. After several rebounds, the bulls pushed BTC higher, and the pair exited the support area with a clean breakout. The movement above the current 86000 support level was accompanied by a strong bullish impulse, confirming the breakout from the wedge and validating the upward momentum. The price respected the structure of the wedge well, reacting to both the resistance and support lines along the way. After the breakout, Bitcoin reached a new high near 94000, where it turned around slightly, indicating the beginning of a local correction. Now BTC is hovering just above the broken wedge, and I believe a short-term decline, likely before continuing further upward. Given the wedge's structure, the bounce from the buyer zone, and the breakout with confirmation, I remain bullish on Bitcoin. My TP1 remains at 97000 points, which corresponds to the next key resistance above the current price range. Please share this idea with your friends and click Boost 🚀

HelenP. I Bitcoin may drop from resistance zone to $84K pointsHi folks today I'm prepared for you Bitcoin analytics. After spending several days consolidating below the resistance area, Bitcoin finally pushed higher and retested the 87500 level. This resistance was already confirmed multiple times in the past, and now it aligns perfectly with the upper boundary of the resistance zone at 88200 - 87500. The price made a sharp rally toward that level after bouncing from the support zone at 81200 - 80500, where bulls managed to defend the trend line. Currently, BTC is trading just under the resistance zone, showing early signs of rejection and slowing momentum. The price structure still respects the trend line from below, but the positioning beneath resistance, combined with the triangle formation, suggests potential exhaustion at the top. Given the repeated tests of resistance and the overall pattern, I expect BTC to decline from this level and move down, breaking the trend line and exiting the triangle pattern. For this case, I set my goal at the 84000 points. If you like my analytics you may support me with your like/comment ❤️

BITCOIN - Price can little correct and then make impulse upHi guys, this is my overview for BTCUSDT, feel free to check it and write your feedback in comments👊
Recently price broke through the $79500 zone after a long phase of flat consolidation and sharp shakeout.
Once bulls reclaimed control, price formed a clean breakout and started building structure inside a wedge.
Momentum carried the price upward, with buyers defending each local dip and creating a stair-step rise.
Now BTC is moving steadily inside the wedge pattern, holding the lower trendline with no strong rejection.
Price is slowly grinding toward the key resistance around $88500, where volatility might return.
If this tempo holds, I expect BTC can grow higher and tag the $91000 points in the next impulsive leg.
If this post is useful to you, you can support me with like/boost and advice in comments❤️

Bitcoin may exit from pennant and fall to support levelHello traders, I want share with you my opinion about Bitcoin. Over the past weeks, the price traded inside a broad horizontal range, repeatedly testing the boundaries of the seller zone and the buyer zone. After several failed breakouts, the price sharply dropped from the upper range and entered a phase of lower highs, forming a downward pennant structure. Inside this pennant, the market continued consolidating under pressure from the resistance area. Each attempt to break above the resistance line was met with rejection, confirming strong selling interest near the current resistance level at 88500. At the moment, BTC is testing the upper boundary of the pennant again. This area aligns closely with the resistance level and the long-term descending trendline. Given this confluence and historical rejection zones, I expect BTC to face resistance and reverse, initiating a decline back toward the 79000 support level, thereby exiting from the pennant, which is my current TP1. The compressed price structure, repeated rejections, and clean pattern formation support this bearish outlook in the short term. Please share this idea with your friends and click Boost 🚀

People Used To Get Scared - BTC / USDMorning folks,
Read the chart, it contains all information.
I figured since I didn't update my inverted Adam & Even pattern chart much I'd just create a new one, but check it out, its playing marvelously.
Trade thirsty!

HelenP. I Bitcoin will drop, thereby breaking trend lineHi folks today I'm prepared for you Bitcoin analytics. Recently, price has been trading in a narrowing structure, forming a triangle pattern with a strong ascending trend line acting as support. This bullish line began developing after the price reversed from the 78500 - 79000 support zone, where buyers showed a clear reaction, initiating a sustained upward move. As the price kept bouncing along the trend line, it gradually climbed toward the upper boundary of the triangle. Eventually, Bitcoin reached the resistance area near 86500, which aligns with the broader resistance zone between 86500 and 87000 points. This zone has previously acted as a ceiling for price action, and once again, it triggered selling pressure. After the rejection from this area, the price corrected back to the trend line and is now hovering near it, testing its strength. Given the structure of the triangle, the repeated rejection from the resistance zone, and the current consolidation under resistance, I expect BTCUSDT to break below the trend line and decline. That's why I set my goal at 82000 points. If you like my analytics you may support me with your like/comment ❤️

Bitcoin can exit from wedge and then drop to support levelHello traders, I want share with you my opinion about Bitcoin. Earlier, the price was moving inside a broad horizontal range, with clear rejections from both support and resistance. The lower boundary of this range was located near the support level at 81200 points, and the market found solid footing there. After a series of bounces, BTC gradually started to grow, breaking out of the lower range and forming a new short-term trend. The growth accelerated after the price exited the buyer zone, leading to the development of an upward wedge. Within this pattern, BTC continued climbing and eventually broke through interim resistance levels, reaching new local highs. The current movement shows clean reactions to the support and resistance lines of the wedge, with the price respecting the structure closely. Now, BTC is approaching the resistance level at 88500, which aligns with the upper boundary of the previous range and borders the seller zone. The combination of this resistance and the narrowing wedge formation increases the probability of a bearish reversal. Given this setup, I expect BTC to reverse soon and continue moving down toward the 81200 support level, which remains my current TP1. Please share this idea with your friends and click Boost 🚀

HelenP. I Bitcoin will rebound from trend line and drop to $80KHi folks today I'm prepared for you Bitcoin analytics. After multiple attempts to break through the resistance zone between 88500 and 89800 points, Bitcoin continues to respect the upper boundary of the descending wedge. The price remains confined within this structure, with each test of the trend line resulting in a rejection. The most recent rally brought Bitcoin back into the resistance area and right up to the trend line once again, but the breakout didn’t happen. Earlier, Bitcoin bounced strongly from the support zone between 80000 and 78800 points, forming a local bottom before initiating its move upward. However, even after this strong bounce, the price still failed to break above the trend line, confirming that bearish pressure remains active. The resistance zone has rejected the price four times, reinforcing its significance. Currently, BTCUSDT is trading just below the trend line and inside the wedge. Given the repeated failures to break higher, the strong supply zone, and the continuation of the downward pattern, I expect Bitcoin to reverse again and fall back toward the 80000 level. That's why this level is my current goal. If you like my analytics you may support me with your like/comment ❤️

BTC — Bulls in Full Control | Next Stop $87K+?Bitcoin just smashed through the resistance around $84,300, and the bullish momentum is 🔥
Now we’re heading straight into the next key zone at $87,000–$88,765, which lines up perfectly with previous supply.
If bulls keep this pace — a clean push toward 87K looks very real in the coming sessions.
Entry: $84,500 – $85,500
TP: $86,800 – $87,000
SL: $83,500
More thoughts in my profile @93balaclava
Personally I trade on a platform that offers low fees and strong execution. DM me if you're interested.

HelenP. I After strong impulse up, BTC can start to declineHi folks today I'm prepared for you Bitcoin analytics. BTC has recently shown a strong recovery after reaching the support zone between 77000 and 76200 points. This area had already acted as a base twice in the past, and the price once again reacted from it with a sharp bullish impulse. The rise brought Bitcoin back into the resistance zone between 83500 and 84300 points - a level that has proven significant in the past. At the same time, BTC approached the descending trend line that forms the upper boundary of the wedge pattern visible on the chart. The reaction from this confluence zone was immediate. The price got rejected right at the intersection of the trend line and resistance zone, forming a clear rejection candle and showing weakness from buyers. This area is now holding Bitcoin down once again and proving itself as a strong supply zone. At the moment, BTC is trading below the trend line and under pressure from resistance. Given the recent price action, multiple rejections from the same zone, and position relative to the wedge, I expect Bitcoin to decline again toward 78000 points - my current goal. If you like my analytics you may support me with your like/comment ❤️

$BTC consequences of the Trump 90 days tariff pauseCan It Last? Is This a Trend Reversal?
Today, #Bitcoin surged over +8%, but surprisingly, #Tesla outperformed with a massive +20%—almost as much as $FARTCOIN! 🤯
History is being written, and we’ll remember this day… but is this truly the end of the consolidation phase?
What to Watch:
📈 Price Action: Bitcoin must break above the descending trendline (in green) and close a daily candle above it to flip resistance into support. The price to watch is $84.5k. Closing under 80k would invalidate this pump.
📊 RSI: Currently in mid-range—could swing either way.
🔁 MACD: Was turning bearish. We need a clear bullish crossover to confirm a trend continuation.
Conclusion:
With all the recent global tensions, many investors are feeling a sense of relief, especially as the trade war appears paused until September. This gives markets some breathing room to recover.
However, it’s not all clear skies yet:
Bitcoin is still stuck inside the descending bearish channel.
The recession risk hasn't gone away.
Trump may have been pressured to offer good news to avoid a full-blown market crash.
🕵️♂️ Let’s see how the weekly candle closes after this sharp move to the upside.
