BTCUSDTHello Crypto Lovers, This is a 1D frame analysis for BTCUSDT Friends, as you can see, our previous analysis has panned out and friends had requested an update, we have reviewed the market in a lower timeframe. Currently, the price has hit our 4 hour support zone and the previous candle has closed positively which can be good news but Bitcoin is in a range where if our 4 hour support zone is completely broken we expect a pullback or maybe a high selling pressure with no possibility of pullback and move towards its support line. But let's draw a conclusion Warning: This is just a suggestion and we do not guarantee profits. We advise you to analyze the chart before opening any positions. Take care
Btc-usdt

#Btc | #Usdt#Analysis | #BTC | 1H | #NUM_A51
As we said in the previous analysis, Bitcoin is located in a rectangle
And the area of resistance and support is the same as the previous analysis
4H Support & Resistance
Support area: 29834.2 ~ 29550
Resistance area: 31008.5 ~ 31435.3
15m Support & Resistance
Support area: 30583 ~ 30624.8
Resistance area: 31375.1 ~ 31318.5

Keep an eye on $BTC/USDTBTC/USDT update:
Wait for the breakout which is $48000 or breakdown of the resistance level at 29000, followed by a successful reclaim of target levels.
Did you find this crypto market analysis helpful? Stay updated about the latest crypto market update.
Please continue to follow my analysis and feel free to ask any queries, you may have. I am here to assist you.
TradingView: @FarmanBangashh

Lpt Analysis Breaking Trendline In H12 Incase Of Breakout Expecting 55 to 60% Bullish Wave Seems Like Ready For Massive Bullish Wave

Finally Fil Breaking out Formed Descending Channel & building Up For Massive Breakout Incase Of Breakout Expecting 240 to 260% bullish Rally In Midterm

Xrp On Verge Of Massive Breakout Formed Symmetrical Triangle While Moving Towards Crucial Horizontal Resistance Once Both Got Cleared Midterm Target Would Be 1.50$

BTCUSDTHello Crypto Lovers, This is a 1D frame analysis for BTCUSDT As you can see, the price is bouncing towards the resistance line of 30,000 USD. At present, if the price cannot break the first resistance line, we expect a correction to the first support line and it can complete the pullback and if the support holds and the pullback pattern completes, it can move back towards its resistance line. But due to the price compression, there is a possibility of price increase and breaking the resistance line. If you don't want to take too much risk, Warning: This is just a suggestion and we do not guarantee profits. We advise you to analyze the chart before opening any positions. Take care

🔥 Stablecoins Are Predicting A Massive DumpIn this analysis I want to take a look at the stablecoin (USDT/USDC) dominance. To construct this indicator yourself, simply put "(CRYPTOCAP:USDT+CRYPTOCAP:USDC)/CRYPTOCAP:TOTAL" in the symbol search area.
As seen on the chart, the stablecoin dominance (the stablecoin value / all crypto value) has been steadily rising over the years. There can be a multitude of reasons for the rise, but more important in this analysis is the fact that the stablecoin dominance seems to follow a clear bullish channel pattern, where it bounces from both the top resistance and the bottom support.
The stablecoin dominance is currently closing in rapidly on the bottom support. The last three times that the stablecoin dominance reached this support it always pinpointed a local Bitcoin top and signaled an incoming dump.
Will this happen again in the near future? We can't say for certain, but historically we're getting very close to a moment where Bitcoin can dump. There's definitely more room to grow, but risk is on the horizon.
Best case for the bulls would be that the dominance would fall through the support and continue to go down.

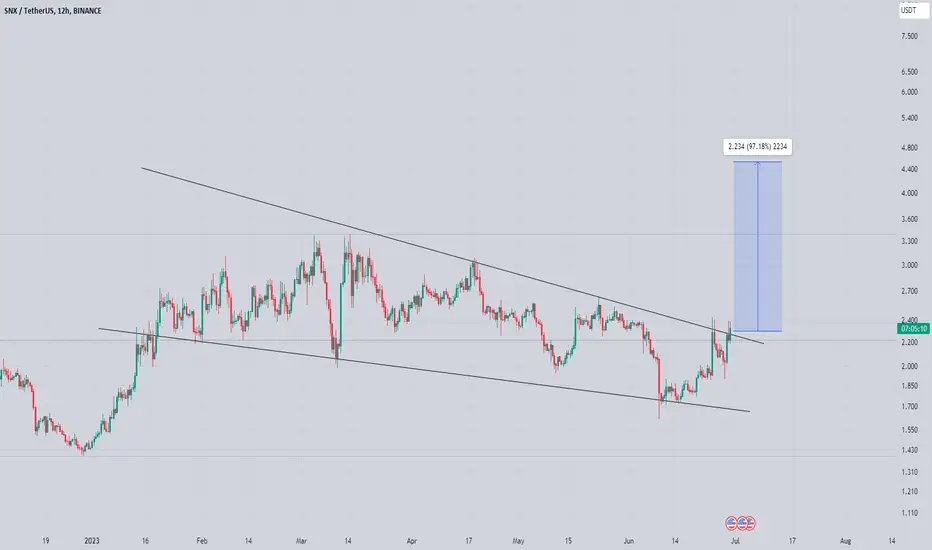
Snx Finally Breaking out Seems Like Getting Ready For Another Massive Bullish Impulse Formed & breaking Falling Wedge Incase Of successful Breakout Expecting 80 to 90% Bullish Wave
#Btc | #UsdtBitcoin is in a rectangle on the one-hour time frame
Bitcoin support now: 29834.2 ~ 29550
Resistance area: 31008.5 ~ 31435.3

Bts Looks Promising For Decent Recovery Formed Descending Channel In 3 Days Tf Incase Of Breakout Expecting 200 to 220% bullish Wave Look For Entries on lower timeframes

🔥 Bitcoin Short-Term Channel Break Out: Patience!BTC has been trading slighly bearish every since we made a new 2023 high a few days ago. Some consolidation was to be expected after the huge pump that we got earlier.
I'm anticipating a bullish break out of the channel. To confirm the break out, I'd advise to wait patiently for the candle to close above the resistance.
Stop at 30.500, target at 32.000, more defensive traders might want to take some profits around 31.400

BTCUSDT.1DHello Crypto Lovers, This is a 1D frame analysis for BTCUSDT As we can see, the price was able to experience a good rise after breaking the resistance line and bring its momentum towards the first resistance line. However, we can currently see a weakness in the trend and we have two scenarios in mind. Scenario one: We expect the price to be able to bring itself towards the first support line and then, with support and higher line stability, to start its upward trend again. Scenario two: If the price is able to stabilize above Warning: This is just a suggestion and we do not guarantee profits. We advise you to analyze the chart before opening any positions. Take care

Finally Arb Showing Strength Seems :Like ready For Bullish impulse Falling Wedge Breakout & Retest Has Already Done expecting 50 to 55% Bullish Wave In Midterm

Near Getting Ready For Massive Breakout Seems Like getting Ready for Massive Breakout Formed Descending Channel In 2 Days Timeframe Incase Of Breakout Expecting 220 - 250% Bullish Wave📈

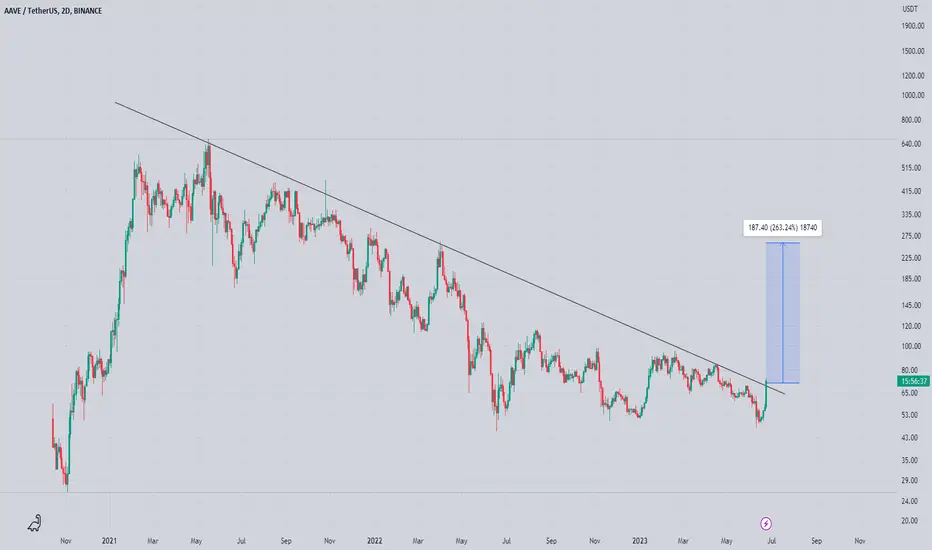
Aave Looks Promising for Midterm Seems Like Getting Ready For Massive Breakout Testing Trend line In 2 Days Timeframe Incase Of Breakout Expecting 240 - 260% Bullish Wave
Keep Eyes On Aave For breakout
Finally Ankr showing Signs Of Life Forming 2 Pattern At Same Time Forming descending Channel While Breaking Falling Wedge too Once both Got cleared Bounce will Be epic Incase Of successful breakout expecting 5 to 6x in midterm

🔥 Bitcoin Finally Breaking Out After Months Of Selling?BTC has been trading inside a bearish channel since we topped out at the start of April. Effectively, nothing interesting has happened for 2 months.
As of today, BTC is yet again testing the top resistance of the channel. This signal assumes that we're going to break out of said channel, making it a bull-flag break out. Please be patient for the break out to confirm!
With many alts trading around their 2023 lows, there's a lot of upside to be had in the alts, but for now we're looking at BTC.
Stop below the most recent swing low. Target placed at the 2023 highs.

Finally Doge Showing Some Strength Seems Like Ready For Massive Bullish impulse Descending Channel breakout has Already Confirmed Retesting In Process Incase Of Successful Retest expecting 40 to 45% bullish wave

Bico Looks Good For Solid Recovery Seems Like Getting Ready For Massive Recovery Formed Falling Wedge In Daily Tf Incase Of breakout Expecting 120 to 250% Bullish Wave

BTCUSDT.1DHello dear friends,
*Mars Signals Team wishes you high profits*
This is a one day time frame analysis for BTCUSDT.1D
We are in the daily time frame. As you can see, the price is completing the cup pattern. And we have two scenarios in mind.
First scenario: If the price can stabilize above its first resistance line and break its strong resistance zone, we can say that the price can start an upward rally.
Second scenario: If the price is weak after hitting the resistance line and cannot move above the resistance line, we can experience a price correction because the price has tried and failed to break this area several times. But there is a possibility of breaking this area and it is not far from imagination
Warning: This is just a suggestion and we do not guarantee profits. We advise you to analyze the chart before opening any positions.
Take care

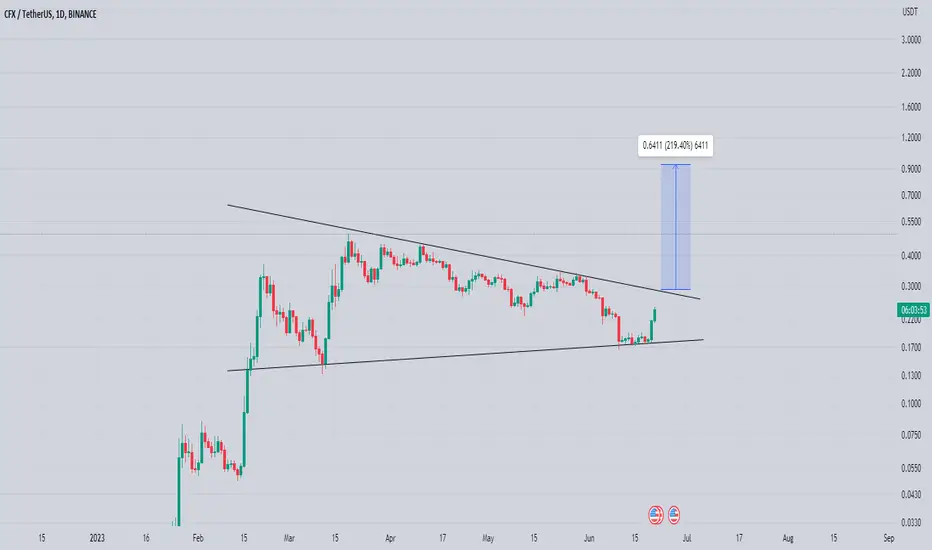
cfx getting ready for another massive bullish rally Seems Like Getting ready for Another Massive bullish Rally
Forming Bullish Pennant In Daily Timeframe Incase Of breakout Expecting Another 180 - 200% Bullish Wave
Op Looks Ready To Test 2.20$Seems Like correction Is Already Over Formed Descending Channel in h4 tf incase Of Breakout expecting move towards 2.20$
