Sand Preparing For Massive recovery Seems Like getting ready For Massive Breakout Formed Descending Channel In 3days Timeframe Incase Of Breakout expecting 250 to 280% Bullish Wave
Btc-usdt


Super Retesting Crucial Support Seems Like Ready for solid gains Descending Broadening wedge Breakout Has already done Retesting In Process Incase Of Successful retest Expecting Move towards 0.70$ In Midterm

Mask Breaking Crucial Resistance eseems like getting ready for solid recovery Formed Descending channel In h4 timeframe Incase Of breakout expecting 45 to 50% bullish wave


BTCUSDT.4HHello dear friends,
*Mars Signals Team wishes you high profits*
This is a 4 hours time frame analysis for BTCUSDT
We are in the 4 hour time frame and as expected the price has managed to move to our first support zone. Currently, the price is moving in a descending channel and has reached the ceiling of our channel. If the price can't penetrate above our first resistance line, we expect more fall, but if it can penetrate and stabilize above our first resistance line, we expect an increase to the second critical area.
Warning: This is just a suggestion and we do not guarantee profits. We advise you to analyze the chart before opening any positions.
Take care

Pepe still looking good Seems Like ready for another bullish impulse Descending Channel breakout Has already confirmed Retesting In Process Incase Of Successful Retest expecting Another 45 to 50% bullish Wave

🔥 Using Manufacturing PMI To Trade Bitcoin CyclesWhat is the Manufacturing PMI (investopedia)?
The Purchasing Managers' Index (PMI) is an economic indicator that measures the direction of trends in manufacturing and service sectors through a diffusion index. The PMI provides information about current and future business conditions to decision-makers, analysts, and investors. The PMI is based on a monthly survey of supply chain managers across 19 industries, covering both upstream and downstream activity. The PMI affects economic decisions by helping managers in a variety of roles to make production, purchasing, and inventory decisions. Investors can also use the PMI to their advantage, as it is a leading indicator of economic conditions that can yield profitable foresight into developing trends in the overall economy.
To offer better readability, I added a 10-period simple moving average to the PMI.
As seen on the chart, we can derive quite a lot of forecasting power from the US PMI. Once it bottoms BTC tends to go up, and once it tops BTC tends to go down. Even easier: a downward sloping moving average is bad and an upward sloping moving average is good for the markets.
As seen on the chart, it appears that the PMI has bottomed in November of 2022. Since then, both crypto and stocks have not made new lows and are grinding upward.
In the future, I suggest you add the PMI indicator to your long-term market analysis to determine whether it's a favorable time to buy or not.

#BTC | #Usdt#BTC In the time frame of 15 minutes, it is located in a rectangle
The ceiling of this rectangle is the price area of 27756.6 and the price floor of this rectangle is 27282 ~ 27339.7
If the rectangle breaks upwards, the price can rise up to the green lines indicated in the chart

Kmd Getting ready for further Bullish Moves Seems Like Kmd Getting Ready for another bullish impulse Formed & breaking Falling Wedge In h4 Timeframe Incase Of Successful breakout expecting Another 40 to 45% bullish wave

Dot Looking Good For decent recovery Has Already Bottomed Out Falling wedge breakout Has Already Done Retesting In Process Incase Of Successful Retest Expecting Decent Recovery Expecting 240 to 270% Bullish Move

XRP USDTGOOD MORNING MY FRINDS
as you see in xrp chart in 4h frame we have reversal head and shoulder
I hope you will get it
thank you

#BTC | #UsdtBitcoin is in a triangle on the 15 minute time frame
Its momentum is currently bullish in this time frame
Its trend is also upward
But the price is in the dynamic resistance area of this triangle and you should not enter the position before this triangle is broken up or down.

Super Breaking crucial resistance seems Like has Already bottomed Out &Formed& breaking Descending Broadening Wedge In daily timeframe With Horizontal Resistance Once Both Got Cleared can expect Solid recovery In Midterm Incase Of successful Breakout Expecting 200%+ bullish Wave

Elf Getting ready to continue Its bullish Momentum Seems Like Getting Ready To Continue Its Bullish Momentum Forming Biullish Pennant In H8 Timeframe Incase Of Successful Breakout Expecting Another 45 to 50% bullish Move

BTCUSDTHello to all small and big traders, today I was checking all the empty spaces of CME when I noticed 3 gaps that have not been filled yet, one is in the area of 34000 to 34800, one is in the area of 21000 to 20000 and the other is in the area of 9500 to 10600. It doesn't matter if it is filled, but it must be filled. This plan is for a long-term view. Now or first, we will pay 34,000 dollars, and then the drop and the new floor, and then we will move right at the time of halving for the new ATH, or it will be filled later, whatever the case may be. be careful .

BTCUSDT UPDATE !btc was unable to penetrate the price of 30,000, then btc drops from 30,000 to 28,200 held by ema 200
In my view, BTC will experience an increase for a retest, before finally continuing its decline
GoodLuck guys !
*Follow for another Signal, free!
DYOR

🔥 Bitcoin Potential Perfect Bearish ChannelAfter a failure to break through the 30,000 resistance three times, it appears that the bulls have given up and the bears took over.
When we connect the two local tops and copy that trend line to the bottom, we create a perfectly symmetrical channel.
It's unclear whether we're going down all the way to the support line of the channel, but I have to agree that things have started to look more bearish after we topped at 31,000.
With the FOMC interest meeting around the corner, we have to consider the idea that Powell will announce that he won't cut the raise, and potentially even raise more in the future, leading to a bearish reaction.
Time will tell.

#Btc | #Usdt#Analysis | #Btc | NUM_A33
Bitcoin is in the risky zone in the four-hour time frame
It has a resistance (daily channel midline) and a strong daily static resistance in the way
As a result, manage your long positions before breaking these areas upwards

KNCUSDT → Strong consolidation after a resistance break KNCUSDT forms a breakout of range resistance. But this maneuver came at the time of correction of bitcoin and the whole market, so these nuances restrain further growth of KNC.
The coin after the resistance breakout forms consolidation in a narrow range, forming a strong support area below 0.600 and a strong resistance at 0.750.
The moving averages are also indicating lower volatility and a period of consolidation.
Price is forming multiple retests of the strong resistance area, I think that with positive leverage from bitcoin and more positive market sentiment, price will still break that area.
Strong support: 0.650, 0.600
Strong resistance: 0.750 (breakout strategy) 0.850
I expect that the price will continue to test the resistance at 0.750 and after the next attempt it will still be able to break it and will start to realize the accumulated potential.
Regards to R. Linda!


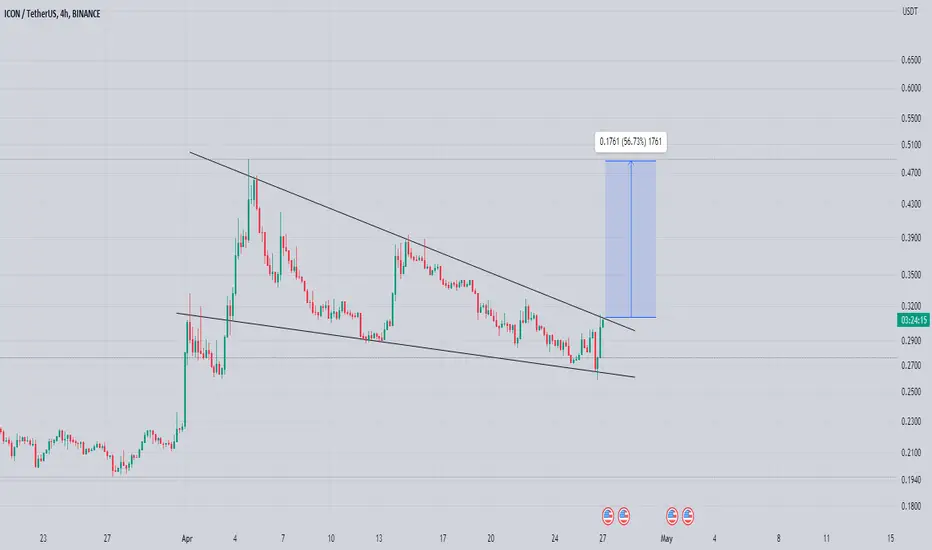
Icx Getting ready For another bullish Impulse Icx Getting ready for Another bullish impulse Formed Falling Wedge In h4 Timeframe Incase IOf breakout expecting Another 45 to 50% Bullish Wave