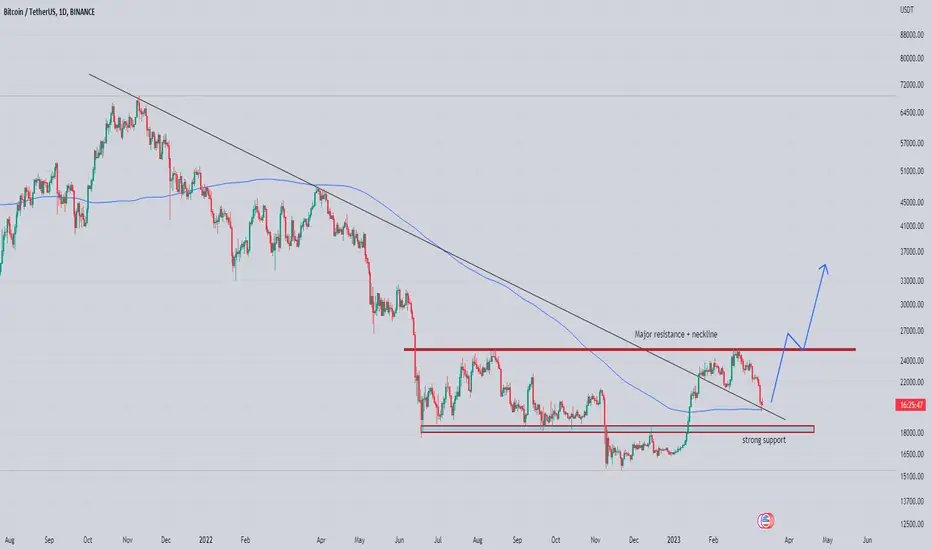
Bitcoin AnalysisRetesting Trend line+ 200 Sma In Daily Timeframe & Facing Rejection
Incase Of Successful Retest Expecting Sharp Move Towards Recent High 25k
And Once Major Horizonal Resistance+ Neck Line Got Cleared Next Target Would Be 37k
how ever btc can test horizontal support between 17500 to 18500
Btc-usdt
I think Bit can reach around $16,500 and $16,000I think Bit can reach around $16,500 and $16,000
If Bitcoin can lose the range of around $18,500 and $18,000, it can reach $16,000

BTC come back to flat - go down to 12000 and lowWell, dear crypto addicts, let's go back to flat and most likely fly down by 12-10-8-6-4 k$ this spring. Wellcome!

USDT.D + USDC.D is UPUSDT.D + USDC.D finished testing the broken trend and started to move up again
This will be bad for Bitcoin until we brake down the upper trend line.
It is not a financial advice , DYOR

micro update for BTC -15% 🩸These trades reflect my trading history and are not investment advice and I am not your financial advisor
Trades will be updated on the same published chart such as Take Profit, Early Exit or Partial Exit..... Good luck to all

Finally Vgx testing Crucial resistance seems Like getting ready for massive breakout
Forming symmetrical Triangle In daily timeframe Incase Of breakout expecting 200 to 220% bullish move

Imx Breaking Out Getting Ready for another Bullish Move
Formed Text Book Bullish Pennant In 6h Timeframe & breaking Out Of The Pennant
Incase Of successful Breakout Expecting 45 to 50% bullish move

Gmx Still Looking goodSeems Like getting Ready For another Bounce
Forming Bullish Flag In h4 timeframe
Incase Of Breakout expecting Another 30 to 35% bullish Move

Wing Breaking Trendline Breaking trendline In H1 Timeframe Incase Of successful breakout expecting 20 to 25% bullish move

ata Getting ready for bullish impulse Seems Like ata Is Ready For bullish impulse
Trendline & Inverted Heads And Shoulders Breakout has already done retesting In process Incase Of successful Retest expecting 15 to 20% bullish move

Xrp Building Up For Massive Breakout seems Like Getting Ready For Massive Bullish Move
m
Forming Symmetrical Triangle In 3 Days timeframe Incase Of Breakout expecting 600 to 800% Bulish Move

Pha Breaking Falling wedge Seems Like getting Ready For another Bullish Impulse
Forming Falling Wedge In h4 Timeframe Incase Of breakout Expecting 30b to 35% Bullish Move

Usdjpy Breaks Rising wedge Seems Is ready for bearish move
Rising wedge has Already broken expecting 280 to 300 Pips Bearish move

Neo Still Looking Good Seems Like Neo getting ready For Another Bullish Impulse
Forming bullish Pennant In h4 Timeframe Incase Of breakout expecting 30 To 35% Bullish Move

Ltc Getting Ready For Massive Breakout Seems Like Ltc Has Bottomed Out In higher timeframes
Forming Descending Channel In # Days Timeframe
Incase Of breakout expecting #20 To 340 % Bullish Move
Always Wait For confirmed Breakout Without Breakout Ltc Will Remain Bearish

🔥 A Collection Of Analyses Why Bears Are WRONG On This MoveOver the past weeks I've made several bullish longer term analyses on Bitcoin and the markets in general. In my view, the bottom is in and we're likely going to continue this bullish move for the next few weeks.
Still, there's plenty of bearish investors. Yes, the macro is bad and a recession is likely, but that doesn't mean we can't go up. After 1 year of selling there's simply little left to sell, so the easiest path is up.
Below I've made a collection of analyses and charts that all signal that the bottom is in and better times have come.
1) See the main chart. We bounced off the ~6 year support.
2) The PMO indicator has flashed a buy signal. This is a great indicator to catch big moves.
3) Bitcoin's monthly RSI is curling up, after reversing from support.
4) The crypto bear market has lasted exactly the same time as last bear cycle. Note that the bull-cycle has lasted equally long as well!
5) Bullish divergence on the BTC weekly chart.
6) A break out through the long-term bear market resistance.
7) The dollar index (DXY) is falling like a brick. A weak dollar is generally great for the markets. Every BTC bull-cycle was accompanied by a weakening dollar.
If you enjoyed this overview, please like this post. Have more bullish charts? Please share them below!

Dydx Getting Ready For Bounce Seems Like Dydx Getting For another Bulish impulse
Forming Bulish Pennant In h4 Timeframe
Incase Of breakout expecting Another 50 to 55% bulish Move

Snx Looks solid For recovery Seems Like Snx Bulish Moves Will Continue
Forming Bulish Pennant In h4 timeframe
Incase Of Breakout Expecting 40 to 45% Bulish Move

Apt Looking Strong Forming Bullish flag In h8 Timeframe
Incase Of breakout expecting Another Bullish Impulse
Incase Of breakout expecting 55 to 60% Bullish Move

Mkr Approaching Towards Crucial Resistance Seems Like Mkr has already Bottomed Out
So far consolidating In More Then Year Old Descending channel ( Keep In Mind The More It Will Consolidate The Higher Chances Will Be For breakout)
Now approaching towards Major Trendline Incase Of breakout Expecting 280 To 300% bulish Move
wait patiently for breakout for entry

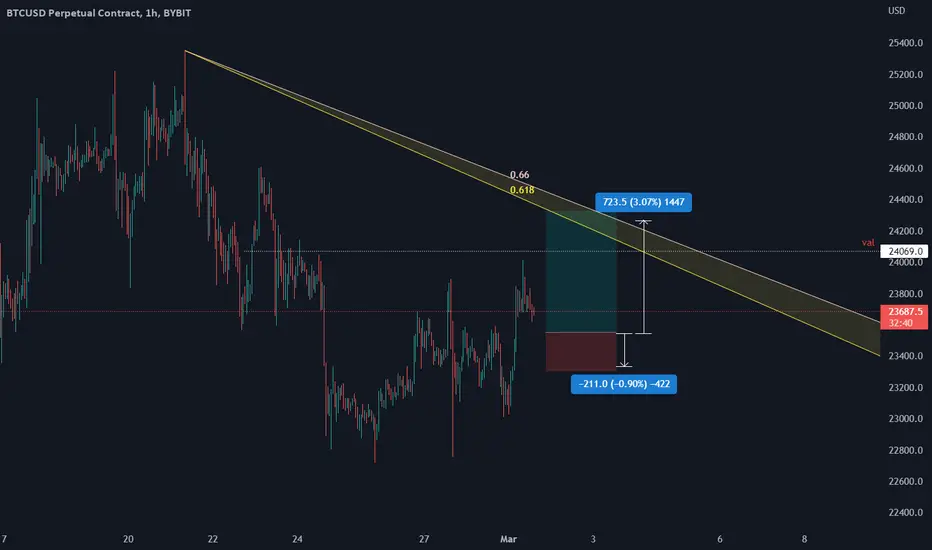
new scalp long .check reaction on the SR level and if we have a nice reacting the long can be open . check as well FIB below we have POC and VAH below the range SR .
Have a nice day and ride safe !
Sushi Forming Bulish Pennant Seems Like Preparing For another Bulish Move
Forming Bullish Pennant Incase Of Breakout Expecting 55 -60% Bulish Move
Keep Eyes On For Breakout

Siacoin Getting Ready for Another Breakout Seems Like Will Continue Its Uptrend
Forming Bulish Pennant In H4 Timeframe Incase Of Breakout Expecting 35 -40 Bullish Move
