InvestMate|Bitcoin a breath of optimism ₿₿ Bitcoin a breath of optimism.
₿ I must admit that my attitude about Bitcoin has changed slightly.
₿ After what I have seen in the last few days, I am no longer as bullish as I was before.
₿ Which does not change the fact that one cannot be negative about a given asset because it did not follow a pre-determined scenario.
₿ I come to you today with something fresh, an upside scenario set on low intervals.
₿ Likely to be implemented in the next few days.
₿ Let me start by saying that, despite the new lows, I believe that Bitcoin could make a bigger upward correction at this point.
₿ I have set a support zone around the 0.5 fibo level of the current upward wave after the new low was hit.
₿ I determined the resistance zone based on the fibo cluster of two levels. The first is the fob level of 0.236 of the entire downward wave from the peak at around 21.5k and the second fibo level is 0.5 of the entire downward wave from the execution of the largest upward correction after the first drop.
₿ I believe there is a high probability of an upward breakout from the triangle we are currently in and reaching the resistance zone.
₿ The scenario I am playing out is to maintain the upward direction with a local stop near resistance.
₿ *Please do not suggest the path I have drawn with the lines this is only a hypothetical scenario.
🚀If you appreciate my work and effort put into this post I encourage you to leave a like and give a follow on my profile.🚀
Btc-usdt

BTC New TargetBTC New Target
Bear vs Bull
Once again we look at Bitcoin (XBT) short-term.
We have a recent bullish move... What happens next?
Above the blue and grey lines the bullish move can continue.
Immediate resistance is also found at the black line or MA200 ($16,483).
Looking at these three levels, XBT needs to move above the $16,500/$16,850 price range to knock out the bears.
Any trading below the blue line (~$16,615) can keep the bears alive and the drop resume.
If this level are conquered, then the balls passes towards the bulls.
More details on the chart.
Still red...
Namaste.

InvestMate|Bitcoin, prepare for declines ₿₿ Bitcoin, prepare for declines.
₿ As in the last post I perfectly predicted the increases. Link below:
₿ This time it came to attack the lows again.
₿ Looking at the chart and at Bitcoin correlation with the major indices, given the impending wave of US dollar appreciation. I believe that there is currently no room to rise.
₿ I think we may see a test of the 16k area. Where I have set a support zone.
₿ It was set based on the 0.618 level of the entire upward wave from the breakout of the new low.
₿ It can be seen that the area around the round 16k level. Has been a resistance as well as a support many times in the past. Therefore, I believe that level can still play an important role in the future.
₿ I have established a resistance zone around the current peaks.
₿ I do not exclude the possibility of testing this zone again.
₿ The scenario I am currently playing out is a gradual weakening of Bitcoin over time, taking into account smaller corrections along the way, reaching the support zone marked on the chart.
₿ *Please do not suggest the path I have drawn with the lines this is only a hypothetical scenario.
🚀If you appreciate my work and effort put into this post I encourage you to leave a like and give a follow on my profile.🚀

Btc 4H bearish ChartFOMO ALERT ⚠️
This is just a retest, please don't be fomo on this pump, according to bearish divergence on 4H chart we can expect a dump from here

MY PERSPECTIVE FOR XRP MIDTERMI DIDNT OPEN ANY POSITION ON XRP ITS ONLY technical analysis
These trades reflect my trading history and are not investment advice and I am not your financial advisor
Trades will be updated on the same published chart such as Take Profit, Early Exit or Partial Exit..... Good luck to all


BTC USDT BUY (BITCOIN - TETHER US)Hi there.
Price is forming a reversal pattern to change its direction.
Watch strong price action at the current levels for buy.

BTC can restest 18,900 In next week If we see technically btc ready for a pump around about 18,900 something
But Binance helted news may be can effect on market
So be careful watch news if binance will stable then I am 100% confirm btc will go up around 18,900
Then we expect hard dump

BTC USDT BUY (BITCOIN - TETHER US)Hi there.
Price is forming a reversal pattern to change its direction.
Watch strong price action at the current levels for buy.

InvestMate|Bitcoin An opportunity to seize💰Bitcoin An opportunity to seize
💰My attitude about Bitcoin has not changed, a bullish stance still prevails with me, especially after today.
💰After the US inflation readings in which I perfectly predicted that there would be a decline and a strengthening of the dollar. I invite you to read my post on the dollar that I published on 7 November.
💰Everything I wrote in that post came true.
💰After the Republicans won the mid term elections the dollar strengthened.
💰Falling inflation which is currently at 7.7%
Has cooled markets' anticipation of the next interest rate hike.
💰The market is currently pricing in an interest rate peak of June 2023.
💰Consequently, the market is already discounting in advance, as is always its nature, a strengthening of the dollar.
💰This opens up a great opportunity for Bitcoin.
💰Since the peak, we have already made a drop of a full 77.41%
💰For halving there is still some time to go, with predictions
it is expected to fall in the first half of 2024.
💰As we know from bitcoin's halving history, it has generated a new upward wave every time.
💰Will this be the case this time too?
💰Looking at the fact that we were in accumulation at the 20k level for about 140 days after which we hit new lows, which were very quickly overbought.
💰In the past, such dips to new lows were not so quickly bought. At a time when the Bitcoin market was not so regulated, dips after accumulations were left alone.
💰Currently, we find ourselves in slightly different times.
💰In a time of big interest groups interested in profits in the cryptocurrency market, I'm talking about the big investment funds and banks, colloquially known as whales.
💰Looking at the volume and purchases that are currently taking place on bitcoin, I can only guess
what levels the big players are dreaming of.
💰Being aware of the high correlation that exists between bitcoin and the world's most important index, the S&P500, I see a large divergence in this rule in recent days.
💰There has been a divergence of sorts, juxtaposing the recent rises in the indices with the falls in bitcoin
💰Was it a simple desire to ride for stops of exchange players and clear positions, looking at the losses reported by players here we are talking about billions lost as a result of falls to new levels
💰Assuming we are at the bottom. And that a return to lower levels is unlikely.
💰If we were to rally further I would watch the area around 16.5k. As there are strong fibo levels there which would provide very strong resistance in the event of a bottom.
💰Going back assuming this is the bottom, I decided to use a fibo grid measurement from ATH to the bottom which shows that the fibonacci levels overlap beautifully with previous resistance and support.
💰Please note with what precision they delineate past points of interest.
💰I also decided to use the pitchfork projections and again the overlap of the pitchfork lines coincides perfectly with the key resistances that bitcoin has ahead.
💰I am until amazed at this accuracy.
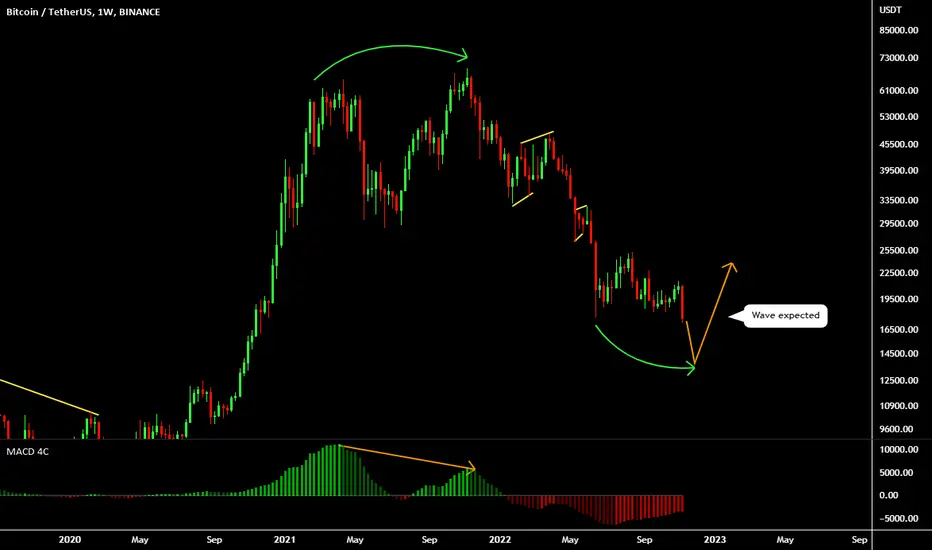
💰To top it all off using the divergence strategy on the MACD histogram. We have another bullish signal for the collection, the divergence unambiguously shows the moment to buy at the current location.
(The histogram is smaller and the price is lower)
💰Let's hope the downtrend on cryptocurrencies is a thing of the past
💰My opinion on Bitcoin does not change, I still think we are in great places to buy.
💰I hope my extensive analysis has helped you to better understand the Bitcoin chart
🚀If you appreciate my work and effort put into this post I encourage you to leave a like and give a follow on my profile.🚀

bearish divergence 4HOk this one is a little bit scary, I'm confused but i think we should expect a dump to the black line; please be careful of your position guys

🔥🚀WHY TWT SCYROCKETING❓ Trust WalletxTwitter SOON❓🔥 Hi friends! A lot of rumors are already appeared about Trust wallet and Twitter pertnership. Spaceman Mr. Musk told several times that Twitter will accept the crypto payments, that is why Binance is also participated in Twitter purchase.
✅ I mention you all the possible scenrio to buy TWT. If you open a trade, you already can book +150% profit of CLEAR PROFIT without any leverage. And i know that lots of my subs did it.
🔥 I marked for you the best entry point here:
1. squeeze to the trendline
2. test trendline as the support
3. test trendline as the support
4. test ATH (key level of $1.55 as support). Little bit risky, but was usefull.
🚩 Also, I should mention that the pro traders see how TWT grows and all cetpro market falls. It was the main sign of bulls on TWT.
📊 WHY TWT SCYROCKETING❓
The main answer is in this quote - "Now your keys, not your crypto". As you know, exchanges hold the crypto on their wallets and show you just the numbers of money that belongs to you, but can move your crypto, use it as they want.
🚩 A lot of crypto traders start to look for safer place to hold the crypto after the crash of FTX. The non-custodial wallets as Trust wallets or MetaMusk start to grow on this news and a lor of crypto starts to flow on it's balances as well. This crypto on your wallets are just your and no one can use it.
✅ CZ published the cold wallet balances before the pump, which trigger the bull trend of the wallet tockens. SFP as well as TWT start to pump.
🚩 When the price of TWT reach the ATH at $1.55, CZ tweet about TWT at his Twitter and repeat the famous quote. The altcoin reach $2.51 in 1 day (+60%).
🔥 The latest rumors that not spread so much yet is the partnership of Trust wallet and Twitter. As far as we can understand now is that the Trust Wallet will support Twitter users, store their crypto, accept payments etc.
📊 WHAT IS POSSIBLE TARGETS FOR TWT❓
My last target that already not closed is $4.8-5. TWT need to grow by 100% to reach this target. The news about Trsut wallet and Twitter partnership will launch this rocket to the moon🚀
It's good for scalpers who can find good entry point at the lower timeframes and for my subs that already bought and hold BTC.
✅ I think that $10 as well as $50 is possible, but a lot of things depends on BTC. Traders, if you want to know TOP Binance or related to Binance projects that can also skyrocket soon, check this idea.
Trades, was it idea usefull for you? Do oyu agree with my targets for TWT? Write in the comments!
💻Friends, press the "boost"🚀 button, write comments and share with your friends - it will be the best THANK YOU.
P.S. Personally, I open an entry if the price shows it according to my strategy.
Always do your analysis before making a trade.

Be ready For green days of Market Hello
Based on the chart
we expect to see Dump from here for USDT.D, Also as you know There is nothing 100% so be careful of your position .
Please, feel free to share your point of view, write it in the comments below, thanks

BTC/USDT BINANCEBTC/USDT BINANCE
4H hollows
A price rebound at the Golden Ratio of Fibonacci Retracement is expected, as it is the main Resistance Area.
Sideways movement between Support & Resistance Area is expected until Monday.
BTC = $16,855.78 +1.63%
13.32 ETH -2.47%
Market Cap: $846,597,962,034
24h Vol: $82,580,266,331
Dominance: BTC: 38.2%
ETH: 18.2%
Good Luck
#CryptoHellas Team

InvestMate|Bitcoin quick outlook💰Bitcoin quick outlook
💰This is a continuation of my last post on Bitcoin in which I switched to a broad perspective:
💰We have gone down to the 0.618 levels I wrote about in the post.
💰We are currently seeing a buying reaction at this level can we talk here about the end of the 2nd wave and the start of the 3rd upward wave.
💰I encourage you to observe
🚀If you appreciate my work and effort put into this post I encourage you to leave a like and give a follow on my profile.🚀

BTCUSDTPERP 3 Possible Scenarios Most likely one is the red scenario where we hit 14k if we don't get any positive news.
After that is the yellow scenario where the price consalitates between given lines
Least likely is the green one where we hit back to 21k mark.

BTC USDT BUY (BITCOIN - TETHER US)Hi there.
Price is forming a possible reversal pattern to change its direction.
Wait for the price to complete the pattern and watch strong price action for buy.


BTC USDT BUY (BITCOIN - TETHER US)Hi there.
Price is forming a possible reversal pattern to change its direction.
Wait for the price to complete the pattern and watch strong price action for buy.
BTC USDT BUY (BITCOIN - TETHER US)Hi there.
Price is forming a possible reversal pattern to change its direction.
Wait for the price to complete the pattern and watch strong price action for buy.

Huge volumes. Easy money!On the FTT coin there is a clearly formed level with 3 touches which has been relevant for almost half a year.Now the coin has super increased volumes, at which we have come to this level and begin to form a trade.I expect a rise to the level and accumulation to enter the impulse breakout.

BTC USDT BUY (BITCOIN - TETHER US)Hi there.
Price is forming a possible reversal pattern to change its direction.
Wait for the price to complete the pattern and watch strong price action for buy.

BTC USDT BUY (BITCOIN - TETHER US)Hi there.
Price is forming a possible reversal pattern to change its direction.
Wait for the price to complete the pattern and watch strong price action for buy.
