ETHW ETHPOW Pennant Failed, Now In Channel Target Is The SameETHW this is an update to my previous analysis. ETHW broke down and the bull pennant failed. Now in a descending channel, finding support around $10.50. People are selling their free ETHW coins right now so we need to be patient. This is also so new so analysis is hard because of liquidity at the moment. If ETHW breaks down out of this channel then we could see single digits. This is not trading or financial advice, just my opinion. Thank you for checking out my charts, follow me for more updates.
Btc-usdt

LUNA CLASSIC LUNAC Inverse Head And Shoulders, Rally Imminent!Hi guys another quick update on Luna Classic. It looks like Luna has formed a nice inverse head and shoulders on the bi-hourly and is about to test the neckline around .000295. A break would initiate a minimum move to at least .000345 but likely to hit .000358 at the next resistance. Then a small correction and back off to the races I believe. The daily is looking really good so this move should be a good one. All is invalidated if we break below .000255 and go back into the falling wedge/bull flag. Then Lunac would likely retest the support of the wedge at around .000221, and then we will re-evaluate. If this wedge breaks to the downside a major correction to around .0009 ish will probably play out, but i am not leaning towards that scenario as the indicators and charts are looking good right now. This is not trading or financial advice this is just my opinion, and this asset is extremely high risk and speculative; however the reward is also extremely high. Thank you and good luck everyone.

LUNAC Luna Classic : THE RUN IS STARTING, BIG MOVE COMING!LUNAC LUNA CLASSIC Has bottomed out on this correction and is now priming for another massive spike. My target is still at least previous highs and then probably much higher after that. This move is only about an hour away at most I believe, and a great entry point. This is not financial advice this is just my opinion. Thank you and good luck everyone.
30 MINUTE
1 HOUR CHART
DAILY CHART

ETHW ETHPOW USD : QUICK 2x Coming! This Thing Could Really Run!ETHW , ETHPOW, or Ethereum Proof Of Work, looks like its about to retest the previous high area. This could run pretty quick because there isn't very many coins for sale yet. The indicators are showing that a nice move is about to play out to the upside. Plus you never know this thing could really run. Lets say something happens with the new POS chain, where would everyone run to? They will probably go back to the original ETH where everything worked fine. Either way, this is high risk and just speculation, but the reward could be massive. This is just my opinion and not financial advice, good luck out there evryone.

ETH is Ready For LONG PositionETH / USDT is Going to get a good setup for LONG POSITION
you can get this position with LEV10 X
Good Luck & dont forget to set SL & TP

BTCUSDT - potential setupsBINANCE:BTCUSDT
Hello everyone!
🛎 Let check the trading idea for BTCUSDT
🤗 Not making anything difficult everything is pretty straightforward.
👉 1. Price goes ABOVE the selected range on the picture. Long positions to activate. 🟢
👉 2. Price goes BELOW the selected range. below. Short positions to activate. 🔴
----------------------------------------------------------------------------------------------------------------------------
⚠️ Important Notes:
1. Always follow your trading plan regarding entry, risk management, and trade management. ❗️❗️❗️
2. Timeframes: up to H4
----------------------------------------------------------------------------------------------------------------------------
😉 If you like the idea there was a like 🚀 and sign up so you can continue receiving great ideas like this one and also for us to make pattern the idea! 🤝
💪 Profitable lock for everyone! 🙏

BTC Falling Wedge!!🚀🚀The Falling wedge has formed in the Weekly chart and breaking the 23K level is considered as bullish sign. If the price continues to exceed above 25K i will take a Long Position Keeping my Take Profit at 48K level.
⚠️NOT A FINANCIAL ADVICE!!

bearish pattern but it like bullish I think BTC start to complete a bearish pattern .in this case it is possible price go up from here to the 50%of FIBO as I marked in chart.it will be like a W pattern when going up and you want to hold it for complete W pattern but it will go down sharp when price touch the 50% of FIBO green line in the chart .the red line is time for top or sell btc.

The strong rebounce of bitcoinThis should be the strongest and final rebound of bitcoin as it going further down. My prediction will be 16k before the bottom is really bottom.
We already hit 18k, and it immediately rebound to 19k, which apparently is a cat market - dead cat bounce.
Still the economy is not stable:-
1. The Ukraine war is escalating or there are no way out still, the USA still sponsoring Ukraine with millions of support. And Russia had determine to turn off the gas pipelines.
2. The China lock down or so call communism close down policy. Is rather fishy and insane or not making any sense. To just selfishly contain economy within China and remain exporting goods to outside. This mean that, they can make your money and you can not even make theirs.
3. The economy of whole world is frozen by covid-19 for 2 years and just seeing it start to melt. The melting process take longer than expected. People do not want to travel due to safety or rigid process. And yet some country do not want you to visit them. It's just not going back to pre-covid era.

MATIC USDT S/R LINESMATIC/USDT SUPORT AND RESISTANCE LINES M W D H4
matic usdt suport and resistance line in monthly weekly
matic usdt suport and resistance line in monthly weekly
matic usdt suport and resistance line in monthly weekly
BNB USDT ANALISIS TODAY BNB USDT SUPPORT AND RESISTANCE LINES IN M W D
bnb usdt support and resistance lines
bnb usdt support and resistance lines
bnb usdt support and resistance lines

BTC/USDT ANALYSIS#BTC/USDT ANALYSIS
BTC is moving sideways in a range, in between the marked horizontal support and resistance zones. It broke out descending trendline resistance in the recent bullish move and currently retesting it, a successful retest will result into a bullish move, while further consolidation can be expected until we see a sustain breakout or breakdown.

BTC/USDT MOVEMENT UPDATE Btc is moving between it's resistance and Support. Last night we see a bounce after touching it's support. I am expecting a side ways movement until Monday.

BTC MARKET UPDATEThis Bais show that if BTC break out of the consolating area there will be an upward movement to $23k-$24k but if there is a break down, there will be a test of 18k support area before the uptrend movement

BITCOIN MAY FALL TO 10K IN Q4 2022This is a follow up to my previous idea
I posted an idea a few months ago about how BTC likely won't go any higher than 200 DMA, and so far it has been following my outlook very closely.
Bitcoin bearish outlook using 2018 data.
I have been closely observing 2018 bear crypto bear market and have been studying it since last year.
There are quite a lot of similarities between 2022 bear market and the 2018 bear market. If you look at the charts, some of these are quite obvious such as
- Blow off top in Q4 2017/2021
- A little rally in spring 2018/2022
- Couple red months in a row in Q2/Q3 2018/2022
- Dead cat bounce in summer, green monthly candle in 2018/2022
So now we will look at what the BTC price action may look like if it continues to follow 2018.
- The next couple months, like Q4 2018, would see the bottom of this bear market and have prices get to levels that could take many people by surprise.
- November/December 2018 saw the market bottom out and gave a great opportunity of a life time, this may be the case again.
- Also there are more factors here than just following 2018, such as:
- More interest rate hikes
- Negative GDP
- Quantitative tightening
- Inflation continuing to get worse with soaring prices
- Another possible covid variant
- More countries have economic collapses
- Gigantic stock market crash, perhaps as much as 50% as per Michael Burry's outlook
- Traders and retail choosing to cash out to pay their loans to avoid higher interests, or to afford basic needs with higher prices
- People losing their jobs and more getting laid, having to take out their investments to support their families
I have only charted upto Jan 2024, simply because it may be a bit harder to predict what happens after. In 2020 we got the covid crash, odds of another unpredictable global pandemic in 2024 are very slim.
Also, the fed has mentioned that they could possibly start printing again as early as 2024, which also happens to be very close to the Bitcoin halving.
And since we are making this based on past BTC trends, the halving always happens to slowly kick off the next bull market.
To sum up:
A) Bitcoin may fall as low as sub $10,000 in Q4
B) Mini bull market in first half of 2023, similar to 2019
C) Resume bear market in second half of 2023, similar to 2019
D) Getting to end the bear market in early 2024 and starting the next big bull market, similar to 2020
BINANCE:BTCUSDT BITSTAMP:BTCUSD BINANCE:BTCUSDTPERP COINBASE:BTCUSD BINANCE:BTCUSD BINANCEUS:BTCUSD INDEX:BTCUSD BNC:BLX NASDAQ:BLX BITMEX:XBT FTX:BTCUSD FTX:BTCUSDT BYBIT:BTCUSDC BYBIT:BTCUSD KUCOIN:BTCUSDT BITFINEX:BTCUSD

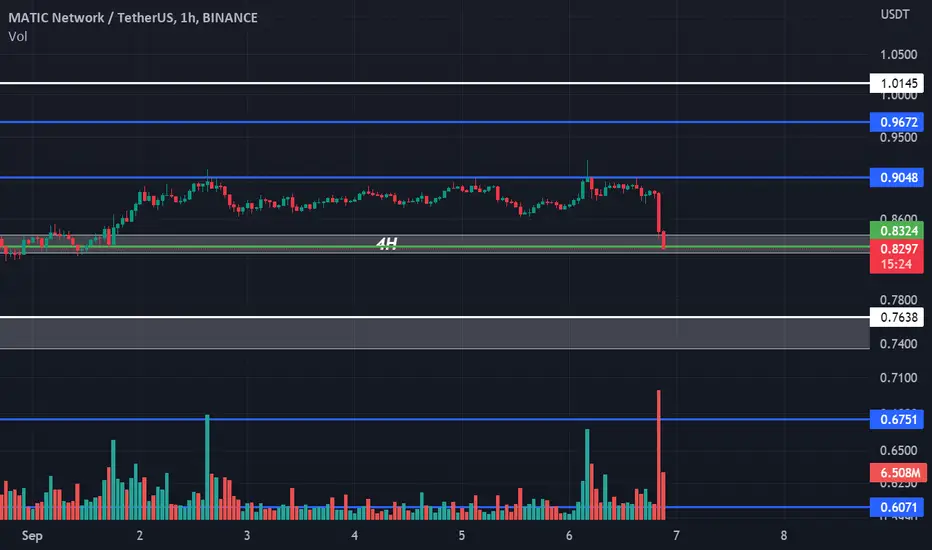
RLinda ! MATICUSDT -> support breakdown. What's next?MATICUSDT An interesting picture is forming on the chart, which reveals short potential. Leading cryptocurrencies are in the red zone at the moment, MATIC is breaking through its upward price channel and is not returning back to the channel.
The chart clearly shows that the price is trading under a resistance zone and is currently heading for a retest of that zone.
I assume that the pressure from above will not allow the price to rise. This consolidation is a set of energy for further movement, I think that at one of the borders there may be a shake-out, after which a strong movement will begin.
Regards R.Linda!

BNB Short Position BNB is making cup and handle and H&S position in 1D time frame. At the same time it is on lower trend line support. BNB will dump badly upon breakage of lower trend line and necklines of cup & handle and H&S pattern.

BLZ delisted from Binance. Contracts settle at 9:00 UTC, SHORTBLZ delisted from Binance. Short it before contracts settle at 9

Further pain for BTC coming soonHey Traders,
Here is my latest analysis on BTCUSDT.
The most likely scenario has been shown on the chart.
Other information and possible entry points are highlighted too.
Don't ignore this timely update.


Bull Trap BTC/USDT !???Is the price of BTC/USD going up? YES but, is it rising strongly? NO
Possibly the price is going to give another bearish trend in the short - medium term since historically the last months after the post-halving year are bearish and more September. Besides, it is presenting a correction pattern and the correction patterns do not present strength. We'll see what happens at the end of the year
It is also possibly going to see a recession in the remainder of the year and what falls the most are high-risk investments such as technology companies (Index: Nasdaq TVC:NDQ ) and also BTC INDEX:BTCUSD is a high-risk investment.
Below I leave you an idea that I shared of the S&P 500 SP:SPX
Here all the last months of the next year post-halving:
MA and EMA 200 1 day:

BTCUSDT | Planned correction, there is not much left.Hello everyone, I wrote a new idea for you. I think it's easy to like and subscribe to the channel, thanks😉
📌After numerous attempts to break through the strong level of $25,000, the asset bounced back to the $23,500 zone, thereby forming a downward channel at 3H
📌Yesterday's FOMC pump also surprised you by 300-500 points?😅 All events took place on the stock market, and bitcoin remained at the same values.
📌Now there is a struggle between sellers and buyers, pressure from the bears continues, if the trend line breaks out at $23.200, the next support zone will be $22.800
📌I also want to note the $23.800 zone, it was POCom (volume profile), this level was broken and now we can observe a downward movement into the zones that I noted above👆
📌 In a nutshell, wait for the rocket guys, soon we will fly at the expense of the SHORTS. They will pay for a ticket for $30,000

BTC Wyckoff AccumulationHey guys as you can see Btc is forming a Wyckoff Acculumation !!
IMO Buying from here now is totally safe ...
We can also notice that Btc formed the same structure in the end of 2018 so there is a big similarity in two charts and here is the link to 2018 Wyckoff event
That's what I see for BTC and remember always DYOR
