BTC might be preparing for a down moveAs we can see in this Daily Chart of BTCUSDT, we're seeing a rising wedge pattern narrowing down, many investors are looking at this pattern currently and has been decreasing their trading volume to watch if there is going to be a false move or a huge down move.
However, despite of it great pattern, we are still currently seeing that there's already a huge amount of liquidity pool within the 17-19k price area. We can say that we have a strong support. With also the recovering economy of the US, we are seeing some investors pushing their dollars to BTC and foreign assets.
In the coming FOMC we might see some drop in interest rates as well, this will be a good chance for BTC to do an impulsive move to the upside.
Btc-usdt

Btc late-2022 bear-market exit (ru)Main scenarios of exiting the bear market, including the accumulation-defense (bright orange) and trend-channels


BTC 1D TF, 69k Trend, The channelBTC 1D TF has been ranging this channel since June 18th
would we be squeezing in this range till month end August ?
Could you, wake me up when September Ends ?..
1st idea-BTC breaking out through the main Trend line channel up we go.
2nd idea- BTC Falling wick down till support, kill all bulls, grab liquidation, up and Away 🤔
Let me know what you think!
could the 🐻⛳️ be active ?
Do share your idea💡
ay what about FOMO trapped its over Guyz ?
Lets see how its prints out
Happy trading,
Wishing you a Green (Sept) Day


23.5 - 24.5 usd / btc on the horizon50 50 at the moment as far as i can see. Really depends on volume. Last day before the weekend. Are you 🧸🐂. Watch the possible diamond shape pattern.
Who you watching on the bullish case?

Bullish Levels To Watch
In a "BULLISH SENIARO" the WHITE lines are entry levels and RED lines being targets.


Another Short scalp btcoverbought, btc.d divergence. bearish bias. easy short imo. should be good for scalp at least

FRACTAL ANALYSIS. V SHAPE RECOVERY. 20% CHANCE. SEE DESCRIPTION.So, i have something to share with you. This is just my vision. JUST MY FANTASY. Let's speak about it now.
***WARNING*** YOU WILL BECOME A MOON BOY/GIRL, SO REMEMBER THAT IT IS ONLY 20% CHANCE.
I used fractal analysis (took a fractal from covid dump and V shape recovery that happened in 2020), to predict what can possibly happen. During Covid dump It was absolutely the same - unpredicted conditions on the markets and bad macro economic factors in general. During 2022 dip in Crypto people has been expecting the CRASH OF FINANCIAL SYSTEM, but in general we received 9.5% CPI rates and this is it. Same was with Covid dump. People has been expecting apocalypses, but economy recovered in 6 months and a lot of people who bought crypto during these dip became a millionaires just in one year (imagine ETH for $80).
According to this theory, i think, that even stock2flow model can be still correct. Just timeframes have been changed.
So lets speak about the cycle. I think, if we will see this option playing out, than overall bullish trend of 2021 was just a pre-bullrun. Real bullrun in this case should happen in 2023 when BTC will hit $300K+ price target. THE FOMO WILL BE ABSOLUTELY UNBEARABLE. And this will be the end of this cycle and we will see another bear market (apx. since september 2023 till september 2024) with an absolute bottom for 1BTC at $70k-80k.
And just enjoy how this fractal perfectly matches everything. So according to this model - we will see $60K+ for 1 BTC at the end of this year. And $300K+ for 1 BTC in the next 12 months. Crazy? yes. Possible? Yes. Will it happen? I would say yes with a 20% chance 😁


BTCUSDT ! Head And Shoulders pattern formation. What's next?🤖BTCUSDT is trading in an upward price channel. I believe that this channel is a local correction in a global down market.
On the chart, we can see that the price updates the local tops of the 24200 level and forms a false break after capturing the liquidity. The price returns to the range, under the 23360 level, thus forming a Head and Shoulders pattern.
I assume that after the price fixes under 23360 level, the crypto coin may start to work out this pattern and we may see a downward movement. Short-term target is the border of the channel and support level 21650, if we manage to break this channel down, the key target will be support 20185.
Regards R. Linda!

Bearish Flag I THINK ITS TIME FOR SHORTHey guys this is my idea about bitcoin
what do you think please leave a comment if you are agree with me if not tell me why
thank you
this isn't financial advice we are just trying to help people on their own vision.

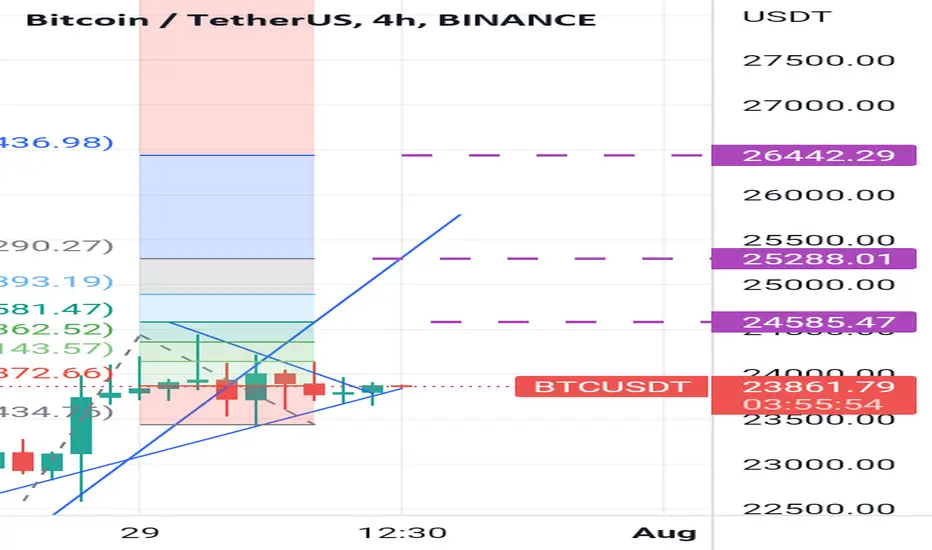
BTCUSDT on a further bullish price action? 🦐BTCUSDT on the 4h chart after the break of the daily channel perfectly retested the support area.
The market is now moving at the 23k above the structure.
How can i approach this scenario?
I will wait for a break of the minor resistance and in that case i will set a nice long order according to the Plancton's strategy.
–––––
Keep in mind.
🟣 Purple structure -> Monthly structure.
🔴 Red structure -> Weekly structure.
🔵 Blue structure -> Daily structure.
🟡 Yellow structure -> 4h structure.
–––––
Follow the Shrimp 🦐

BTC dwindling prices!!Despite some Bitcoin trickery, the overall view for the immediate future is still negative but will be keeping Stops as tight as possible.
Whatever happens, buying these cryptocurrency assets at the time just doesn't feel right, especially when there are no obvious or convincing technical indicators for long positions.
Until additional price movement is observed, it is hard to rule For or Against this asset hitting the $15k level.
Perform your DD! Nothing is etched into stone, the markets is king Always!
Cheers to trading!

CTK Perfect Play! Both TP's HitBoth TP's hit...We wait a little bit but the plan and execution was good...

Bitcoin daily analysis thank you.In this update we review the recent price action in the bitcoin and identify the next high probability trading opportunity and price objectives to target

Bitcoin Short-Term Buy to 23kAfter the recent drop from 24200 to the major support level at 20700, bears have failed to break it down and respectively BTC has bounced back up from 20700. It looks like bulls will try to take 24k again. Stop Loss should be below 20700 and TP before the resistance at 24200.

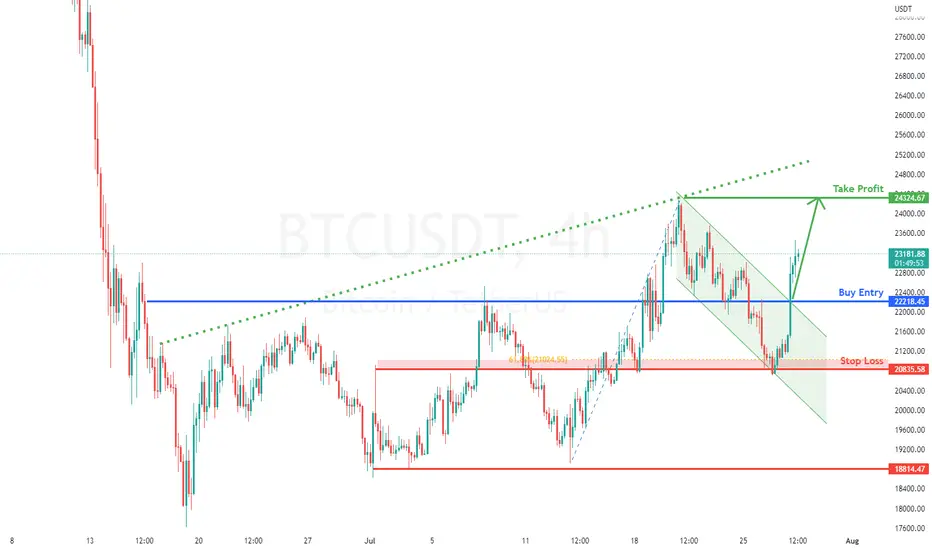
BTCUSDT Potential for Bullish Continuation | 28th July 2022now
On the H4, with the price breaking out of the descending channel and moving along the long term ascending trendline, we have a bullish bias that price would rise from buy entry at 22218.45 where the overlap support is to the take profit at 24324,67, which is in line with the swing high. Alternatively, price could drop to stop loss at 20835.58 where the overlap support and 61.8% fibonacci retracement are. Take note if the price keeps going down, it may drop to the support at 18814.47, where the significant swing highs are.
Any opinions, news, research, analyses, prices, other information, or links to third-party sites contained on this website are provided on an "as-is" basis, as general market commentary, and do not constitute investment advice. The market commentary has not been prepared in accordance with legal requirements designed to promote the independence of investment research, and it is therefore not subject to any prohibition on dealing ahead of dissemination. Although this commentary is not produced by an independent source, FXCM takes all sufficient steps to eliminate or prevent any conflicts of interest arising out of the production and dissemination of this communication. The employees of FXCM commit to acting in the clients' best interests and represent their views without misleading, deceiving, or otherwise impairing the clients' ability to make informed investment decisions. For more information about the FXCM's internal organizational and administrative arrangements for the prevention of conflicts, please refer to the Firms' Managing Conflicts Policy. Please ensure that you read and understand our Full Disclaimer and Liability provision concerning the foregoing Information, which can be accessed on the website.
BTC/USDT Daily chart/Дневной таймфреймИтак, если удержим 20650 по бате, то думаю что в середине августа можно будет увидеть 27700-28200.
So, if BTC will hold 20650 than we may see a nice small rally to 27700-28200 range in mid august IMHO.

Bitcoin (BTC) - July 26Hello?
Welcome, traders.
If you "follow", you can always get new information quickly.
Please also click "Like".
Have a good day.
-------------------------------------
(BTCUSDTPERP 1W Chart)
RSI Indicator: Oversold Zone
Stoch RSI Indicator: Overbought Zone
Therefore, it is expected to show mixed results.
It is necessary to determine where support and resistance are received.
(1D chart)
Primary Resistance: Rising Channel (23722.8-25373.3)
Secondary resistance: 27054.1-29840.6
1st support: 21481.1-22471.5
Second support: 19930.6-20564.2
The key is whether it can be supported in the 21481.1-22471.5 section and rise to the first resistance section.
The next volatility period is around July 31st.
(1h chart)
** On the 1h chart, a sharp move is likely to occur, so a short-term response is recommended.
You need to see support at the 21481.1-22471.5 section and see if it is moving along the uptrend line.
It can temporarily touch the 20564.2-21481.1 section and rise, so be prepared for this.
At this time, if it fails to move above 22471.5, it is likely to lead to further declines.
------------------------------------------------------------ -------------------------------------------
** All indicators are lagging indicators.
Therefore, it is important to be aware that the indicator moves accordingly as price and volume move.
However, for the sake of convenience, we are talking in reverse for the interpretation of the indicator.
** The MRHAB-T indicator used in the chart is an indicator of our channel that has not been released yet.
** The OBV indicator was re-created by applying a formula to the DepthHouse Trading indicator, an indicator disclosed by oh92. (Thanks for this.)
** Support or resistance is based on the closing price of the 1D chart.
** All descriptions are for reference only and do not guarantee a profit or loss in investment.
(Short-term Stop Loss can be said to be a point where profit and loss can be preserved or additional entry through split trading. It is a short-term investment perspective.)
---------------------------------

Bitcoin (BTC) - July 25Hello?
Welcome, traders.
By "following", you can always get new information quickly.
Please also click "Like".
Have a good day.
-------------------------------------
(BTCUSDT 1W Chart)
Resistance: 27033.35-29812.52
1st support: 21475.02
2nd support: 13137.51-15916.68
In order to turn into an uptrend and continue a full-fledged uptrend, it needs to rise above 29812.52 for support.
- If the price is maintained above the HA-Low indicator line (21838.98), it is expected to lead to further gains.
- The Stoch RSI indicator is rising and is expected to enter the overbought zone soon.
When the RSI moves out of the oversold zone and the Stoch RSI enters the overbought zone, a short-term high is likely.
It is not known to what point this short-term high will rise.
Expect to touch the 23733.48-25389.99 segment (up to 27033.35-29812.52).
(1D chart)
Primary Resistance: 23733.48-25389.99
Secondary resistance: 27033.35-29812.52
If the resistance section is divided in detail, it can be divided into a section 23733.48-25389.99 and a section 27033.35-29812.52.
These sections refer to the section where the diagonal Fibonacci line and the horizontal Fibonacci line pass.
Therefore, the entire section 23733.48-29812.52 becomes the resistance section.
The support zone is the same as mentioned in the description of the 1W chart.
- Support above the HA-High indicator line (22753.10) is expected to lead to further gains.
Therefore, the key is to maintain the price above the 22487.41-22753.10 interval.
- If the Stoch RSI indicator enters the oversold zone, you should check where support and resistance are found.
- In the CCI-C indicator, the CCI line is maintaining above the EMA line and the -100 point.
So, finding support near 22487.41 could lead to further upside.
The interval 27033.35-29812.52 is the interval that determines the trend.
Therefore, if it falls without being supported in the section 27033.35-29812.52, Stop Loss is required to preserve profit and loss.
Therefore, if it falls in the section 27033.35-29812.52 and receives resistance at 26574.53, Stop Loss is required.
The volatility between July 24-26 requires checking to see if there is any movement out of the 21475.02-23733.48 section.
------------------------------------------
(USDT + USDC 1D Chart)
If the flow of money doesn't show a clear uptrend, the coin market won't be able to turn upside down.
USDT needs to move higher than 68.468B for a clear uptrend.
(1W chart)
------------------------------------------------------------
- For this uptrend to lead to an uptrend, more funds must first flow into the coin market.
- An uptrend that emerges from an otherwise unfavorable situation is nothing more than a rebound that can come from a downtrend.
- In such market conditions, trading should respond to volatility with short-term trading.
------------------------------------------------------------ -------------------------------------------
** All indicators are lagging indicators.
Therefore, it is important to be aware that the indicator moves accordingly with the movement of price and volume.
However, for the sake of convenience, we are talking in reverse for the interpretation of the indicator.
** The MRHAB-T indicator used in the chart is an indicator of our channel that has not been released yet.
** The OBV indicator was re-created by applying a formula to the DepthHouse Trading indicator, an indicator disclosed by oh92. (Thanks for this.)
** Support or resistance is based on the closing price of the 1D chart.
** All descriptions are for reference only and do not guarantee a profit or loss in investment.
(Short-term Stop Loss can be said to be a point where profit and loss can be preserved or additional entry can be made through split trading. It is a short-term investment perspective.)
---------------------------------
