HelenP. I Bitcoin may correct to support level and rebound upHi folks today I'm prepared for you Bitcoin analytics. Analyzing the chart, we can observe that the price initially climbed to the trend line before reversing and dropping to the resistance level, which aligned with the resistance zone. After spending some time trading near this level, the price made a corrective move downward, briefly breaking the level before bouncing back up. Following this, BTC once again tested the trend line before falling to the support level, breaking through the resistance level in the process. The price dipped slightly below this area but then made a sharp upward move toward the 101500 resistance level before starting to decline. Bitcoin then dropped to the support level, immediately rebounded, and attempted to rise, but eventually fell back to the 94200 level. After this, the price started to recover, rising close to the trend line before turning downward again. At this point, I anticipate that BTCUSDT will move down to the support level before beginning a new upward push toward the trend line. Therefore, I have set my goal at 98800, which aligns with this trend line. If you like my analytics you may support me with your like/comment ❤️
Btc-usdt

Bitcoin can leave triangle and reach 100K pointsHello traders, I want share with you my opinion about Bitcoin. Analyzing this chart, we can see that a few days ago, the price dropped below the resistance level, which aligned with the seller zone, breaking through it. After that, BTC began to rise near the support line and soon broke through the 102500 level again, climbing even higher than the seller zone. Following this move, BTC reversed and started declining within a descending triangle, eventually breaking the 102500 level once more and dropping into the buyer zone. Afterward, the price made a strong upward impulse toward the resistance level but soon began to pull back. Not long after, the price fell to the support level, bounced from the 94,000 mark, and climbed back to the resistance line of the triangle. Shortly after, BTC once again dropped to the support line before starting to rise again. Currently, it is trading very close to the resistance line of the triangle. In my view, BTCUSDT is likely to reach 100K points, leading to a breakout from the triangle. Please share this idea with your friends and click Boost 🚀

BITCOIN - Price can grow almost to resistance level and dropHi guys, this is my overview for BTCUSDT, feel free to check it and write your feedback in comments👊
Recently price rose near support line and broke $101100 level, after which made a correction and then rose to $106300 points.
Next, price dropped to $92000 points, breaking support line with $101100 and $95600 levels, and then started to grow.
Price rose to $101100 level, and then started to decline inside a falling channel, where it fell to support area.
After this, it tried to grow, but later turned around and declined back to support area and even a little below.
Then it turned around and made an upward impulse, breaking $95600 level and exiting from channel.
Now, I think that BTC can rise to almost resistance level and then fall to $95600 support level.
If this post is useful to you, you can support me with like/boost and advice in comments❤️

Bitcoin can exit from triangle and then rise to 101K pointsHello traders, I want share with you my opinion about Bitcoin. Not long ago, the price reached a support level aligned with the buyer zone. It consolidated there for a while before climbing into a pennant formation. Inside the pennant, the price broke through the 95200 level and continued its rise toward the resistance level, which overlapped with the seller zone, eventually breaking through this area as well. Following that, the price advanced to the resistance line of the pennant but soon reversed direction, sharply dropping to the support line. It broke through this support, signaling an exit from the pennant pattern and surpassing the 104700 resistance level. After a minor decline, the price rebounded quickly, reaching the seller zone once more, before turning lower and forming a triangle pattern. Bitcoin slid down to the triangle's support line, then reversed and bounced upward, breaking the support level again in the process. This led to further declines, with the price eventually hitting the buyer zone. From there, it rebounded back toward the triangle’s resistance line. Currently, the price is trading close to this resistance line. In my view, Bitcoin can drop back to the support line before rebounding higher, potentially climbing to 101K points and breaking out of the triangle formation. Please share this idea with your friends and click Boost 🚀

HelenP. I Bitcoin can grow to trend line, exiting from rangeHi folks today I'm prepared for you Bitcoin analytics. Recently, the price reached a support level that coincided with the support zone, followed by a correction. After this, BTC made a strong upward move to the resistance level, which also aligned with the resistance zone, breaking the support level and eventually surpassing the 102000 mark. The price then corrected back to this level, before rising to the trend line and hitting a new all-time high of 109300 points, after which it began to decline. For a while, the price traded near the 102000 level and even broke it briefly, falling below, but soon reversed and rose back to the trend line. Afterward, the price dropped to the support zone, breaking through the resistance level, and then quickly rebounded, triggering a false breakout of the 95300 level. Since then, the price has been trading within a consolidation range, and it continues to do so up to this day. I expect that BTCUSDT will decline to the support level before starting to rise again toward the trend line, slightly breaking out of the range. Therefore, my goal is set at 100800 points, which aligns with this trend line. If you like my analytics you may support me with your like/comment ❤️

BITCOIN - Price can correct again and then start grow to $101KHi guys, this is my overview for BTCUSDT, feel free to check it and write your feedback in comments👊
Some days ago, prices bounced from $93600 level, rose to $102500, and then started to decline in a triangle.
In this pattern, price turned around and made an upward impulse from support line to $102500 level and broke it.
Next, BTC exited from triangle and started to decline inside pennant, where it soon broke $102500 level one more time.
After this, price dropped to support area and even a little below, reaching support line pennant and then bouncing up.
Bitcoin rose to $102500 level, after which in a short time, it declined to support line of pennant and now it rising.
In my mind, BTC can correct to support line again and then start to grow to $101K.
If this post is useful to you, you can support me with like/boost and advice in comments❤️

Bitcoin will continue to grow and exit from triangle patternHello traders, I want share with you my opinion about Bitcoin. By observing the chart, we can see that the price entered a downward triangle, where it at once rebounded from the resistance line and started to decline. In a short time, the price fell to the resistance level, which coincided with the seller zone, broke this level, and dropped until to support line of the triangle, breaking the support level too. Next, BTC turned around and made a strong impulse up, breaking 95000 and 100000 levels, after which it turned around and started to decline. Price later fell below the 100K level, breaking it, and continued to fall next. Later BTC rose to the 100K resistance level, but at once turned around and dropped to the support level, which coincided with the buyer zone. After this, the price rebounded from the buyer zone and reached the resistance line of the triangle, and then corrected back. Then Bitcoin started to grow, so, I think that the price can correct to the support line and then rise to the resistance line and break it, thereby exiting from the triangle pattern. Then BTC will continue to grow, therefore I set my TP at 99K points. Please share this idea with your friends and click Boost 🚀

HelenP. I Bitcoin may drop below support level, breaking itHi folks today I'm prepared for you Bitcoin analytics. A few days ago, the price bounced off the trend line and dropped to the resistance level, which aligned with the resistance zone, and eventually broke through it. After that, the price continued its decline and even fell below the support level before quickly reversing. Following this reversal, the price made a sharp move up to the resistance zone but soon started falling again, breaking the 100500 resistance level in the process. Some time later, BTC dropped to the support level, which coincided with the support zone, and attempted to rise. However, it failed and corrected back to the 94800 support level. The price traded near this level for a while before rebounding to the trend line. Recently, it turned around again and resumed its downward movement. Currently, I anticipate that BTCUSDT will rise toward the trend line before eventually breaking below the support level. For this scenario, I’ve set my goal at 93200, which is below the support zone. If you like my analytics you may support me with your like/comment ❤️

Bitcoin may drop to support line before reboundingHello traders, I want share with you my opinion about Bitcoin. We can observe how the price entered a range when analyzing the chart. It initially dropped to the support level, aligning with the buyer zone at the lower boundary of the range. After spending some time trading near this level, the price dipped further into the buyer zone but quickly rebounded, rising to the upper boundary of the range. Following this, the price reversed and fell back into the buyer zone, where it consolidated for a while before climbing back into the range. Shortly afterward, Bitcoin rallied to the resistance level, corresponding to the seller zone, breaking out of the range and eventually surpassing the 104600 level to reach a new all-time high (109000 points). However, BTC then began to decline within a downward channel, where it broke below the 104600 level again and dropped to the channel’s support line. Although the price attempted to recover, it failed and rebounded from the seller zone back to the buyer zone. Subsequently, the price moved back into the channel, creating a false breakout, and continued its downward movement within the channel. Given the current structure, I anticipate that BTC might drop to the channel's support line before initiating a new upward movement. Based on this outlook, I’ve set my target price (TP) at 101300 points. Please share this idea with your friends and click Boost 🚀

HelenP. I Bitcoin will exit from triangle and reach $101K pointsHi folks today I'm prepared for you Bitcoin analytics. Looking at this chart, we can see that the price reached a resistance level aligned with the resistance zone and broke through it. Afterward, BTC continued its upward movement but eventually corrected, dropping below the 102600 level. However, it quickly reversed direction and made a strong upward impulse, breaking through the 102600 level once again. The price hovered around the 102600 level for some time before breaking below it and continuing to fall. Following this move, BTC reversed direction and, in a short period, rallied to the trend line, breaking the 102600 level yet again. After that, the price began to decline within a triangle pattern and soon dropped through the 102600 level, reaching the support zone, which coincided with a key support level. From there, BTC made a sharp upward move to the resistance level but immediately corrected again. Bitcoin fell to the support level and then rebounded upward. At the moment, it’s trading near the trend line. I expect that BTCUSDT will make a minor correction before rebounding to 101K, breaking through the trend line, and exiting the triangle formation. If you like my analytics you may support me with your like/comment ❤️

HelenP. I Bitcoin can start grow to trned line, after correctionHi folks today I'm prepared for you Bitcoin analytics. In this chart, we can see how the price declined below a support level, which coincided with the support zone, and quickly backed up and continued to move up next. Later BTC rose to a resistance level, which coincided with the resistance zone, some time traded near, and then made a correction movement, after which made an impulse up to the trend line. Then the price turned around and started to decline near the resistance level. Sometimes BTC rose back to the trend line, but didn't fixed and continued to decrease next. A few time later price rebounded from the resistance zone and dropped below, breaking the resistance level last time. After this movement, BTC rose to the trend line, little time traded between this line, and then dropped to the support level. Then Bitcoin rebounded from this level and rose to 102500 points, after which started to decline. So, in my opinion, BTCUSDT will fall one more time and then start to grow to the trend line. That's why I set my goal at 102K points, which coincides with this line. If you like my analytics you may support me with your like/comment ❤️

Bitcoin can continue to fall in downward channel to 92K pointsHello traders, I want share with you my opinion about Bitcoin. Looking at the chart, we can see how the price declined from the support level a little below and then started to grow inside the upward pennant, where it at once broke the support level again and continued to move up. Later BTC reached a resistance level, which coincided with the seller zone, and even rose, breaking this level to 108700 points and then turning around. Price fell below the resistance level, but soon backed up and some time traded between this level until it reached the resistance line of the pennant and then started to decline. In a short time, the price fell below the resistance level, breaking it, and soon exited from the pennant also, after which continued to move down inside the downward channel. In the channel BTC rebounded from the support line and rose to the seller zone, where it some time traded and then continued to decline, breaking the 104500 resistance level again. Bitcoin fell into the buyer zone, where it turned around and made a strong impulse up to the resistance line of the channel. And recently price bounced from this line and continued to move down. So, I think that Bitcoin can move up and then fall lower than the support level, breaking it. For this case, I set my TP at 92K points. Please share this idea with your friends and click Boost 🚀

Bitcoin can exit from triangle and continue to fall nextHello traders, I want share with you my opinion about Bitcoin. By observing the chart, we can see that the price started to grow inside the upward channel, where it at once rebounded from the resistance line of the channel and fell to the support line. Then BTC broke the support level and rose in a short time to the resistance line of the channel and then it started to decline. Bitcoin fell to the support level, which coincided with the buyer zone, thereby exiting from the channel and after it some time traded between 94250 level, it fell to 90850 points. Next, the price impulsed and continued to grow inside the upward triangle, breaking the support level again. Later it reached the even resistance level, which coincided with the seller zone. Soon, BTC broke the 104700 level, rose to the resistance line, and then fell back and continued to trades between the 104700 level. Later BTC broke this level and fell below, after which turned around and quickly rose to the resistance line of the triangle and then dropped to the support line, where at the moment continues to trades close. So, in my mind, I think that Bitcoin can move up and then exit from the triangle and continue to decline to the 94250 support level. For this case, I set my TP at this level. Please share this idea with your friends and click Boost 🚀

HelenP. I Bitcoin will repeat move up and then continue to fallHi folks today I'm prepared for you Bitcoin analytics. This chart shows how the price rose from the resistance level, which coincided with the resistance zone, after which it dropped to the support level, breaking the 103600 level. Also then the price started to trades inside consolidation, where it some time traded near the support level and then rose to almost the resistance level. Then BTC turned around and fell back and even declined to support zone. After this movement, Bitcoin made a strong impulse up to the resistance zone, thereby exiting from consolidation and breaking the 103600 level. Next, the price reached the trend line and then started to decline near this line. Soon, the price broke this line and then broke the resistance level, after which declined below the trend line, but later backed up. After this move, BTC turned around and rebounded from the resistance zone to the support zone, finally breaking the resistance level with the trend line, but a not long time ago BTC rose higher than the trend line. Now it trades close and I expect that BTCUSDT will repeat move up and then continue to decline, and even break the support level and fall to the trend line. That's why I set my goal at 90400 points. If you like my analytics you may support me with your like/comment ❤️

BITCOIN - Price can touch resistance level again and then fallHi guys, this is my overview for BTCUSDT, feel free to check it and write your feedback in comments👊
A few days ago, price declined inside falling channel to $92100 level, after which it turned around and started to grow.
In a short time, price exited from channel and broke $99500 level, but when it started to trades in a wedge, it dropped back.
Price some time traded near $92100 level and then in a short time rose to $106500 level, breaking $99500 level again.
Then BTC exited from wedge and started to trades inside flat, but firstly it rose to $109K points and then fell back.
Inside flat, price corrected to $99500 level and then in a short time rose to $106500, after which started to fall.
I think BCT can touch resistance level one more time and then fall to $99500 level.
If this post is useful to you, you can support me with like/boost and advice in comments❤️

HelenP. I Bitcoin will grow to resistance level and then dropHi folks today I'm prepared for you Bitcoin analytics. If we look at the chart we can see how the price broke the support level and tried to grow more, but failed and in a short time declined to 91900 points firstly and then it fell to the trend line. After this, BTC turned around and started to grow inside a triangle pattern, where it soon reached the 98800 level, broke it, and continued to move up, after retesting. Later BTC rose to a resistance level, which coincided with the resistance zone, and even rose higher and reached a new ATH, but then it turned around and dropped below the resistance level, breaking it one more time. Then the price tried to return, but failed and some time traded near the 106400 level and then dropped to the support zone, where it reached the trend line, which is the support line of the triangle as well. After this, it rebounded up to the triangle pattern's resistance line, which continues to trade to this day. So, I expect that BTCUSDT will make a move up to the resistance level and then start to decline to the trend line, therefore I set my goal at 101K points, which coincided with this line. If you like my analytics you may support me with your like/comment ❤️

HelenP. I Bitcoin can drop from resistance level to $98K pointsHi folks today I'm prepared for you Bitcoin analytics. Some time ago, the price declined to the support level, which coincided with the support zone, and started to trades close. A few moments later, BTC rebounded to 100K points, after which made a correction back to the 93500 support level and even fell to the support zone. After this, the price turned around and started to grow to a resistance level. When BTC reached this level, it rebounded, dropped back to the support zone, and even lowered to 91K points. Then the price tried to grow, but failed and declined to the trend line. But soon, the price turned around and made a strong impulse up to the resistance level, which coincided with the resistance zone, broke this level, and continued to move up. Bitcoin reached a new ATH and then made a correction back to the resistance area, where it some time traded and a not long time ago reached the trend line, broke it, and dropped below the 102700 level, breaking it too. So, in my mind, BTCUSDT will reach a resistance level and then rebound down. For this case, I set my goal at 98K points. If you like my analytics you may support me with your like/comment ❤️

Bitcoin will break support level and continue to declineHello traders, I want share with you my opinion about Bitcoin. By observing the chart, we can see that the price a few moments ago rebounded from the support line, which coincided with the support level with the buyer zone and rose to the resistance line. After this, BTC rebounded from this line and dropped back to the support line, breaking the 93400 level, and soon rebounded up, breaking this level one more time. Later BTC rose to the resistance line and then fell to 90850 points, after which made a strong impulse up, breaking the 93400 level with the resistance line too. Then price continued to move up inside Pennant, where it broke the 102700 current support level, made a retest, and then tried to grow more, but failed and made correction below the 102700 level. After this movement, BTC turned back and rose to 109600 points (new ATH) and then made a correction movement one more time. Price fell to the support line of the pennant and then in a short time rose to the resistance line and recently it fell and exited from the pennant. In my opinion, the price can fall to the current support level, break it, and then continue to decline, therefore I set my TP at 99K points. Please share this idea with your friends and click Boost 🚀

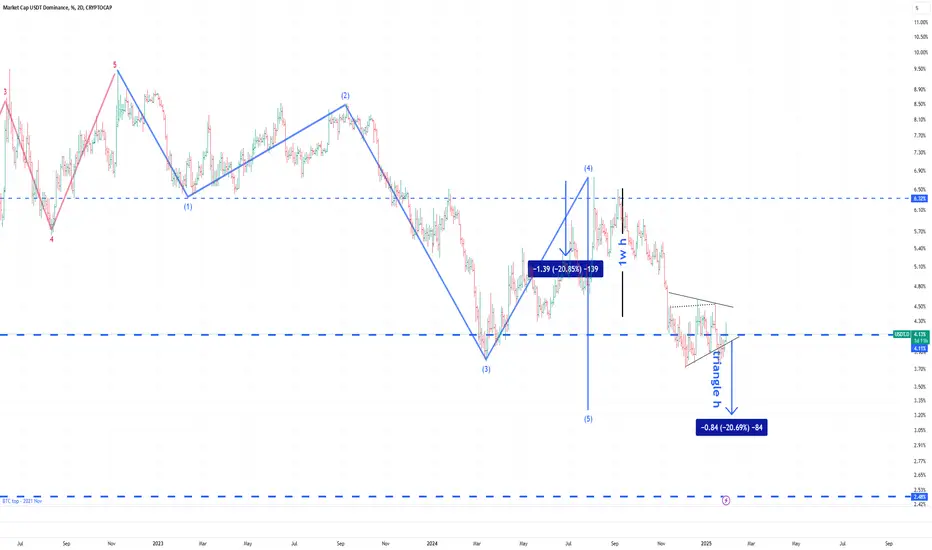
Key to upcoming price action pathHere are 2024 September - November USDt rally metrics:
66 days, 4.6 Trillions volume.
The first sub wave of micro degree is 1.39 points or 20.85% length.
The third sub wave of micro degree is 2.32 points or 35.7%. Which led to +89% at BTC, from 52k to 99k.
The triangle in fourth position has 0.75 points - 16.77% min basement or 0.97 - 20.69% max height. Triangles usually precede the last wave in the direction of the main trend. The terminal point for this triangle may reach 3.15% dominance and last in approximately the next 80 days.
The dominance of USDt on RSI 2D TF signals a downward divergence.
I think the signal line could reach ~22% before meeting the support trend line and reversing. It is -18% from the current point.
These values coincide with trend lines on Bitcoin, about 155k, or +55% from the current point.
Dodgecoin in percentage terms does move about 2x further.
This is a third confirmation proving upcoming rise in all crypto assets.
keep in mind that there is always place for an alternative waves count, but i bet that the analysis results worth millions!
So, wish you safe trading, fat profits and see you again :)
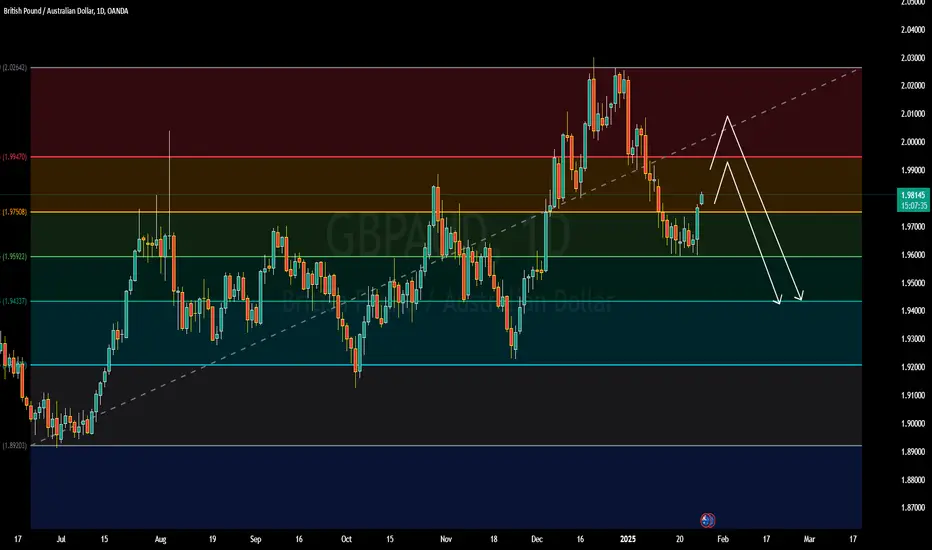
GBPAUD Retesting Resistance with a Potential for Price ReversalGBPAUD is currently trading at 1.981, with a target price set at 2.000, indicating a potential gain of over 200 pips. The market analysis is based on the support and resistance pattern, which suggests key price levels where the pair may react. Currently, the pair is in a retesting phase, meaning it is testing the resistance level after a previous breakout or price movement. This retesting phase helps confirm whether the resistance holds or breaks. If the resistance holds, it signals a potential reversal, leading to a price drop. Traders are advised to closely monitor this retesting period for confirmation before taking positions. A rejection at the resistance level could trigger a bearish move. Patience during this period is critical to avoid premature entries. This setup reflects a potential opportunity for experienced traders following technical analysis strategies.
BITCOIN - Price can continue to move up inside wedge patternHi guys, this is my overview for BTCUSDT, feel free to check it and write your feedback in comments👊
A few moments ago, the price declined to support level, after which at once bounced up to resistance area.
Then BTC started to decline inside pennant, where it quickly declined from resistance area to support area.
After this, price bounced from the pennant's support line, broke the $94200 level, and exited from the pennant pattern.
Next, price rose to $102700 points and made a correction move to $90800 points, after which started to grow in wedge.
In wedge, BTC rose to $106500 level and even rose higher, reaching a new ATH and then fell back.
Now I expect that Bitcoin can correct to support line of wedge and then rise to $112K, breaking resistance level.
If this post is useful to you, you can support me with like/boost and advice in comments❤️

BTC - Steady... steady... almost there!BTC in the short term is looking very much like a WXYXZ is forming. We should therefore see a low, which could temporarily breach the lower trend line. In fact, it'd make for a bullish signal if it did - so watch this carefully. If we see it ping back within the channel, then the formation will likely complete. Next thing we'll need to look for us the breakthrough of the upper trend line. This would then lead to higher higher and the completion of wave 5 of 1 which we have long been looking for. I'm not going to take any actions here until either trend line is decisively broken leading to a trend change. Looks good though, follow for more.

HelenP. I Bitcoin can correct to support level and start to growHi folks today I'm prepared for you Bitcoin analytics. In this chart, the price declined to the trend line and then rebounded and started to grow inside the pennant, where it soon reached the support level. After this movement, the price broke this level, which coincided with the support zone and made a retest, after which continued to move up to the resistance level, which coincided with the resistance zone. Then BTC made the small correction, after which in a short time, it rose to the resistance zone and then made a correction movement to the 99500 support level. Next, the price made a strong impulse up to 109560 points (NEW ATH), breaking the resistance level, but soon turned around and dropped back to the trend line. Price some time traded near the trend line and then rose to the resistance zone, after which turned around and started to decline. In a short time, BTC fell to the trend line, broke it, thereby exiting from the pennant pattern also, and then continued to fall. At the moment, the price continues to decline and I expect that BTCUSDT will decline to the support level and then start to grow to the resistance level. For this level, I set my goal at 105800 level. If you like my analytics you may support me with your like/comment ❤️
