HelenP. I Bitcoin will break trend line and fall to support zoneHi folks today I'm prepared for you Bitcoin analytics. If we look at the cart we can see how the price fell firstly to support 2, which coincided with the support zone, and then at once rebounded up. After BTC rose a little, it turned around and fell to the trend line, and then started to grow, making a fake breakout of support 2. Later, BTC in a short time rose to support 1, which coincided with the support zone and even entered to this area, but soon turned around and dropped to the trend line. Soon, the price broke this line and then started to grow below the trend line, until it reached support 1, after which BTC rebounded down again. After the price made a correction, it turned around and quickly rose to support 1, broke this level, and continued to grow to the trend line. When the price reached this line, it broke it and then rose a little higher, but recently turned around and fell to this line. Now, the price is growing near the trend line and I expect that BTCUSDT will rise a little and then drop to the support area, breaking the trend line. That's why I set my goal at 69300 points. If you like my analytics you may support me with your like/comment ❤️
Btc-usdt

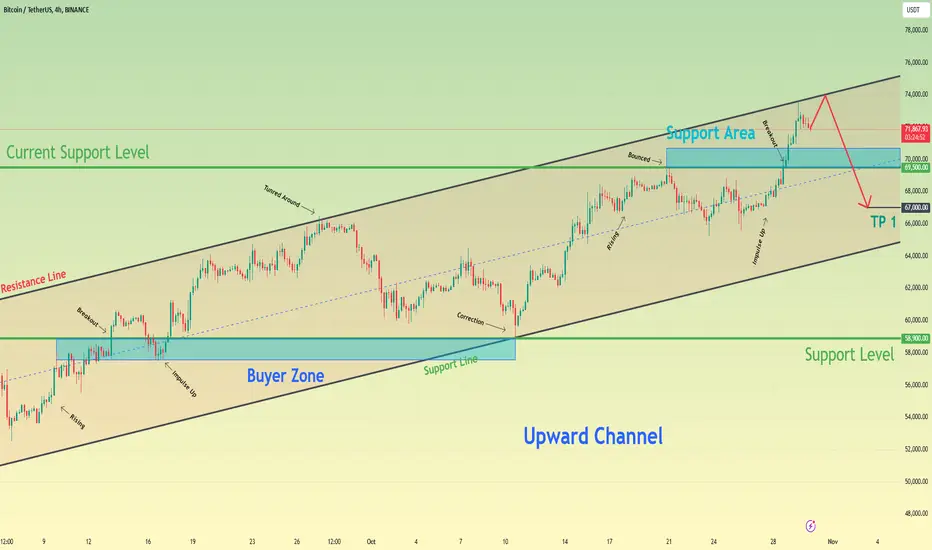
Bitcoin can reach resistance line of channel and start to fallHello traders, I want share with you my opinion about Bitcoin. Observing the chart, we can see how the price some days ago entered an upward channel, where at once it made little correction and then rose to a support level, which coincided with the buyer zone. Then BTC broke this level, after which made a correction to the buyer zone, and then BTC made an impulse up to the resistance line of the upward channel. After this movement, the price turned around from this line and then started to decline to the 58900 support level, which coincided with the support line of the channel. Later BTC rebounded and continued to move up inside the upward channel and some time later reached the current support level, which coincided with the support area. Price rebounded from this level and made a correction below, after which made an upward impulse to the resistance line of the channel, thereby breaking the 69500 level. But a not long time ago it started to decline, therefore I think that BTC can grow to the resistance line and then drop below a current support level, breaking it and continuing to decline. For this case, I set my TP at 67000 points. Please share this idea with your friends and click Boost 🚀
BITCOIN - Price can bounce from support area to $73800 pointsHi guys, this is my overview for BTCUSDT, feel free to check it and write your feedback in comments👊
Some days ago price rose inside rising channel, where it broke $61100 level and then reached resistance line of channel.
Then price continued to grow near this line, after it reached $66350 points, price turned around and started to decline.
In a short time, BTC exited from channel, fell to support area, and started trades inside wedge.
In wedge, price fell to support line, after which made upward impulse to $69000 level, made correction, and continued to grow.
Soon, price broke $69000 level and reached resistance line of wedge, but recently fell to one more support area.
Possibly, BTC can bounce up from support area to $73800 resistance line of wedge.
If this post is useful to you, you can support me with like/boost and advice in comments❤️

Bitcoin can rebound up from triangle to 68400 resistance levelHello traders, I want share with you my opinion about Bitcoin. Looking at the chart, we can see how the price some time traded near the support level, which coincided with the buyer zone and then broke it, after which it rose to 68K points. After this movement, the price made a downward impulse to support line and then grew. In a short time later it rose to a resistance level, but then corrected almost a support line, after which turned around and continued to grow. Later BTC reached the 68400 level, broke it and even rose higher than the seller zone, but soon fell below. Price some time traded near this level and then rose higher than the seller zone again, after which turned around and started to decline inside the triangle. In this pattern, BTC broke the support level with the resistance level and fell until to the buyer zone and even lower, to the support line of the triangle. After this, the price made impulse up to the 68400 level and then rebounded down to the support line. A not long time ago, BTC bounced from this line and started to grow. So, in my opinion, the price can make a move down, below the support line of the triangle, and then rebound up to the 68400 resistance level, which coincides with my TP. Please share this idea with your friends and click Boost 🚀

BITCOIN - Price can bounce up to $72500, exiting from wedgeHi guys, this is my overview for BTCUSDT, feel free to check it and write your feedback in comments👊
A few moments ago price entered to rising channel, where it at once fell to support line, breaking $57900 level.
Then price in a short time ros to this level, broke it again, and made retest, after which continued to move up.
Later BTC rose to $65900 level, turned around, and declined lower support line, thereby exiting from rising channel.
After this, price continued to move up inside wedge, where it bounced from support line and rose to $65900 level.
Soon, price broke this level, and rose to resistance line, after which made a correction and now continues to grow.
In my mind, BTC can bounce up from support line to $72500, exiting from wedge pattern.
If this post is useful to you, you can support me with like/boost and advice in comments❤️

HelenP. I Bitcoin will exit from pennant and then continue riseHi folks today I'm prepared for you Bitcoin analytics. Some time ago, the price traded below support 2, which coincided with the support zone and soon broke this level. Then price tried to grow more, but failed and dropped to the trend line, breaking support 2 one more time. After this movement, the price entered the pennant, where it made at once a strong impulse up, breaking support 2 again. Then price continued to move up and later reached support 1. Price some time traded near this level, then broke it and some time traded inside one more support zone. Next, BTC little grew and then dropped below 1st support level, breaking it again, but soon turned around and backed up to the support zone (68200 - 67700). After this, the price bounced down to the trend line, after which turned around and rebounded up to the resistance line of the pennant and now trying to exit from this pattern. So, in my mind, BTCUSDT will exit from the pennant, make a retest, and continue to move up. That's why I set my goal at 71000 points. If you like my analytics you may support me with your like/comment ❤️

Bitcoin can rebound up from pennant to 71K pointsHello traders, I want share with you my opinion about Bitcoin. Observing the chart, we can see that the price rose to the current support level, which coincided with the support zone. After it reached this level, it some time traded near and even entered the support area, but then dropped to the buyer zone. Also, the price started to trades inside the pennant, where later, BTC rebounded from the buyer zone and started to grow. Soon, the price turned around and made a correction movement to support line of the pennant. After this, BTC turned around and made impulse up, making a fake breakout of the 60800 level. In a short time later, the price reached the current support level, broke it, and made a retest. Then it continued to grow until reached the resistance line of the pennant, after which, a not long time ago, it rolled down. So, at the moment, I think that the price can decline to support line and then rebound up, exiting from the pennant pattern. After this, I think BTC can continue to grow, for this case, I set my TP at 71000 points. Please share this idea with your friends and click Boost 🚀

Bitcoin will break support level and continue to fall to 61800Hello traders, I want share with you my opinion about Bitcoin. By observing the chart, we can see that the price some days reached the support level, which coincided with the buyer zone, but at once rebounded and declined a little below. After this movement, the price started to grow inside an upward channel, where it soon reached the 59000 level and broke it. Next, the price made a correction to the buyer zone and then continued to move up to the channel's resistance line, which coincided with the current support level and then turned around. BTC corrected the 59000 level, after which it rebounded and in a short time rose back to the 66300 level and some time traded near. Soon, the price broke this level and rose almost to the channel's resistance line, but recently it turned around and dropped to the support level, which continues to trade very close. In my opinion, the price can make a small move up and then continue to decline to support line of the upward channel, breaking the support level. That's why I set my TP at 61800 points. Please share this idea with your friends and click Boost 🚀

HelenP. I Bitcoin can continue to gorw inside upward channelHi folks today I'm prepared for you Bitcoin analytics. A few moments ago, the price rose to support 1, which coincided with the support zone and then started to decline. In a short time, BTC fell to support 2, which coincided with one more support zone and some time traded inside. Then, BTC tried to grow, but failed and dropped to the trend line, breaking support 2. After this, the price started to grow inside the upward channel, where it soon broke the 2nd support level again, made the correction, and later rose to support 1. When BTC reached this level, it broke it and rose to the channel's resistance line. After which price turned around and made a small correction to the support zone and then continued to move up in an upward channel. But a not long time ago price almost fell to the trend line, therefore I expect that BTCUSDT will decline a little more, and then continue to grow, thereby making a fake breakout of the channel. That's why I set my goal at 71400 points. If you like my analytics you may support me with your like/comment ❤️

HelenP. I Bitcoin will fall to trend line and then rebound upHi folks today I'm prepared for you Bitcoin analytics. Some days ago, the price declined almost to support 2 but soon turned around and started to grow. In a short time, BTC rose to support 1, which coincided with the current support zone, and some time traded near, after which it dropped to support 2. When the price fell, it broke the 62000 support level and some time traded below, after which it quickly rose back and trades higher. Later price broke support 2 again and fell to the trend line, after which it turned around and started to move up. Soon, the price reached support 2, broke it, and then made a correction to the trend line, after which rebounded and continued to move up. Later BTC reached support 1, broke it, and rose one more, but a not long time ago it turned around and started to decline. So, in my mind, BTCUSDT will fall to the trend line, which is located inside the support zone, and then continue to move up. For this case, I set my goal at 69000 points. If you like my analytics you may support me with your like/comment ❤️

BTC: MACD Signals Aligning for a Potential Buying OpportunityLooking at several factors in parallel, BTC’s MACD is showing promising signs. The fast-moving average has started to curl up, suggesting a possible bullish cross above the slower line—typically a strong buy signal. The histogram has also been in the red for several weeks but is now curling upward, and we could be looking at our first green week.
However, the lack of a significant volume increase means there’s no clear confirmation of a trend reversal just yet, and we aren’t seeing the momentum required for new higher highs or all-time highs. But if these signals continue to align, this could turn into a fantastic buying opportunity.
The question is: will you take buying or selling actions based on these signals?

BITCOIN - Price can make correction and then continue to riseHi guys, this is my overview for BTCUSDT, feel free to check it and write your feedback in comments👊
Some days ago price entered to wedge, where it at once declined from resistance line to support line.
Also, it broke $58900 level, but later BTC backed up and broke this level one more time, after which made a correction.
Then price in a short time rose to $65800 level, and even entered to support area, but then bounced down.
Price exited from wedge and then started to trades inside triangle, where it fell to support line first.
After this movement, BTC started to grow and soon reached $65800 level, broke it, and now trades close support line.
Possible, price can exit from triangle, fall to support area, and then bounce up to $71500
If this post is useful to you, you can support me with like/boost and advice in comments❤️

HelenP. I Bitcoin can make retest and then continue to growHi folks today I'm prepared for you Bitcoin analytics. If we look at the chart we can see how the price some days ago BTC dropped lower than support 2, which coincided with the support zone, but soon turned around and made a strong impulse up. BTC reached support 1 and then some time traded near, even entering to one more support zone. Later, when the price entered the support zone a third try, it broke support 1 and rose until to the trend line, after which turned around and dropped to support 2, breaking support 1 again. Also, the price started to trades inside consolidation, where it some time traded near support 2 and then rose to support 1. But then BTC at once dropped to the support zone, after which it turned around and made a strong impulse up, breaking support 1 and exiting from consolidation. Also, it broke the trend line recently, and now continues to move up, so, I expect that BTCUSDT will make a retest of the trend line and then continue to grow. For this case, I set my goal at 66400 points. If you like my analytics you may support me with your like/comment ❤️

Harmony one is going up! Technical analysis + trade plan by BFChart Overview
Timeframe: 4-hour (Binance Exchange)
Price as of Analysis: $0.01346
Volume: 3.744 million ONE
Formation: Falling Wedge pattern
Chart Patterns and Indicators:
Falling Wedge:
A falling wedge pattern is typically a bullish reversal pattern, indicating that the current downward trend is weakening and a potential breakout to the upside could follow.
The narrowing of price action shows a decline in both support and resistance levels, with lower highs and lower lows.
The breakout is anticipated above the wedge resistance, potentially marking the beginning of an uptrend.
The VMC Cipher B indicator is similar to the MACD and shows signs of bullish divergence, meaning that while the price has been declining, momentum is building for a potential reversal.
The RSI is hovering around 50.25, which is neutral but can indicate momentum is shifting. If RSI starts increasing above 55, it will confirm bullish momentum.
Stochastic Oscillator is currently at 35.30, this shows the asset is near the oversold zone but still in neutral territory. A move above 40 may confirm a bullish trend reversal.
The HMA histogram shows early signs of turning bullish as the color changes and bars are in the process of shifting positive.
Volume has decreased over the wedge formation, which is typical of such patterns. An increase in volume after the breakout will serve as confirmation for a stronger upward move.
Potential Price Targets:
Immediate Resistance: $0.01360 - This is the wedge resistance. A breakout above this level confirms the pattern.
First Target: $0.01550 - Based on previous price levels, this area is the next resistance once the breakout occurs.
Second Target: $0.01750 - This aligns with the previous significant high and could be a target after the first resistance.
Risk Factors:
Stop-Loss: It’s crucial to place a stop-loss below $0.01200 (below the previous support levels) to manage risk in case of a false breakout.
Volume Confirmation: Ensure that the breakout occurs with significant volume, as low-volume breakouts may lead to a reversal back into the wedge.
Trading Plan
1. Entry:
Enter a long position after a confirmed breakout above the $0.01360 resistance with strong volume confirmation. A 4-hour candle close above this level should confirm the breakout.
2. Stop-Loss:
Place a stop-loss slightly below $0.01200 to manage the downside risk in case the falling wedge pattern fails and the price reverses.
3. Profit Targets:
First Target: Set a take-profit around $0.01550 to capture the first major move after the breakout.
Second Target: For those with a higher risk appetite, target $0.01750, which aligns with the next resistance.
4. Position Size:
Risk only 1-2% of your trading capital on this trade. Given the potential volatility and the falling wedge pattern, it's essential to manage position size conservatively.
5. Monitoring:
Keep an eye on the volume and the RSI/Stochastic Oscillator. If RSI rises above 55 and Stochastic confirms the upward movement, the breakout should gain more strength.
Monitor for any potential fake breakouts. If the price fails to close above the resistance on the 4-hour chart, consider delaying the entry until clear confirmation is given.
The Harmony (ONE/USDT) chart is showing a potentially bullish falling wedge formation, indicating that a reversal from the recent downtrend could occur soon. A breakout above $0.01360 with confirmed volume is crucial for confirming the uptrend. If confirmed, Harmony could target $0.01550 and $0.01750 in the near term, but it's important to employ tight risk management through proper stop-loss placement.

Bitcoin is going up, short consolidation phase TA+TRADE PLANBitcoin's price action against USDT on a 1-hour timeframe with several technical indicators and key levels. Here is my technical analysis + trade plan by Blaž Fabjan
Ascending & Descending Trading Channels:
The price is moving between ascending and descending channels. This can indicate phases of higher highs and higher lows (ascending) followed by lower highs and lower lows (descending), which often signals periods of short-term consolidation or corrections.
Resistance Levels:
Multiple resistances are clearly marked on the chart around the price of $68,556.87 and $67,000. The price has struggled to break above these levels multiple times, making it a critical zone to watch for future price action.
Support Levels:
Support is visible around $61,758.48 and $60,301.68, representing strong areas where the price previously rebounded. These levels are essential for managing downside risk.
Consolidation Phase:
The price appears to be consolidating after rejecting the upper resistance line. This phase suggests market indecision or preparation for a breakout.
VMC Cipher_B Divergences:
Divergences in this indicator show potential weakening of the bullish trend, which could signal a pullback. The green and red dots suggest possible points of reversal, important for catching trend changes.
RSI (Relative Strength Index):
RSI is at 52.96, indicating the market is neutral but slightly leaning toward the bullish side. If RSI breaks above 70, this could signal overbought conditions, while a drop below 30 would indicate oversold.
Stochastic Oscillator:
Currently in the oversold region (18.22), indicating a possible upward reversal soon. This could hint at a short-term bullish move.
HMA (Hull Moving Average) Histogram:
The HMA is showing a mixed trend, but the upward slope hints at mild bullish momentum that needs confirmation from price action or volume spikes.
Trading Plan
Entry Points:
Long Position: Look for a breakout above $67,000 or $68,556.87, especially with strong volume confirming the upward move. You could set a buy stop order slightly above these levels to capture the momentum.
Short Position: If the price rejects resistance and breaks below $64,500 (the recent low), this could indicate a further decline toward support levels around $61,758.48 or lower.
Stop-Loss:
For long trades, place stop-losses just below $64,500 to minimize risk in case of a fake breakout or false bullish signal.
For short trades, place stop-losses above $67,000, as a break above this could invalidate the bearish trend.
Profit Targets:
Upside Targets: First target is around $70,000 (a psychological round number and historical resistance), followed by $71,000.
Downside Targets: The initial target for a short would be $61,758.48. A break below could see prices test $60,301.68, the lower boundary of this channel.
Risk-Reward Ratio:
Ensure that any trade maintains a risk-reward ratio of at least 1:2. For instance, if you risk $1,000, you should aim for a reward of $2,000.
Additional Confirmation:
Wait for additional signals, such as volume spikes or confirmation from indicators like RSI or Stochastic, before entering a position. The market could continue to consolidate before choosing a direction.
Time Horizon:
Given that this is an hourly chart, these trades are more suited for short-term to medium-term traders. Ensure to adjust your stops and targets as the market evolves, and check for any upcoming fundamental events (like economic news or regulatory updates) that could impact Bitcoin's price.
By following this plan, you can manage your trades effectively, balancing risk and reward while being prepared for both bullish and bearish scenarios.

Bitcoin will exit from pennant and continue to fall to 59KHello traders, I want share with you my opinion about Bitcoin. By observing the chart, we can see that the price some days ago entered to wedge, where it at once rebounded from the resistance line and fell to the support line, breaking the support level. After this movement, BTC started to grow and soon reached 57600, which coincided with the support area, broke it, and made a retest. Then it a little, after which made a correction to the support level and then made an impulse up to the resistance line of the wedge, which coincided with the 64000 level with the seller zone. Bitcoin some time traded near this level and later broke it, after which even exited from the wedge, but then it started to decline inside the downward pennant. Later price broke the 64000 level and dropped to the support line of the wedge, turned around and in a short time rose to the resistance level, but a not long time ago it turned around and fell to the support line. Now, the price trades near this line and I think it can rise a little and then continue to decline, thereby exiting from the pennant. For this case, I set my TP at 59000 points. Please share this idea with your friends and click Boost 🚀

Bitcoin can exit from triangle and continue to declineHello traders, I want share with you my opinion about Bitcoin. Observing the chart, we can see that the price a few moments ago entered a downward pennant, where it soon declined to the resistance level, which coincided with the seller zone and broke it. Then the price dropped to the support level, and even later entered the buyer zone, where it reached the support line and at once turned around and started to grow. In a short time later BTC reached the resistance line of the pennant, exited, and then made the correction. After this, the price rose to the 63300 resistance level, broke it, and even rose higher than the seller zone, but soon turned around and started to decline inside the downward triangle. Price broke the 63300 level and fell to the support level, where some time traded near and later dropped to the support line of the triangle. Soon, BTC turned around and broke the support level one more time and grew to a resistance level, but a not long time ago it turned around and fell to the support line of the triangle. So, in my opinion, BTC can rise a little and then rebound down, thereby exiting from the triangle. Also then it can continue to decline, therefore I set my TP at 61200 points. Please share this idea with your friends and click Boost 🚀

BITCOIN - Price can bounce down from wedge to $59000 pointsHi guys, this is my overview for BTCUSDT, feel free to check it and write your feedback in comments👊
Recently price declined to support line and at once bounced up to $60900 level and soon broke it.
Then, price made retest and continued to move up to resistance line, after which it turned around and declined to support line.
Next, price rose to resistance line, but soon started to decline inside wedge, breaking $64300 level at once.
After this, price fell to support line of wedge and then bounced up to resistance line, after which started to fall.
In a short time, BTC fell to support line of wedge, but recently it rose higher than $60900 level, breaking it.
Now, I think that price can rise slightly and then bounce to $59000, breaking support level and exiting from wedge.
If this post is useful to you, you can support me with like/boost and advice in comments❤️

HelenP. I Bitcoin will small correct and then rise to trend lineHi folks today I'm prepared for you Bitcoin analytics. Some days ago, the price reached the trend line and at once rebounded and made a strong impulse down to the resistance level, which coincided with the resistance zone. BTC some time traded inside this area and then dropped to the support level, breaking the 63600 level. Then price some time traded near the support level, and later declined to the support area, after which turned around and started to grow to the resistance level. In a short time, BTC rose to the 63600 level and even rose to the trend line, but then at once turned around and dropped back to the support level, making a fake breakout of the 63600 level. After this movement, the price turned around and started to grow, and now I expect that BTCUSDT will make small correction to the support level. Then it can turn around and start to move up to the trend line, therefore I set my goal at 63000 points, which coincided with this line. If you like my analytics you may support me with your like/comment ❤️

HelenP. I Bitcoin will drop from resistance level to $59100Hi folks today I'm prepared for you Bitcoin analytics. Some days ago price entered to wedge and at once rebounded fromresistane line and started to decline. In a short time, BTC fell lower then support level, which coincided with the support zone, but then it tried to back up and failed. Next, the price dropped to the trend line, which is the support line of the wedge also, and then started to grow. BTC quickly rose to the 57500 level, broke it, and later made a retest and continued to move up. Later, the price reached the resistance level, which coincided with the resistance zone, and some time traded near this level. Then BTC broke the 63600 level and later rose to the resistance line of the wedge, after which turned around and made an impulse down, thereby exiting from the wedge and breaking the resistance level as well. After this movement, BTC little declined more and not long time ago rose back to the 63600 level. So, now I expect that BTCUSDT will rebound from the resistance level and drop. Therefore I set my goal at 59100 points. If you like my analytics you may support me with your like/comment ❤️

Bitcoin can make small correction and then continue to growHello traders, I want share with you my opinion about Bitcoin. Observing the chart, we can see that the price some time ago entered to upward channel, where it soon reached the resistance level, which coincided with the seller zone, but at once bounced and made a correction to the support line of the channel. Next, the price continued to move up and finally broke the 64900 level, and later reached the channel's resistance line again. But then BTC turned around and started to decline, so, soon, the price broke the resistance level one more time and exited from the upward channel. After this, the price continued to fall inside the downward pennant, where it first fell to the support level, which coincided with the buyer zone. When BTC fell to this level, it at once broke it, some time traded near the buyer zone, and then declined to support line of the pennant. Next, it turned around and rose higher than the 61200 level in a short time, breaking it again, and soon reaching the resistance line of the pennant. A not long time ago, BTC exited from pennant and now it continues to grow. For this case, I think that the price can make a small movement down and then continue to grow to the resistance level. That's why I set my TP at the 64900 level. Please share this idea with your friends and click Boost 🚀

HelenP. I Bitcoin, after breaks support level, can continue fallHi folks today I'm prepared for you Bitcoin analytics. A few moments ago, the price rose to the resistance level, which coincided with the resistance zone, and when it reached it, the price made a correction movement. Then BTC rose back and repeated movement down and then continued to grow next. In a short time, the price broke the resistance level and reached the trend line, which soon broke too, and tried to grow next. But BTC couldn't rise more, turned around, and started to decline. Soon, it broke the 64600 level, made a retest, and then fell to the trend line, after which continued to decline next near this line. Also, it tried to rise but failed and dropped more, until to my past goal (60K) in the past idea, breaking the trend line and even declining a little below the 60800 support level. Next, it rose back, breaking the trend line again, but a not long time ago fell back to the support level, and now trying to break it. So, I expect that BTCUSDT will break the support level, make a retest, and then continue to decline to the trend line. For this case, I set my goal at 58800 points, which coincided with this line. If you like my analytics you may support me with your like/comment ❤️

BITCOIN - Price can continue to move down to support levelHi guys, this is my overview for BTCSDUT, feel free to check it and write your feedback in comments👊
Some time ago price entered to falling channel, where it declined to support line, breaking $63900 level.
BTC rose to resistance line and bounced down, breaking $57200 level, but then price started to grow in another channel.
In rising channel, BTC broke $57200 level and later rose to resistance line, which coincided with $63900 level.
Price made a little gap, and even later rose higher than $63900 level, but soon turned around and started to decline.
In a short time, BTC exited from rising channel, broke $63900 level, and continued to move down close resistance line.
I think that price can make small movement up and then continue to decline, between resistance line, to $57200 level.
If this post is useful to you, you can support me with like/boost and advice in comments❤️
