Could this be the end of Bitcoin’s trend?The Current State of Bitcoin’s Trend: Has the Uptrend Come to an End...?
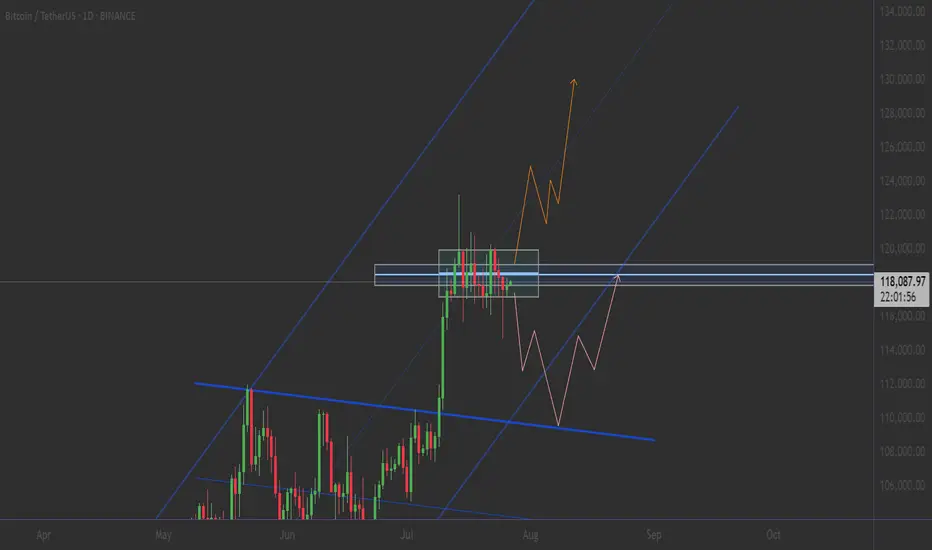
Based on recent analyses, Bitcoin has exited its 4-hour channel over the past few days, and there is still a possibility for further correction. However, this does not mean that the uptrend for Bitcoin is over.
My targets for Bitcoin remain the same as before: 123,700 and 129,710. It’s even possible that we might see a wick above these prices.
For those with more capital who are looking to buy Bitcoin, there are two good entry levels:
110,880
109,770
Everything else is clearly shown on the chart. Please be cautious, as there will likely be high volatility once the market opens.
Be sure to open the analysis link and boost the analysis with your likes.
BTC

BITCOIN: THE PERFECT STORM - MULTIPLE BREAKOUT PATTERNS ALIGNED⚠️ CRITICAL SUPPORT LEVELS
🛡️ Support 1: $115,000 (-3%) - Triangle support
🛡️ Support 2: $110,000 (-7%) - Channel support
🔴 DANGER ZONE: $105,000 (-11%) - Multiple pattern failure
So...
Strategy: Quick profits on pattern completion 🎨
Entry: $115k (Triangle breakout confirmation) 📊
Stop Loss: $114k below (Tight risk management) ❌
Target: $125k (+10%) ✅
Time Horizon: 2-3 weeks 📅
Risk/Reward: 1:6 🎯
________________ NOTE _____________
⚠️ This is not financial advice. Bitcoin is highly volatile and risky. Only invest what you can afford to lose completely. Always do your own research and manage risk appropriately 🚨
SOLANA $250 INCOMING? or $150 again?We can see a wedge is forming, price is at a major point, break above with a failed break below the resistance - we see high potential for $250.
Failed breakthroughs and a rejection? We see $150 once more.
Thoughts?

BTCUSDT 1D – Retesting Key Support, Will Bulls Hold the Line?Bitcoin is retesting a crucial structural support level around $112K after its recent local top near $120K. This zone previously acted as resistance and is now being tested as support — a textbook bullish continuation signal if it holds.
Historically, these flips (from resistance to support) have triggered strong upside momentum, as seen after the $78K breakout earlier this cycle. However, failure to hold this level could open the door for a deeper correction toward $100K or even the $90K region.
This chart outlines the major structural zones:
Long-term accumulation base near $70–78K
Resistance flip zone at $110–112K
Local resistance near $120K
📌 If bulls defend this zone and reclaim momentum, we could see another push toward cycle highs. If not, patience is key — the next high-conviction entry may come lower.
How are you positioning around this zone? Let me know in the comments 👇

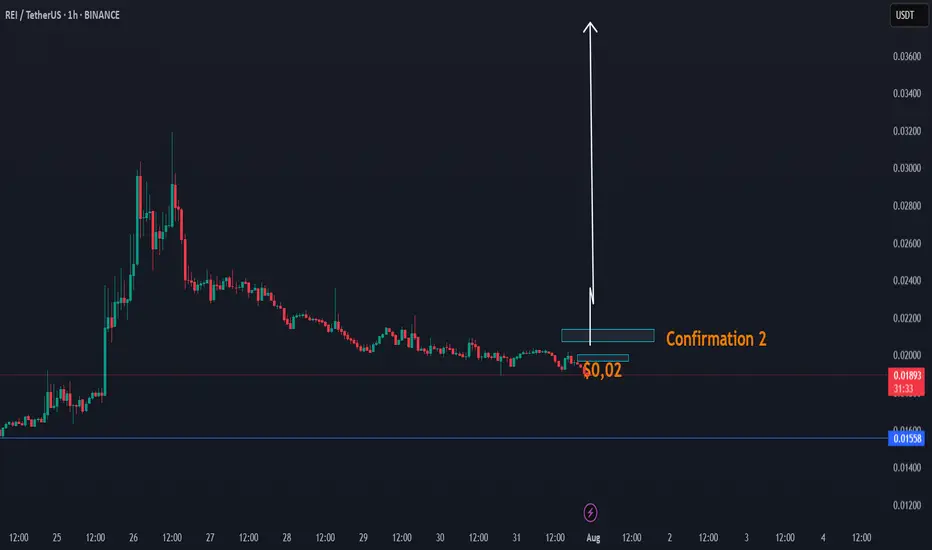
DAY UPDATE REI/USDT THE INCREASE CANDLE OF UP $0,03 - $0,05REI is an interesting coin since the update of Q4
We have seen that this coin was able to increase to $0,031 and until here $0,018 zone, a return to where we are now. There is a high chance that this coin can recover next 24H if this coin is able to confirm the confirmation $0,02 - $0,021
This coin, as before, was targeted at $ 0.02 and had low volume. We expect that if it comes back to $ 0.02, it will be confirmation of the volume, which can take the trend with a candle to up $0,03
REI CONFIRMATIONS ZONE
Higher time frame
When you look normally at this coin, then this coin is in a trend line of breakdown. This can change with the next confirmations. The question is, are we going to see again $0,02 the next 24h? If yes high chance of a break.
We also have a cycle update 2025, check it here, expecting $0,90
#BTC Update #14 – Aug 02, 2025#BTC Update #14 – Aug 02, 2025
Unfortunately, Bitcoin has closed below its current channel and now appears to be retesting that level. If this retest confirms, I expect a pullback down to the $110,000 zone. However, if Bitcoin manages to re-enter the channel, its first target will be $118,800. Although it’s a descending channel, moving within it suggests a relatively stable market. Closing below it may not end well and could deepen the retracement. That's why I recommend caution with all coins right now.
Even though it seems like a distant possibility at the moment, don’t forget there’s also an imbalance zone around the $103,500 level. A sharp wick or a significant drop could bring Bitcoin back to revisit that area. The probability is currently low, but it can’t be ruled out completely. I don’t recommend rushing into any long or short positions at this stage.

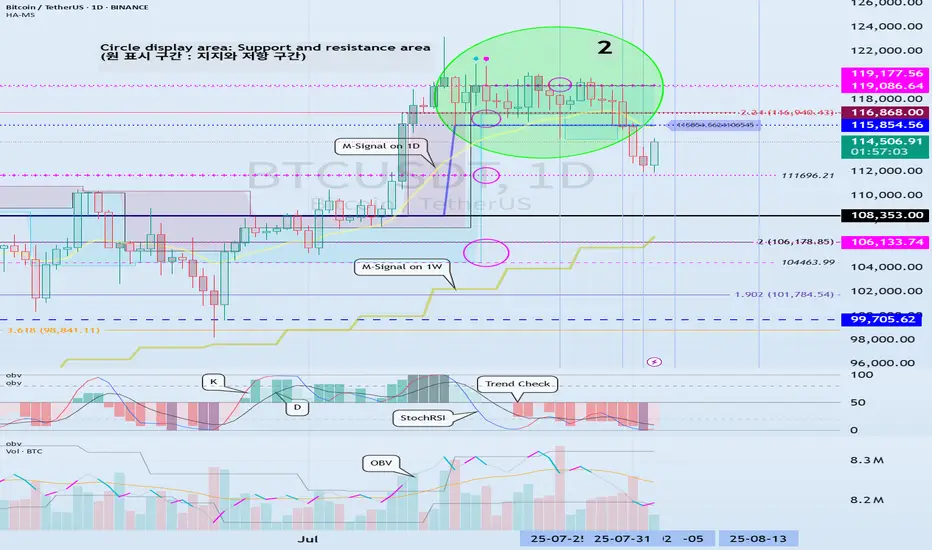
The key is whether it can rise above 115854.56
Hello, traders!
Follow us to get the latest information quickly.
Have a great day.
-------------------------------------
(BTCUSDT 1W chart)
The key is whether it can rise above the newly created DOM (60) indicator point of 119086.64.
If this fails and the price declines, we need to check for support near the previous all-time high (ATH) of 108,353.0.
Since the M-Signal indicator on the 1W chart is rising near 108,353.0, this area is expected to serve as important support and resistance.
-
(1D chart)
This period of volatility is expected to continue until August 6th.
Therefore, the key question is whether the price can rise above 115,854.56 and maintain its upward momentum.
If not, further declines are likely.
-
To rise above 115,856.56,
- The StochRSI indicator must rise within the oversold zone and remain above K > D.
- The On-Bottom Volume indicator must continue its upward trend with OBV > OBVEMA. - The TC (Trend Check) indicator should maintain an upward trend. (If possible, it's best to rise above the 0 point.)
If the above conditions are met and the price rises above 115854.56, it is expected to attempt to rise above 119177.56.
This period of volatility is a significant period of volatility.
Therefore, if the price falls below the HA-High ~ DOM(60) range and encounters resistance during this period, you should prepare for further declines.
-
The basic trading strategy is to buy in the DOM(-60) ~ HA-Low range and sell in the HA-High ~ DOM(60) range.
However, if the price rises in the HA-High ~ DOM(60) range, a stepwise upward trend is likely, while a decline in the DOM(-60) ~ HA-Low range is likely to result in a stepwise downward trend.
Therefore, a split trading strategy is recommended as the basic trading strategy.
When executing a trade, appropriate profit taking secures the liquidity of your investment, giving you the opportunity to seize new opportunities.
To achieve this, you should consider your intended investment horizon before initiating the trade and divide the trade accordingly.
-
The HA-Low indicator on the 1D chart is currently at 89294.25.
Therefore, I believe the market believes it's in a position to take profit.
-
Thank you for reading to the end.
I wish you successful trading.
--------------------------------------------------
- This is an explanation of the big picture.
(3-year bull market, 1-year bear market pattern)
I will explain in more detail when the bear market begins.
------------------------------------------------------
ETH | Ethereum - Weekly Recap & Gameplan - 03/08/25📈 Market Context:
Traders are currently anticipating a potential 0.25% rate cut at the September FOMC meeting, which continues to support the broader bullish outlook.
While the market pulled back following weaker-than-expected Non-Farm Payroll data, overall sentiment remains optimistic.
Greed has cooled off into a more neutral stance. Historically, August often brings some consolidation or pullbacks — but the structural bias for crypto market remains bullish.
🧾 Weekly Recap:
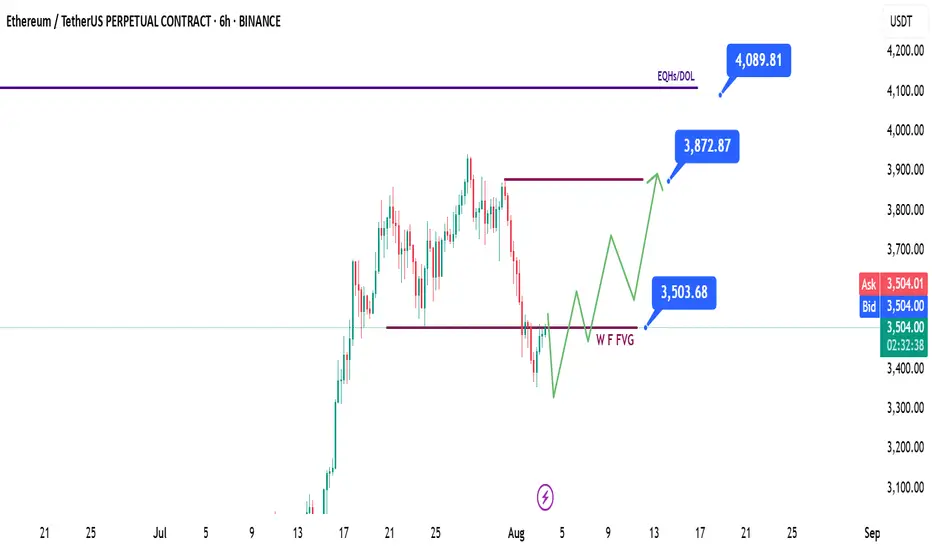
ETH started the retracement movement after building a bullish trend over the past couple of weeks.
It’s mainly being affected by Bitcoin's bearishness, so we’re closely following BTC’s price action.
ETH has tapped into the Weekly Fair Value Gap, which is a key level for me.
We may see a bounce from here.
📌 Technical Outlook & Game Plan:
I expect to see another low on ETH before we go up — as I’m also anticipating one more leg down on Bitcoin.
So I’ll wait for a final bearish expansion and a trap for late sellers before positioning for longs.
After that, I want to see price closing above the purple line at $3500.
🎯 Setup Trigger:
A candle close above the $3500 level will be my signal to look for long setups.
📋 Trade Management:
Stoploss: Below the swing low that breaks above $3500
Take Profit: Targeting $3870, but will trail and lock in aggressively in case of deeper downside expansion.
💬 Like, follow, and comment if this breakdown supports your trading! More setups and market insights coming soon — stay connected!
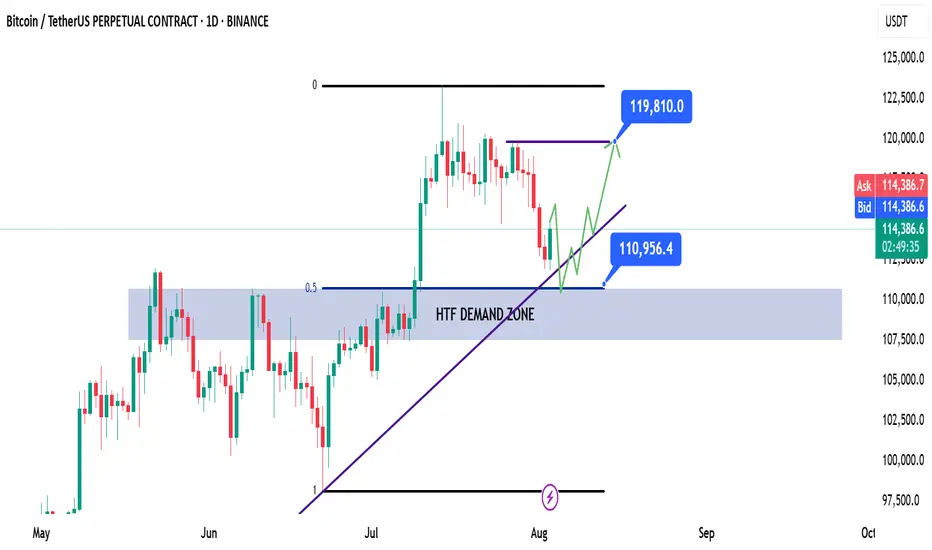
BTC | Bitcoin - Weekly Recap & Gameplan - 03/08/25📈 Market Context:
Traders are currently anticipating a potential 0.25% rate cut at the September FOMC meeting, which continues to support the broader bullish outlook.
While the market pulled back following weaker-than-expected Non-Farm Payroll data, overall sentiment remains optimistic.
Greed has cooled off into a more neutral stance. Historically, August often brings some consolidation or pullbacks — but the structural bias for Bitcoin remains bullish.
🧾 Weekly Recap:
• After printing new all-time highs, BTC began a healthy retracement.
• Price action closely mirrored the Nasdaq's (NQ) pullback during the week.
• We saw a small bounce mid-week, but no strong reversal confirmation yet.
📌 Technical Outlook & Game Plan:
→ I’m watching for price to revisit the long-term bullish trendline.
→ A slight deviation into the HTF demand zone would be ideal for long entries.
→ Bonus confluence: This area also aligns with the 0.5 Fibonacci retracement (Equilibrium level), providing a key discount zone.
🎯 Setup Trigger:
I’ll be watching for a confirmed bullish break of structure (BOS) on the 1H–4H timeframes to signal a reversal.
On confirmation, I’ll look to enter a swing long position.
📋 Trade Management:
• Stoploss: Below the 1H–4H demand swing low
• Take Profit:
→ I’ll trail stops and lock in profits aggressively
→ Main target: $119,820
💬 Like, follow, and comment if this breakdown supports your trading! More setups and market insights coming soon — stay connected!
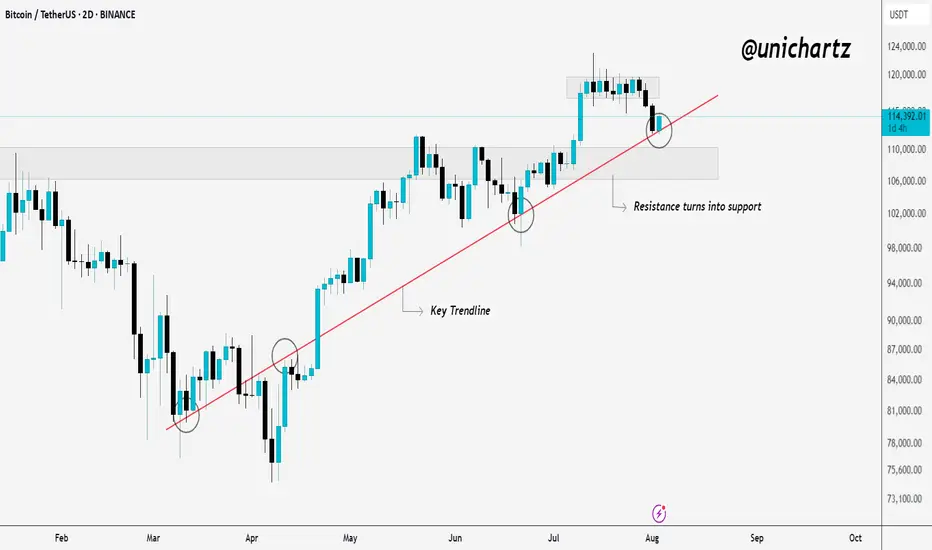
Smart Money Watching This Line — Are You?Bitcoin is holding strong above a key trendline that has acted as dynamic support since March. Every time price touched this line, buyers stepped in, and once again, it’s doing its job.
What was once resistance has now flipped into solid support. The recent pullback seems healthy, and the price is trying to bounce from the trendline area again.
As long as CRYPTOCAP:BTC respects this structure, the bullish momentum remains intact. If it holds, we could see another leg up from here.
DYOR, NFA
Thanks for reading!
My bullish view on BTCIf we break upwards in this channel we will see 134k and/or 140k depending on the resistance on the trend lines!

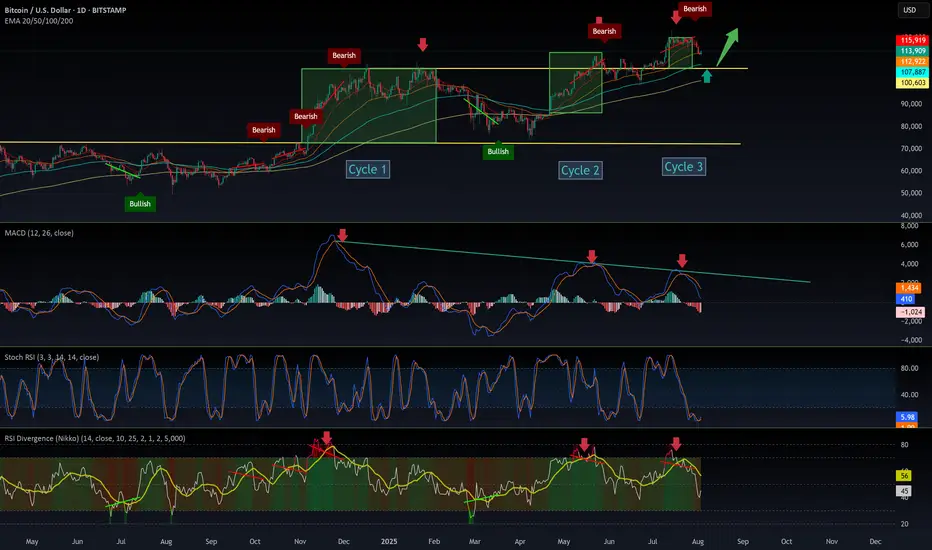
$BTC New Cycle: It’s Hard Not to Notice the ShiftSince December 2024, CRYPTOCAP:BTC has been closely following the SPX500, forming three similar cycles—each decreasing in intensity and shorter in duration.
The similarities are striking, especially when analyzing the MACD and RSI.
Each cycle ends with a bearish divergence.
Each cycle sees a rebound or bottom during consolidation, often touching the top of the previous cycle.
Most importantly, the cycles are accelerating.
However, it’s difficult to draw a definitive conclusion. These patterns are new in Bitcoin’s history, and there's no past reference for such institutional-driven behavior.
I believe the entry of institutions is reshaping Bitcoin’s rhythm. Their strategy is accumulation, not speculation, which brings more stability but also alters traditional crypto cycles.
What do you think will be the consequences of this shift?
Drop your thoughts in the comments👇
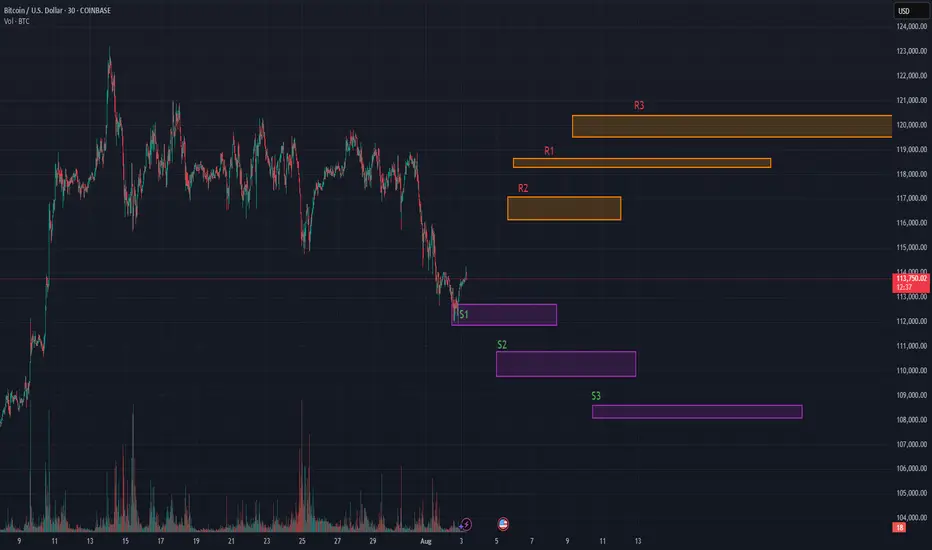
$BTC Breaking Down. Price bleeds, conviction doesn’t.Price bleeds, conviction doesn’t.
This was originally posted previously <24hrs but was hidden due to a link. Here is the pic of the original so you can see S1 bounced perfectly, lets see how much momentum we can get.
OG Thread continued..
Is this the dip worth buying?
BTC is retesting key quant support zones after a high-volume rejection near $116K. Despite the short-term dip, structure remains bullish from a mid-term lens.
• Quant Support Levels
• S1: $112,412
• S2: $110,935
• S3: $108,711
• Resistance Levels:
• R1: $116,113
• R2: $118,337
• R3: $119,814
On chain metrics:
• On-chain data confirms short-term holder capitulation into high-ownership clusters at $112K–$110K.
• Volatility contraction suggests a base-building phase, not a breakdown.
• Cup-and-handle formation remains valid on higher timeframes.
• Institutional Context:
• Accumulation increasing below $115K.
• Analysts projecting breakout potential to $129K–$133K if BTC can reclaim the $116.1K pivot.
Quant traders are eyeing this pullback as a healthy setup — not a breakdown.
I believe these are perfect accumulation levels anywhere in the blue square should be fine for a play to the upside.
Want Quant levels? Let me know!
Seven topics explaining why Ethereum might be heading towards atSeven topics explaining why Ethereum might be heading towards at least $4,500 after returning to its trend:
1. Market Sentiment and Bullish Reversal
When Ethereum breaks out of a consolidation phase or a downtrend, it often signals a shift in market psychology. A bullish reversal can be triggered by technical patterns such as ascending triangles, breakouts above key resistance levels, or bullish candlestick formations. Positive news (e.g., regulatory clarity, major partnerships, or favorable market reports) enhances investor confidence. Once traders recognize a trend reversal, it leads to increased buying momentum, further propelling ETH higher. This shift in sentiment often acts as a self-fulfilling prophecy, attracting more capital into the asset.
2. Institutional Adoption and Investment
Institutional investors, including hedge funds, asset managers, and pension funds, play a crucial role in cryptocurrency price dynamics. Large-scale investments, ETFs, or custodial solutions designed for institutional clients can generate significant buy pressure. Notable endorsements from major financial firms or integration of Ethereum-based products into mainstream financial platforms can serve as a validation, encouraging broader participation. This institutional involvement often brings stability and confidence, supporting sustained upward movement towards higher targets like $4,500.
3. DeFi and NFT Growth
Ethereum's ecosystem is the backbone of the decentralized finance (DeFi) sector and NFTs. The expanding adoption of DeFi applications (lending, borrowing, staking) and booming NFT markets increase demand for ETH, since it is essential for transaction fees and smart contract execution. As new projects and use cases emerge, the utility of ETH grows, directly impacting its value. Additionally, mainstream adoption of DeFi and NFTs draws more retail and institutional investors into the ecosystem, contributing to price appreciation.
4. Network Developments
Ethereum continues to undergo significant upgrades to address scalability, security, and sustainability. Ethereum 2.0, with features like proof-of-stake (PoS) consensus, shard chains, and Layer 2 scaling solutions (like Rollups), greatly enhance network efficiency. These upgrades improve user experience and reduce transaction costs, making Ethereum more attractive for developers and users. The improving technology infrastructure can result in increased transaction volume, user activity, and investor confidence, which collectively drive the price upward.
5. Macro and Cryptocurrency Market Factors
Broader macroeconomic conditions influence Ethereum’s price. A declining dollar, inflation concerns, or global economic uncertainty can push investors toward alternative assets like cryptocurrencies. Bitcoin’s market movement often correlates with ETH, and a bullish Bitcoin trend can lift ETH prices as well. Additionally, positive regulatory developments or a general rally in the crypto market can create a favorable environment, supporting Ethereum’s ascent to higher levels.
6. Technical Indicators
Traders rely heavily on technical analysis. Breakouts above significant resistance levels (e.g., previous highs around $3,500 or $4,000), increased trading volume, and bullish chart patterns such as flags or bullish divergence reinforce the upward trend. These technical signals attract momentum traders and institutional players, which accelerate the price increase. Consistent bullish technicals contribute to a self-sustaining upward trajectory toward the $4,500 target.
7. Supply Dynamics
Ethereum's supply mechanics significantly influence its price. The implementation of EIP-1559 introduced a fee-burning mechanism that reduces circulating supply over time, creating a deflationary pressure. When network activity is high, more ETH is burned, decreasing supply and potentially increasing scarcity. Furthermore, the transition to Ethereum 2.0's proof-of-stake reduces issuance, limiting new ETH supply entering the market. These supply-side dynamics, combined with growing demand, can lead to significant appreciation, moving ETH toward and beyond the $4,500 level.

ETH to + $4,5007 topics explaining why Ethereum might be heading towards at least $4,500 after returning to its trend:
1. Market Sentiment and Bullish Reversal
When Ethereum breaks out of a consolidation phase or a downtrend, it often signals a shift in market psychology. A bullish reversal can be triggered by technical patterns such as ascending triangles, breakouts above key resistance levels, or bullish candlestick formations. Positive news (e.g., regulatory clarity, major partnerships, or favorable market reports) enhances investor confidence. Once traders recognize a trend reversal, it leads to increased buying momentum, further propelling ETH higher. This shift in sentiment often acts as a self-fulfilling prophecy, attracting more capital into the asset.
2. Institutional Adoption and Investment
Institutional investors, including hedge funds, asset managers, and pension funds, play a crucial role in cryptocurrency price dynamics. Large-scale investments, ETFs, or custodial solutions designed for institutional clients can generate significant buy pressure. Notable endorsements from major financial firms or integration of Ethereum-based products into mainstream financial platforms can serve as a validation, encouraging broader participation. This institutional involvement often brings stability and confidence, supporting sustained upward movement towards higher targets like $4,500.
3. DeFi and NFT Growth
Ethereum's ecosystem is the backbone of the decentralized finance (DeFi) sector and NFTs. The expanding adoption of DeFi applications (lending, borrowing, staking) and booming NFT markets increase demand for ETH, since it is essential for transaction fees and smart contract execution. As new projects and use cases emerge, the utility of ETH grows, directly impacting its value. Additionally, mainstream adoption of DeFi and NFTs draws more retail and institutional investors into the ecosystem, contributing to price appreciation.
4. Network Developments
Ethereum continues to undergo significant upgrades to address scalability, security, and sustainability. Ethereum 2.0, with features like proof-of-stake (PoS) consensus, shard chains, and Layer 2 scaling solutions (like Rollups), greatly enhance network efficiency. These upgrades improve user experience and reduce transaction costs, making Ethereum more attractive for developers and users. The improving technology infrastructure can result in increased transaction volume, user activity, and investor confidence, which collectively drive the price upward.
5. Macro and Cryptocurrency Market Factors
Broader macroeconomic conditions influence Ethereum’s price. A declining dollar, inflation concerns, or global economic uncertainty can push investors toward alternative assets like cryptocurrencies. Bitcoin’s market movement often correlates with ETH, and a bullish Bitcoin trend can lift ETH prices as well. Additionally, positive regulatory developments or a general rally in the crypto market can create a favorable environment, supporting Ethereum’s ascent to higher levels.
6. Technical Indicators
Traders rely heavily on technical analysis. Breakouts above significant resistance levels (e.g., previous highs around $3,500 or $4,000), increased trading volume, and bullish chart patterns such as flags or bullish divergence reinforce the upward trend. These technical signals attract momentum traders and institutional players, which accelerate the price increase. Consistent bullish technicals contribute to a self-sustaining upward trajectory toward the $4,500 target.
7. Supply Dynamics
Ethereum's supply mechanics significantly influence its price. The implementation of EIP-1559 introduced a fee-burning mechanism that reduces circulating supply over time, creating a deflationary pressure. When network activity is high, more ETH is burned, decreasing supply and potentially increasing scarcity. Furthermore, the transition to Ethereum 2.0's proof-of-stake reduces issuance, limiting new ETH supply entering the market. These supply-side dynamics, combined with growing demand, can lead to significant appreciation, moving ETH toward and beyond the $4,500 level.

$BTC x $GOLDCRYPTOCAP:BTC , the largest store of value after TVC:GOLD and NASDAQ:XAG , historically follows TVC:GOLD movements!
2025 looks set to be epic for #Bitcoin

Reversal from Channel Bottom or a Real Breakdown? Identifying th
🎯 BTCUSDT - Analysis
🔹 Analysis Date: 1 August 2025
📉BTCUSDT:
Price is currently moving inside an ascending channel and has touched the bottom of the channel again, offering a potential buy opportunity.
However, for those seeking a low-risk entry, the zone around 118,000 could be ideal—if price returns to the channel and confirms support.
Although it seems the channel’s lower boundary might break, this could be a fake break to mislead traders before a rebound.
The support at 110,000 is a crucial short-term level; if it fails, a deeper correction toward 98,090 or even 94,000 is likely.
Our targets remain at the upper boundary of the channel.
⚠️ Risk Management Tip: Wait for confirmation near 118,000 if unsure, and always size positions based on overall volatility.

Bitcoin: New All-Time High — What’s Next?Bitcoin had an incredible run, breaking the old all-time high ($111,980) with strong bullish momentum and setting a fresh ATH at $123,218 (Binance). We just witnessed the first major corrective move of ~6% and a decent bounce so far — but the big question is:
What’s next? Will Bitcoin break higher over the summer or form a trading range here?
Let’s dive into the technicals.
🧩 Higher Timeframe Structure
May–June Range:
BTC was stuck between $110K–$100K, forming an ABC corrective pattern. Using trend-based Fib extension (TBFE) from A–B–C:
✅ C wave completed at $98,922 (1.0 TBFE)
✅ Upside target hit at $122,137 (-1 TBFE)
Full Bull Market TBFE:
➡️ 1.0 → $107,301 → previously rejected
➡️ 1.272 → $123,158 → recent rejection zone
Pitchfork (log scale):
➡️ Tapped the upper resistance edge before rejecting.
Previous Bear Market Fib Extension:
➡️ 2.0 extension at $122,524 hit.
2018–2022 Cycle TBFE:
➡️ 1.618 at $122,011 tapped.
Macro Fibonacci Channel:
➡️ Connecting 2018 low ($3,782), 2021 ATH ($69K), 2022 low ($15,476) →
1.618–1.666 resistance band: $121K–$123.5K.
✅ Conclusion: Multiple fib confluences mark the $122K–$123K zone as critical resistance.
Daily Timeframe
➡️ FVG / Imbalance:
Big daily Fair Value Gap between the prior ATH and $115,222 swing low.
BTC broke the prior ATH (pATH) without retest → a pullback to this zone is likely.
Lower Timeframe / Short-Term Outlook
We likely saw a completed 5-wave impulse up → now correcting.
The -6% move was probably wave A, current bounce = wave B, next leg = wave C.
➡ Wave B short zone: $120K–$121K
➡ Wave C target (1.0 TBFE projection): ~$113,326
➡ Confluence at mid-FVG + nPOC
Trade Setups
🔴 Short Setup:
Entry: $120,300–$121,000
Stop: Above current ATH (~$123,300)
Target: $113,500
R:R ≈ 1:2.3
🟢 Long Setup:
Entry: Between Prior ATH and $113,000
Stop: Below anchored VWAP (~$110,500)
Target: Higher, depending on bounce confirmation.
🧠 Educational Insight: Why Fibs Matter at Market Extremes
When markets push into new all-time highs, most classic support/resistance levels disappear — there’s simply no historical price action to lean on. That’s where Fibonacci extensions, channels, and projections become powerful tools.
Here’s why:
➡ Fibonacci extensions (like the 1.272, 1.618, 2.0) help estimate where trend exhaustion or profit-taking zones may appear. They are based on the psychology of crowd behavior, as traders anchor expectations to proportional moves from previous swings.
➡ Trend-Based Fib Extensions (TBFE) project potential reversal or continuation zones using not just price levels, but also the symmetry of prior wave moves.
➡ Fibonacci channels align trend angles across multiple market cycles, giving macro context — like how the 2018 low, 2021 ATH, and 2022 low project the current 1.618–1.666 resistance zone.
In short:
When you don’t have left-hand price history, you lean on right-hand geometry.
That’s why the $122K–123K zone wasn’t just random — it’s a convergence of multiple fib levels, cycle projections, and technical structures across timeframes.
⚡ Final Thoughts
Bitcoin faces major resistance around $122K–$123K backed by multiple fib and structural levels. A retest of the prior ATH zone (~$112K–$113K) looks probable before the next big directional move. Watch lower timeframe structure for signs of completion in this corrective phase.
_________________________________
💬 If you found this helpful, drop a like and comment!
Want breakdowns of other charts? Leave your requests below.

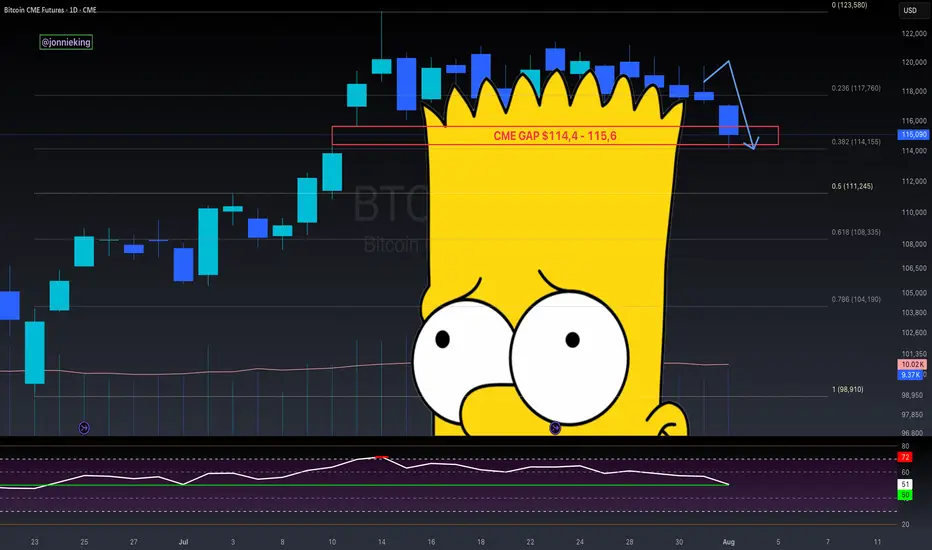
$BTC CME Gap + Bad Bart = Easiest Short EverCME Gap + Bad Bart is like taking candy from a baby 👨🏻🍼
Look at that textbook bounce off the .382 Fib 🤓
Pain ain’t over folks.
RSI still shows room on the downside 📉
Global Liquidity drain on the 4th.
Looking like the 50% Gann Level is next ~$111k
Get those bids in 😎
And never forget the BullTards who were telling you about the “Bollinger Band Squeeze” and UpOnly season 🫠
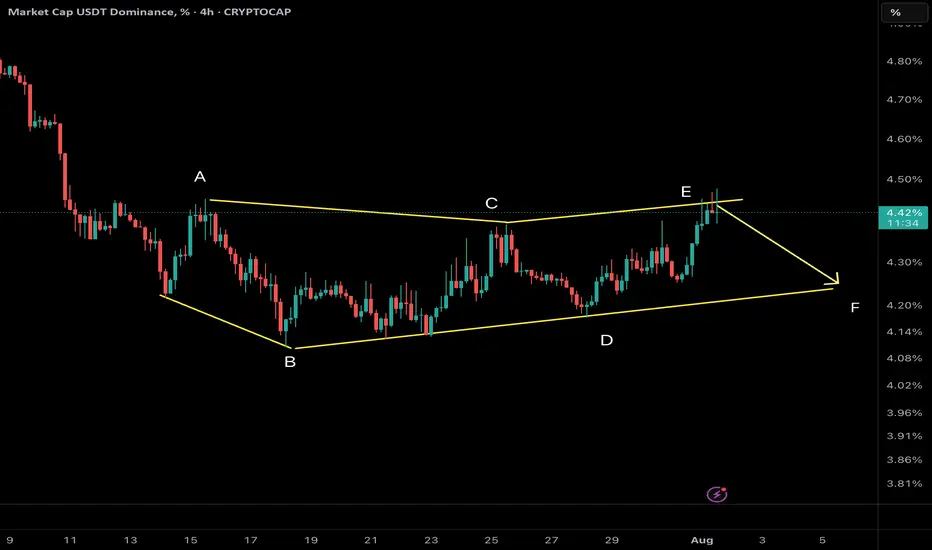
USDT Dominance – Potential Wave F Reversal?
We are tracking a NeoWave Diametric formation (7-leg corrective structure: A–B–C–D–E–F–G) on the USDT Dominance chart. Recently, price reached the projected resistance zone of wave E, and early signs of reversal are emerging.
⸻
🧠 Structural Analysis:
• The structure has developed with alternating legs in price and time, consistent with the symmetrical diametric rules.
• Wave E has likely completed, reacting from prior supply and resistance.
• A pullback from here can mark the beginning of Wave F, which in diametrics tends to retrace significantly toward the internal balance of the structure.
⸻
🔍 What to Watch:
• Confirmation of bearish intent via a break of internal supports or lower-timeframe BOS.
• Possible retracement targets: 4.2% → 3.95%, depending on momentum.
• A decisive break below 4.00% would reinforce the wave F scenario.
⸻
⚠️ Implications for the Crypto Market:
A drop in USDT Dominance typically indicates rotation into risk assets (alts/BTC/ETH). However, context matters — if the drop happens during a general market sell-off, it may reflect risk-off unwinding into fiat, not risk-on rotation.
⸻
🔄 Strategy Note:
• Avoid premature shorts or longs; wait for structure to confirm.
• Watch for smart money traps (e.g., false breakouts or liquidity grabs) around the recent highs.
⸻
📌 This is a high-risk zone for entering long USDT.D — be cautious with stablecoin bias.
📊 Analysis by CryptoPilot – Precision through structure.
BITCOIN 2025 TOP PREDICTION!This chart represents the M2 Money Supply / BTCUSD correlation with an 84-day delay.
You can see that the M2 Money Supply has formed a double top (with a lower high) in late September.
The price of bitcoin tops out 525–532 days after the halving in every cycle.
What does this mean?
In my opinion, bitcoin will continue to follow the direction of M2 in a highly correlated manner. This would mean that BTC's top is only 2 months away.
What price will bitcoin top?
That I'm not entirely sure of yet. The M2 / BTC correlation can be placed in a plethora of different scales. However, it currently looks like the top will be BELOW $200,000.
I hope to be proven wrong, but as of right now, bitcoin is following previous cycles perfectly (excluding the fact that we created a new ATH prior the halving, this was because of ETFs).
Given diminishing returns (and assuming that "supercycle" is not reached), $135,000 - $190,000 top in late September makes sense.

BITCOIN PREDICTION: NOBODY IS WATCHING THIS PATTERN !!!(warning)Yello Paradisers, I'm updating you about the current Bitcoin situation, which is extremely dangerous for crypto noobs that will get rekt again very soon!
It's going to be a big move soon. I'm telling you on a high timeframe chart we are doing multi-time frame analysis and on a high timeframe chart I'm updating you about the RSI indicator, the bearish divergence, the moving average reclaim, and the channel reclaim that we are having right now.
We are observing a shooting star candlestick pattern, which is a reversal sign, and I'm telling you what confirmations I'm waiting for to make sure that I can say with the highest probability that we are going to the downside. On a medium timeframe, I'm showing you two patterns: one is a head and shoulders pattern, then a contracting triangle, and on a low time frame, I'm sharing with you the ending diagonal because on a high time frame chart, we are either creating ABC or impulse, and I'm telling you what the probabilities are for the zigzag, which is a corrective mode wave, or the impulse, which is a motive mode wave.
I'm sharing with you what's going to happen next with the highest probability. Please make sure that you are trading with a proper trading strategy and tactics, and that's the only way you can be long-term profitable.
Don't be a gambler. Don't try to get rich quick. Make sure that your trading is professionally based on proper strategies and trade tactics.

BITCOIN CRASH PREDICTED! HERE’S WHAT HAPPENS NEXT! (scary)Yello Paradisers, Bitcoin crashed exactly as we predicted in the previous videos that it will happen with the highest probability.
In this video I am explaining to you what's gonna happen next.
Head and shoulders, neckline, is be breaking to the downside, we need a clear confirmation of a reclaim Our channel on high timeframe is getting breakout to the downside and confirmation was that a reclaim was already successful.
In this video I'm sharing with you Elliott Way theory on low timeframe and what needs to be done for confirmation perspective in order for us to continue to go to the downside or have a reversal to the upside.
Don't be a gambler. Don't try to get rich quick. Make sure that your trading is professionally based on proper strategies and trade tactics.
