BTC Leg2 115KBINANCE:BTCUSDT major movement from base 98K S to 106K $.BTC want to next movement to 115K $ but in middle of way 110K $ level there are sellers.
Support: 106.000 - 102.000
Resistance: 110.400 - 115.000
⚠️Control Risk Management
BTC

BTCUSDT - going to 113866.19$My analysis is based on numerology, all the numbers you see on the chart are from the same place. There is a certain numerological symbolism, which tells me that the price has already put the bottom 49(13) and will make a reversal from the zone 52260+- and then will fly strongly upwards with the target first 89k bucks, and after 113k. It's time to look for a good entry point.

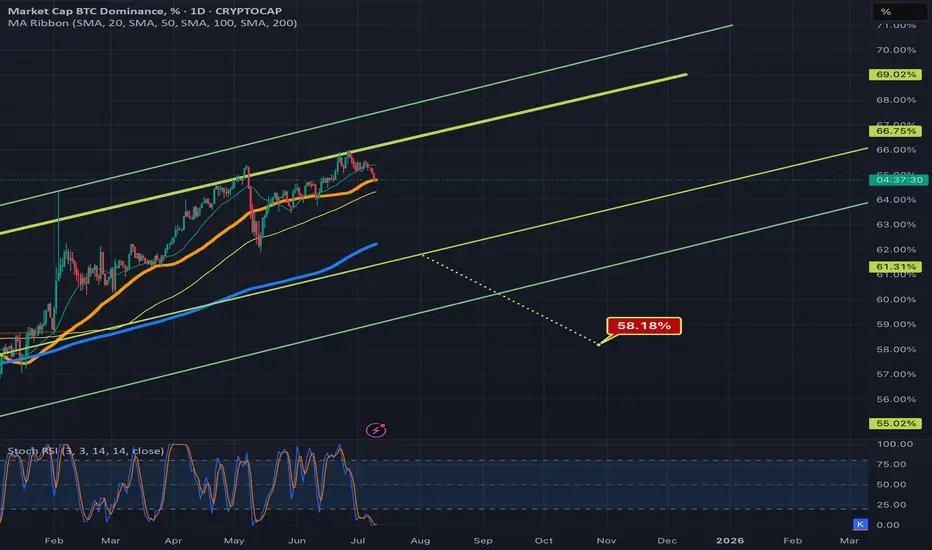
Bitcoin dominance chart ready to dump?Bitcoin dominance aka the btc.d chart has been in these 2 rising channels now for a long long tie, after ust recently being rejected down fro the top trendline of the neon yellow channel, there seems to be an opportunity here for it to potentially head down to retest the bottom trendline of that channel as well. If this occurs this could lead to an altcoin season. Price is right now combating the 50ma(in orange) and trying to maintain it as support. If this moving average flips to solidified resistance that greatly increases the chances of price going down to retest that bottom yellow trendline. Being that both of these channels are rising channels probability favors price action eventually breaking down from them instead of up so I have arbitrarily placed the measure move break down target of the yellow channel in a random spot below roughly where price could break down from the channel were it to be rejected strongly enough here by the 50ma. It’s retested this bottom trendline multiple times in the past and has always found away to avoid the breakdown thus far though so a breakdown there is definitely not guaranteed if it does retest the trendline, but even heading back down to retest the trendline in the first place may provide enough momentum for an alt season *not financial advice*
BITCOIN Epic Breakout! Buy!
Hello,Traders!
BITCOIN is trading in an
Uptrend and the coin made
An epic bullish breakout
Of an ATH level of 112k$
Which reinforces our bullish
Bias and we will be expecting
A further bullish move up
Buy!
Comment and subscribe to help us grow!
Check out other forecasts below too!
Disclosure: I am part of Trade Nation's Influencer program and receive a monthly fee for using their TradingView charts in my analysis.

Wyckoff Pattern- To understand trading at its core, you need to understand the Wyckoff Theory.
- Everything you need is in the chart and yes, it's simple and might look like copy-paste, but it's pure Wyckoff.
- Remember this post i made in 2021 ? check it again :
Remember, trading is like a washing machine, it shakes you up, spins you around, and pressures you to sell when you should be buying or Holding.
Not a price prediction, just a smarter way to level up your strategy.
Happy Tr4Ding !

Bitcoin can rebound up from support line of upward wedgeHello traders, I want share with you my opinion about Bitcoin. In this chart, we can see how the price dropped from the 102800 support level, which coincided with the buyer zone, and later entered to wedge upward. In this pattern, price made an impulse up from the support line of the wedge pattern and broke the 102800 support level, after making a retest, and continued to move up. Bitcoin rose to the current support level, which coincided with a support area and even entered this area, but soon turned around and fell below. Next, price rose to this area again and then made a correction movement, after which it turned around and made an impulse up to the resistance line of the wedge, breaking the 108000 level. After this movement, the price bounced from this line and fell back to the current support level, where it some time traded in the support area. Later price rebounded and continued to move up. Now, I expect that BTC can correct to support line of the wedge and then rise to the resistance line of this pattern. That's why I set my TP at the 112600 points, which coincided with this line. Please share this idea with your friends and click Boost 🚀
Disclaimer: As part of ThinkMarkets’ Influencer Program, I am sponsored to share and publish their charts in my analysis.

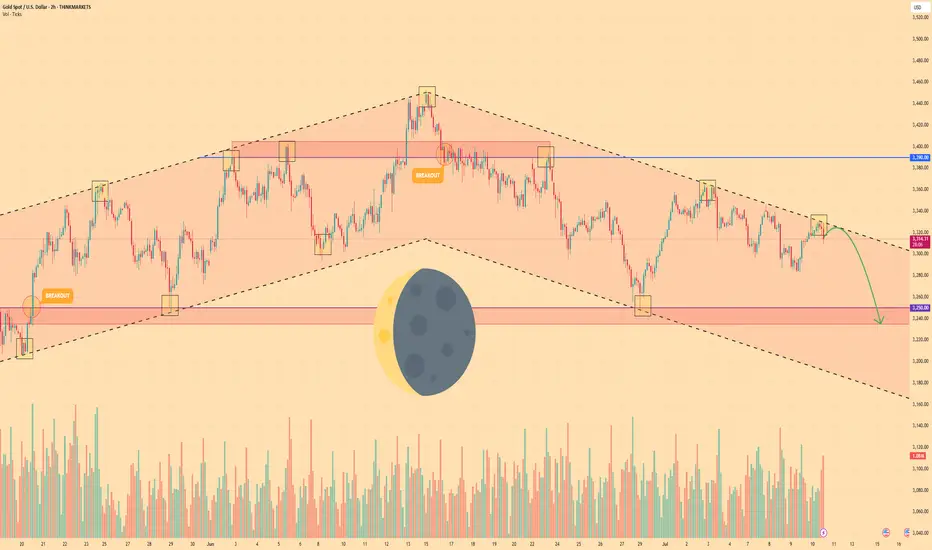
GOLD - Price can bounce down from resistance line of channelHi guys, this is my overview for XAUUSD, feel free to check it and write your feedback in comments👊
Gold broke out of its long-term rising channel and hit $3390 resistance level before momentum definitively stalled.
That failure marked a shift in control, as sellers forced price into a falling channel, establishing lower highs and lower lows.
Price fell to support level, after whcih it turned around and bounced up to resistance line of falling channel.
Now, Gold tests the upper boundary of the falling channel near $3318, where each bounce has been capped by declining volume.
Key support lies in the $3250 - $3235 area, aligned with multiple prior demand tests and the former rising-channel floor.
I expect Gold to reverse from the channel resistance and slide toward $3235, decisively breaking below the $3250 level.
If this post is useful to you, you can support me with like/boost and advice in comments❤️
Disclaimer: As part of ThinkMarkets’ Influencer Program, I am sponsored to share and publish their charts in my analysis.
HelenP. I Bitcoin can continue to fall and break support levelHi folks today I'm prepared for you Bitcoin analytics. If we look at the chart, we can see that Bitcoin has been trading inside a well-defined upward channel. The price recently touched the upper boundary of this channel for the second time and formed a clear reaction, indicating strong resistance. After this, BTCUSD started to pull back from the resistance zone around 110300 - 109800 points. At the moment, it is trading slightly above this support area, but momentum is already shifting downward. Given this structure, I believe Bitcoin is likely to continue its decline and break below the support zone. The previous upward impulse has already lost steam, and there are no signs of strong buying activity around the current levels. The next logical target in this scenario is the lower boundary of the channel, near the 107500 level, where the trend line acts as dynamic support. This level has historically served as a rebound point, and I expect it to do so again. My current idea is short, aiming for a move down toward the trend line. If BTCUSD breaks through the first support and confirms the weakness, the price could fall quickly and test the next support area around 105600 - 105000 points. But for now, I will be watching the 107500 level closely. If you like my analytics you may support me with your like/comment ❤️
Disclaimer: As part of ThinkMarkets’ Influencer Program, I am sponsored to share and publish their charts in my analysis.

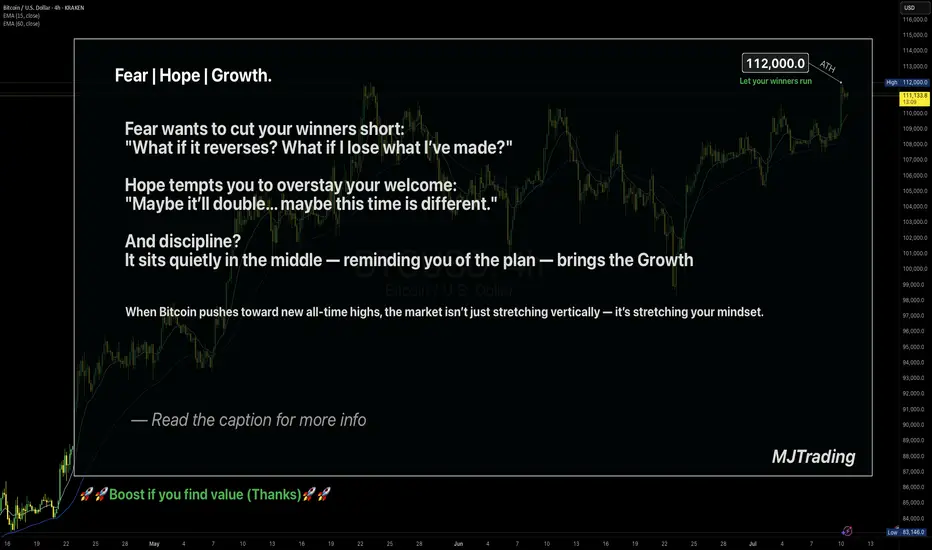
Let your winners run🧠 Fear | Hope | Growth – When Trading Meets Emotion
The message on the chart isn't just poetic — it's real psychology.
🔹 Fear wants to cut your winners short.
It sneaks in after a small move in your favor.
"What if it reverses? I better lock this in."
And just like that, a great trade turns into a missed opportunity.
🔹 Hope drags you into holding too long.
It dreams: "Maybe it doubles... maybe this time it'll be massive."
But it's not guided by data — it's driven by fantasy.
🔹 Discipline is what sits in the middle.
Quiet. Neutral.
It doesn’t scream or seduce — it just follows the plan.
And that’s where Growth lives — not just on the PnL, but in your psychology.
When Bitcoin pushes toward new ATHs, these emotions get amplified.
The real question becomes: Can you manage yourself, not just your trade?
📌 A Real Example from My Desk
In my earlier BTCUSD idea — “Another Edge – Decision Time” (shared above) —
I sent that setup to one of my managed clients.
He entered long exactly at the edge of the channel — a clean, strategic buy.
Price moved beautifully in our favor…
But he manually closed the trade at 106,600 — long before the move matured.
Why?
Because fear of giving back profit overwhelmed the original plan.
The chart was right. The timing was right.
But the exit was emotional, not tactical.
✅ The trade made money.
❌ But the lesson is clear: a profitable trade doesn’t always mean a disciplined one.
🎯 Final Takeaway:
“Fear kills your winners. Hope kills your timing. Discipline grows your equity and your character.”
🗣 What would you have done in that position?
Held longer? Closed at resistance? Let it run toward ATH?
Let’s talk psychology — drop your thoughts 👇
#MJTrading
#TradingPsychology #BTCUSD #FearHopeDiscipline #LetYourWinnersRun #PriceAction #BTCATH #ForexMindset #CryptoStrategy
ETH POTENTIAL BULLISH GARTLEY Seeing a potential bullish gartley forming on ETH if it is unable to break above the .886 of the AB wave. Targets would be $2004 to $1786 for the .786 or 1.618 of the BC leg

BTC: Demand Zone + QML + Trendline Flip = Perfect SETUPHello guys!
BTC is showing signs of a potential bullish reversal, forming a Quasimodo Level (QML) setup inside a valid S&D zone that remains unbroken despite multiple tests.
The downward trendline has been broken and is now acting as support, aligning perfectly with the QML and demand zone. giving us a solid confluence area.
Important to watch:
Rejection wicks and volume building at $106.6K–$107.4K zone show strong buyer interest.
If price can reclaim $109K and consolidate above, we could see a move toward $112K and higher.
Invalidation below $106.4K suggests the demand has failed, and bears may regain control.

BITCOIN facing the most important Roadblock of the Cycle.Bitcoin (BTCUSD) reached $112000 yesterday, testing the May 22 2025 All Time High (ATH) and immediately got rejected. This ATH rejection is key to the continuation of the bullish trend as the entirety of the ATH Resistance Zone is perhaps the last (and most important) Roadblock before the final rally of the Cycle that could potentially price the new Top.
You can see that this Resistance Zone already had 3 rejections previous on its bottom and yesterday was the first one on its top.
A break above it can target $118400 at least within days, in anticipation of a +10.20% Bullish Leg, similar to the one following the June 22 Low.
If the rejection prevails however, we may see a pull-back that will test the bottom of the (blue) Channel Up.
Which scenario do you think will prevail? Feel free to let us know in the comments section below!
-------------------------------------------------------------------------------
** Please LIKE 👍, FOLLOW ✅, SHARE 🙌 and COMMENT ✍ if you enjoy this idea! Also share your ideas and charts in the comments section below! This is best way to keep it relevant, support us, keep the content here free and allow the idea to reach as many people as possible. **
-------------------------------------------------------------------------------
💸💸💸💸💸💸
👇 👇 👇 👇 👇 👇

#BTCEUR #1D (Binance) Bull-flag breakout and retestBitcoin looks very good for bullish continuation after regaining 50MA support on daily, against the Euro.
⚡️⚡️ #BTC/EUR ⚡️⚡️
Exchanges: Binance
Signal Type: Regular (Long)
Amount: 12.0%
Entry Targets:
1) 93017.86
Take-Profit Targets:
1) 108422.28
Stop Targets:
1) 85296.36
Published By: @Zblaba
CRYPTOCAP:BTC BINANCE:BTCEUR #Bitcoin #PoW bitcoin.org
Risk/Reward= 1:2.0
Expected Profit= +16.6%
Possible Loss= -8.3%
Estimated Gaintime= 1-2 months

HolderStat┆BTCUSD fixed above the triangleBINANCE:BTCUSDT is rebounding from a consolidation base at $106,000 with strong bullish structure. The triangle breakout and recent higher lows point toward a move to $115,000–$120,000 if momentum continues.

Bitcoin to revisit $100k | Summer price target = $120kGeopolitical tension is causing fear in the markets. Today, Bitcoin fell from $107.7k to current price $105k with no sign of buyer support whatsoever, printing 11 consecutive H1 red candles intraday. Like a hot knife through butter.
At $105k, there is very little support. Sell volume absolutely overshadowed the tiny buy volume. Bulls have yet to close a green candle. I believe in the next few hours Bitcoin will be trading at $104k, followed by the first stop $102k.
$102k can serve as an entry point, depending on how price reacts. $100k is the optimal entry point for maximum profit, after mass liquidations. Retail traders are confident that the liquidity hunt is over after the initial tap, placing stops and liquidation levels at $100k.
Invalidation level will be beyond the 200SMA. The 200SMA have historically proven itself time and time again as a safe zone during rallies after golden crosses.

115.70K is the next one, 107K - RiskMorning folks,
Just to keep it short... our butterfly worked perfect, we've got our 111.65K target. Overall sentiment stands bullish. But - we do not want to see just stops grabbing around the top (aka Wash&Rinse). We want stable standing above broken daily trendline out of the flag consolidation .
So BTC has to stay above 107K lows to keep bullish context valid. That's why, if you plan to buy - you do not need to consider too far standing levels and lows for stop placement.
If, still, BTC drops under 107K, we suggest deeper retracement, under 100K level.
Conversely, if everything goes as we plan, next upside target is 115.70K.
So, if you plan to Buy: use local deeps on 1H chart and control 107K lows. This is your invalidation point.
If you want to sell: watch for clear signs of W&R of the top - engulfing patterns, spikes etc and following reversal patterns on 1h chart. Say, H&S, or any other.
For now I mark this setup as bullish.

XRPUSDT → Resistance ahead. Correction before growthBINANCE:XRPUSDT is rising after breaking through consolidation resistance. Bitcoin's rally supported the overall market momentum, but a new resistance zone lies ahead...
Bitcoin is testing its ATH and updating it, but is facing pressure and forming a false breakout. A correction in the flagship coin could trigger a correction in XRP, but if Bitcoin continues to storm the 112K area without a pullback, followed by a breakout, the market could find support and continue to rise.
After XRP broke through resistance, the coin entered a distribution phase and is testing an important resistance zone of 2.4488 - 2.4772. The inability to continue growth, a false breakout, and price consolidation in the selling zone could trigger a correction.
Resistance levels: 2.4488, 2.4772, 2.6524
Support levels: 2.3587, 2.3375, 2.2455
Despite breaking through resistance, XRP is still in a local downtrend. Pressure on the market is still present. The formation of a false breakout will indicate that growth is limited for now. However, if the price consolidates above 2.4772 and begins to break out of the local structure, we can expect growth to continue.
Best regards, R. Linda!

$MARA at Resistance!NASDAQ:MARA continues its rally and has come into the High Volume Node resistance target and R2 daily pivot.
Daily 200EMA was tested as support after price smashed through. I expect continuation to the upside $24 target at the R5 daily pivot after some consolidation at this resistance.
Analysis is invalidated way below wave 2 at $13
Safe trading

REIUSDT Forming Falling WedgeREIUSDT is showing an encouraging technical setup that could pave the way for a potential price breakout. The pair has recently formed a classic falling wedge pattern, which historically signals a bullish reversal. Backed by healthy trading volume, this setup suggests that investors are positioning themselves early for what could be a significant upside move. With an expected gain of 60% to 70%+, REIUSDT is attracting the attention of traders who look for hidden gems in the altcoin market.
The REI Network project continues to gain recognition for its focus on creating a lightweight and high-performance blockchain, appealing to developers and users who value efficiency. This growing ecosystem and its active community are contributing to increased buying interest and renewed confidence in its long-term potential. Such fundamentals, combined with supportive technical signals, make this pair a strong candidate for swing trades in the coming weeks.
Technically, traders should watch for a decisive breakout above the wedge resistance line, which could trigger rapid price action towards the projected targets. Monitoring volume spikes and daily closes will be crucial in validating the strength of this breakout. As momentum builds, REIUSDT could deliver solid gains for traders who are prepared and patient with their entries.
✅ Show your support by hitting the like button and
✅ Leaving a comment below! (What is You opinion about this Coin)
Your feedback and engagement keep me inspired to share more insightful market analysis with you!

#BTC Update #5 – July 10, 2025🟠 #BTC Update #5 – July 10, 2025
Bitcoin is currently trading inside a supply zone and seems to be preparing for a corrective move after its impulsive rally — but the first clear step of that correction has yet to appear. At the same time, USDT Dominance is hovering near a support zone. If it bounces from here, Bitcoin’s pullback could accelerate.
Additionally, BTC has approached a previous resistance level, making it an uncertain area for new entries. At this stage, I don’t find it logical to open either a Long or Short position. Once the correction completes, the first major target is likely the 123,250 zone.
For now, I’m just monitoring. No trade recommendation at this time.

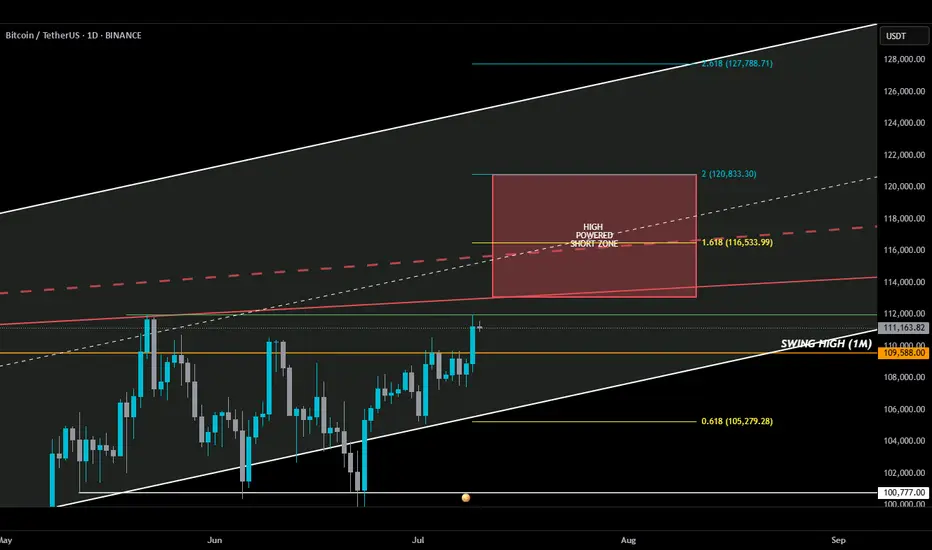
HIGH POWERED SHORT ZONE 2.0HIGH POWERED SHORT ZONE ⚡️
Usually, a 3% move doesn’t make anyone blink—but this one? It sent BTC into all-time high territory. I almost popped the champagne… until I remembered I’m in a short.
Not because I don’t believe in upside—but because my add zone in the HIGH POWERED SHORT ZONE hasn’t been tagged. Yet.
Here’s the breakdown 🧵👇
________________________________________
Before anyone goes bUCK wilD and cracks open that dusty bottle of Veuve, double-check something:
📅 The July 10th daily candle needs to close above the monthly swing high (orange line).
If BTC bulls lock that in, then a move deeper into the HIGH POWERED SHORT ZONE becomes real...
play-the-game real…
________________________________________
Where’s this HIGH POWERED SHORT ZONE coming from?
🔻 Solid red line – a trendline from Dec 2024 that has held strong through three separate tests — marking it as a key line on the sand.
🔻 Dashed red line – goes all the way back to Dec 2017. A seasoned veteran of resistance.
I also drew in a white ascending channel—not just for looks. If BTC breaks out, this channel will help us ask:
“How high is too high?”
________________________________________
Now enters Fibonacci — where nature maps out key alignments on the chart. 🌱
🟡 Gold lines = Fib golden ratios
🔵 Teal lines = Fib Degen Ratios
It’s wild how they just line up:
• 2.618? Right on the top of the channel.
• 1.618? Sitting on the 2017 trendline.
• 0.618? Near current support + bottom of the channel.
Also had to draw that horizontal support white line to keep an eye on.
A Bounce or bust? Ask the bUCKmOON!
Bitcoin's New All-Time High = Altcoins Market Bull MarketThe shy new all-time high is in and it is good to be Bitcoin today. It is good to be Bitcoin, to be in Bitcoin and profit while trading Bitcoin but the bears got rekt and that's oookkkk. We accept their loss and it is their loss they earned it by being short when the market is good, bullish and strong. Who would short Bitcoin right before a new all-time high? I don't know.
A new all-time high was hit today, the price $112,000 but this is not the end. Not even close. This is the beginning of the next bullish wave.
I know what you are thinking, or might be thinking; Wait, but what about a drop? What about the correction? Will it go lower? Can I buy Bitcoin at 90K? I told you to buy when prices were low... "You would look like a genius for buying below 80K," 100K is already gone. No, no correction! Bitcoin is going up.
When resistance breaks it means higher. When prices move higher it means higher. When a new all-time high hits it means the bulls win. Now that the bulls won, the battle for the rise or the drop, we can expect higher prices. If you have any doubts, look at the altcoins. The altcoins market says we are entering a period of long-term growth.
Bitcoin will continue to hold strong. It will continue to rise surely, slowly, or fast, but long-term. It doesn't matter the speed; Bitcoin for the whales, altcoins for retail.
A small capital will grow faster with the altcoins because they have higher room for growth. The projects being smaller, more volatile makes for a good trading experience. Higher risk but also a higher opportunity to grow in the short- and mid-term. Bitcoin is good to retire now. Bitcoin is great to hold value, to support the market as it continues to grow.
For me and for you, welcome to the altcoins market bull market.
Thanks a lot for your continued support.
Namaste.

Bitcoin's Consolidation Almost Over —200-220 DaysBitcoin's consolidation period before a bullish breakout tends to last some 200-220 days on average. We have four instances of this pattern since the 2022 bear market counting 2025. Let's look at those. This proves that Bitcoin is set to grow in a matter of days. Continue reading below and make sure to boost. When you reach the end of the article leave a comment with your opinion about this issue. Do you agree? Do you disagree? Can you see what I mean?
» Back in 2022 Bitcoin consolidated for 203 days before a bullish breakout.
» Back in 2023 Bitcoin consolidated for 203 days before a bullish breakout.
» Back in 2024, last year, Bitcoin consolidated for 217 days before a bullish breakout.
It really depends on where you start counting for the total days but it all adds up to 200-220 days. With 220 being the maximum.
» Currently, in 2025, Bitcoin has been consolidating for 210 days. Looking at previous patterns, this means that only a few days are left before Bitcoin produces a bullish continuation.
We also saw that once Bitcoin breaks out of a this long-term consolidation range/period/phase, it never moves back to the lows of the consolidation range. That is, Bitcoin will never trade below 80K nor 90K once it resumes growing.
I am estimating that the next jump can start as early as next week. The entire move can take months to develop. After a peak is reached, Bitcoin will then start a new consolidation phase with a bearish bias first. This bearish bias produces a low after several months yet a strong higher low compared to the previous consolidation period which is current prices. After this low, more consolidation and then a new bullish jump.
If we take into consideration a bear market, then the dynamics can be different. Bear markets only happen once every four years. Seeing how different market conditions are now, the next bear market will be interesting because it won't be anything like the bear markets of the past. Bitcoin will remain much stronger but that is an analysis for another time.
Summary
Bitcoin is going up. It is very close now. When Bitcoin breaks up and hits a new all-time high, just to continue growing, the altcoins market will explode. You've been warned.
Now you can leave your comment.
Share your opinion on the comments section below. I know you have something to say. You've been trading Cryptocurrencies for years, buying and selling, making profits so... Are you ready for the 2025 bull market?
Thank you for reading.
Namaste.
