Btc_d
#BITCOIN #DOMINANCE ANALYSIS#BITCOIN #DOMINANCE ANALYSIS
In the daily chart of Bitcoin dominance, support is seen in the range of 40 with divergence. Meanwhile, the dominance is approaching its downtrend line. For this reason, the range of 49 growths can be expected to occur.
If range 49 is also broken. Due to the formation of the pattern of double bottom, we can expect growth to continue in the range of 60.
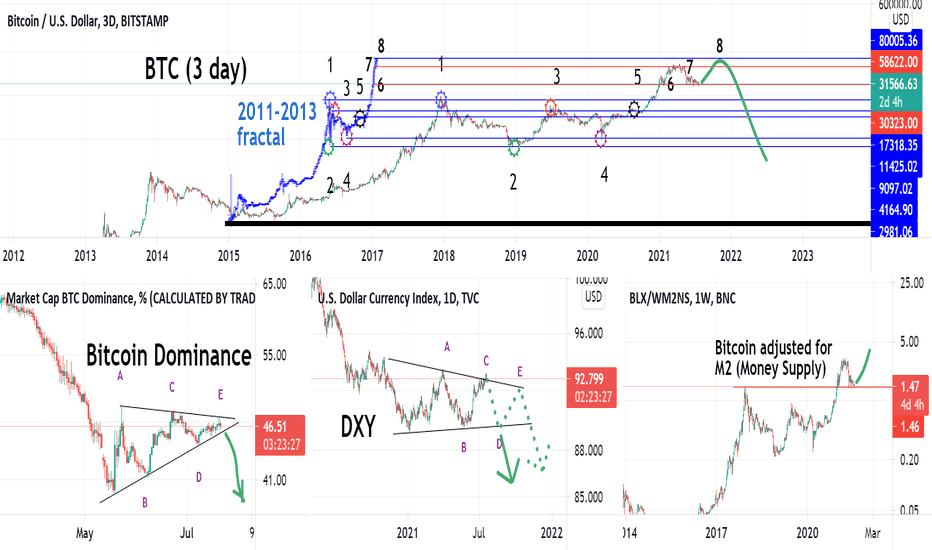
BTC - BTC.D, DXY, M2, 2013 fractalI created this combo chart to get more overall view on how BTC is ready to continue bull run to the market top.
1) 2013 fractal had 50% dip (Nov 2013) just before the last leg up. Fractal matches this dip.
2) Bitcoin Dominance completing triangle. So now it should drop for the final BTC capitulation to altcoins.
BTC will rise in price as well.
3) Dollar Index peaked above trend line. I suspect fakeout. DXY drops, good for BTC.
4) Bitcoin adjusted for M2 money supply came back and tested the top. Classic pattern.
BTC 1H - Head and shoulder?As it can be seen, BTC broke the downtrend line, it waits for what? I think it starts to make a right shoulder as a pullback to a broken trend line. we look forward to breaking the neckline. if it will fail, we are waiting for 20K.
Hey guys, care about BTC dominance too, I think it will be supported on the 43% level.
what will be happened if BTC will be upward and BTC.D too?
$BTC.D - Upside potential? Slowing Alts?50K has been breached, the rising wedge top trendline has been flipped
Firms are looking to add BTC to their asset sheets to in the short term future
Thus, the BTC.D looks like it should make a leg up
As we do have a rising market cap though, I would not say ALTS will dump, I just think their growth will slow on the whole
It is likely LTC ETH XRP DOT will be some of the few to continue with BTC, while other coins stall somewhat
Or we just see both rise anyway cuz BULLRUN


