Btc_usd

BTC/USDTplzzz like my idea becoz i fell veryyy good after gaining like
bitcoin technical analysis
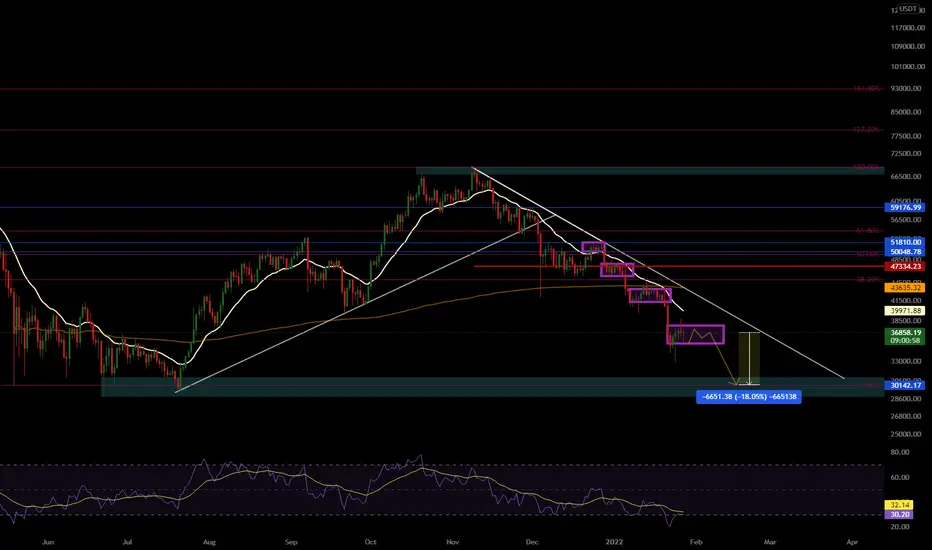
in this stage i guess btc will little volatile
so don't trade in top 100 to 200 altcoin
wait for btc brice hit 30k then gonna to invest any coin
more information mension in my idea pic so watch and learn and also tell me our idea chart is right or not
plzzz like my idea becoz i fell veryyy good after gaining like
plzzz like my idea becoz i fell veryyy good after gaining like
plzzz like my idea becoz i fell veryyy good after gaining like
plzzz like my idea becoz i fell veryyy good after gaining like
BTCUSDT Support/resistance levels, Thu Jan 27, 2022, BigdataCurrent support/resistance levels:
– 33550 USDT
– 34487 USDT
– 35263 USDT
– 36081 USDT
– 36893 USDT
– 37955 USDT
* Calculation is based on 25.8M of trades

BTC/USDTI think Bitcoin starts a new bearish wave with an expanded triangular pattern and have some TPs. It is also in a bearish channel if the channel is breakout as a result bitcoin can dump to other TPs.
See chart.
TP:
1-34700
2-32400
If 32400 break out, Bitcoin can dump to the others TP and other TPs will be active.
TP:
1-30000
2-28400 (middle of the second channel)
3-25000 (bottom of the second channel)
what's your idea?

BTCUSD trade update UPDATEClose most of my short on that last big push down. Still holding this long trade so far im 7 for 7 this week.
I adjusted my target and my stop loss so I had more room to breath, as mentioned in my TG
Holding strong hoping for 100% win rate this week, fingers crossed :)

Today's BTC/USDT🧨There was a very important drop, probably due to the latest news from several countries about the ban on the circulation of cryptocurrency.
It's time to buy in the interval between 33 and 38, and it is possible that even more interesting moments for purchases will open for us.🥂
I love you all! 💋🍾

WEEKLY HIGH vs WEEKLY LOW ✅I tried to show you in this example how i use weekly high / weekly low to spot intra-week reversals bearish or bullish.
Just look for a drop below previous weekly low and a bullish confirmation - intra week bullish reversal
Look for a rise above previous weekly high and a bearish confirmation - intra week bearish reversal
Plain and simple, have a great trading week. ✅✅✅

BTC Bull Trap 4HBitcoin bulls seem to be painting a trap going into Fed announcement today and with many altcoins already painting lower highs this seems to confirm the case. If the downtrend channel is to remain intact and the bottom is going to be at the 13K macro cycle level which is needed to reset the whole structure then this is a possible route Bitcoin may take given that there is significant support at 30 K or the Michael Saylor line and then again at 20K being the previous ATH set in the 2017. The 200 Weekly MA is just below the 20k support level which should also act as an area where bulls will be placing bids. Today is a day not to trade but simply await the Fed announcement and act accordingly.
Trying to get enough community point so we may engage constructively in the chat. Any support would be greatly appreciated. Thank you very much in advance.

The last chance to buy bitcoin below 30KBefore we start the next bull market, we will see 28.5K , there is definitely a last chance to buy cheap bitcoin .
good Luck

Bitcoin(BTC) LONG TO $40KBTC going on an A-B-C correction which is very common after a good 5 wave impulse
Blue 5 wave Elliot wave from 2017 to 2021
ABC corrective wave in RED
Wave C is an irregular correction(Wave B ended above start of wave A) and is of 5 wave series in PURPLE
Wave C has two more waves to go sub wave (4) and sub wave (5)
I believe there will be a more complex sub wave 4 in bigger Wave(C) which might go up temporarily to 40K before the final sub wave 5 ends around 26K
The retracement of the subwave 3 of Wave (C) and the fib extension of subwave 2 have a great resistance 40K, so I believe in short term BTC might go to 40K with wave 5 before it goes on final subwave 5 and then reverses
Happy trading and please leave feedback

BTCUSDTit still goes on the down price channel as ive posted the same analysis before on November..for me I've bought from the last support 34 and I would still buy if it goes down more ..but once it breaks out the down price channel I'd draw then the up price channel .

#BTCUSDT #4H#BTCUSDT #4H
Hi guys..its the latest analyze chart of #BTCUSDT in 4h time frame(folowers Requested analysis) .if you are interested any crypto that you want analyze with me and any questions please do not hesitate and comment below the chart!
if u like it press like-comment and folow me. thx

BITCOIN LONGS 💰💰💰Expecting bullish price action on this asset from a mid term - long term perspective as price is in a bullish uptrend from a w1 premise, we filled the bullish imbalances and rejected the w1 bullish orderblock on d1 with a huge ,, MARGIN CALL SPIKE,, also price took out a lot of stops below sell side liquidity 40k where a lot of orders where sitting, targets are above liquidity 50k
What do you think ? Comment below..
P.S i will look for a re-entry if price takes out SSL on 29k

$BTC price movement predictionThe price is expected to reach the support area on January 9, and if the price remains in this area, then it will begin to rise to a new high, provided that it does not close 7 consecutive days below this support.
Good Luck in your daily trade.

BITCOIN, BTC, DAILY TRADE, SIGNAL$Bitcoin looks heavily oversold on every timeframe but the pain doesn’t look like its over yet. A classic case of what goes up must come down and reverse. In the case of #BTC a little more down to 30 before we can clearly see a solid move up.

BTCUSDT - Head & Shoulders Possibility on Daily ChartHey guys,
With the most advanced trend line in place, this seem like a head and shoulders formation to me.
It's highly likely to revisit 30K area in the next couple of weeks or days maybe.
In H&S formations, it mostly visits the starting point of the run and it sits around 30K as stated with the horizontal line in the chart.
PS: Always DYOR, this is not a financial advise.
Cheers.

BTCUSDT BTCBitcoin is moving in a downtrend channel where bears seem to have less power at the bottom of the channel.
To return to the uptrend, the top line of the channel must be broken with strength, otherwise the bitcoin will move neutral or downtrend for a while.


BTC New update Analysis 2022BTC Update 23/1/2022 Simple and clear Analysis Explained everything on Chart
My 5 Bullish confluences on High Time frames.
1)Strong Demand Zone
2)Bullish OB Weekly
3)Strong Trendline Restest
4)Price Reversal Area
5)FVG Fill

BTC/USDT.....18000$🙄😲😲😲😲😲😲😲😲😲if bitcoin in weekly time frame had close candle bellow the 31600 $, this is big sign for reduce to around 18000 $ which is bottom of ascending channel in weekly time frame.. because if bitcoin want close candle bellow 31600 $,it create double top pattern and will reduce to18000$.
what do you think?

BTC/USDT.....20000$🙄😲😲😲😲😲😲😲😲😲if bitcoin in monthly time frame had close candle bellow the 35000 $, this is big sign for reduce to around 20000 $ which is bottom of ascending channel in monthly time frame.. because if bitcoin want close candle bellow 35000 $,it create double top pattern and will reduce to 20000$.
what do you think?

BTC WEEKLY ANALYSIS BTC / USD
Bitcoin got dumped hard recently and it’s the first time to test 100W EMA since April 2020 !
As we see in chart this 100W EMA (dynamic support) is very important …every time price closed weekly below it massive crash happens after
So now all the eyes on moving average + 30k Strong support
Bulls should show strength here or the pain will continue may be up to 20k
Pleas Note that Price can also stay longer time playing in this range for some more weeks before next decisional movement
Always adapt with the market changes
And Enjoy your time

BITCOIN Level to holdLet's see if the daily demand holds for this leg up. Yearly S1 for 2022 is around 26k.
